The “Policy Maker’s” Peculiar Institution
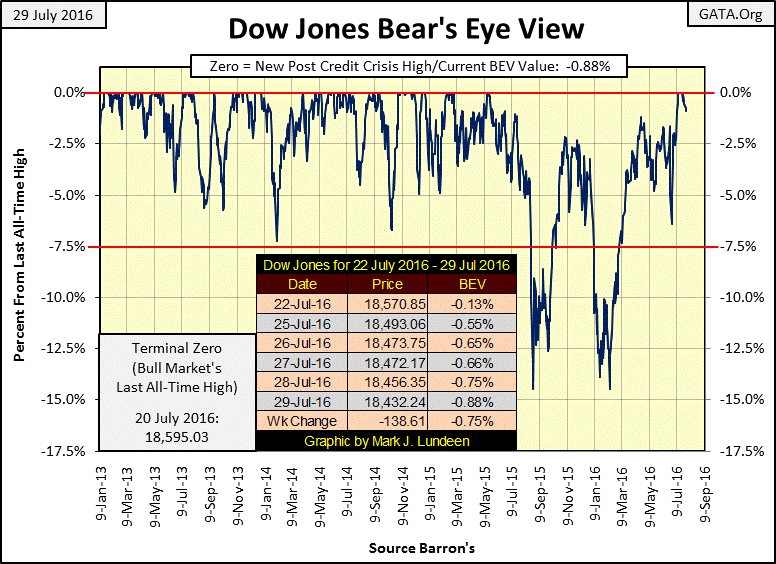
Two weeks ago the Dow Jones Index made seven consecutive new all-time highs. Since then the market has been digesting these new BEV Zeros with the Dow closing never more than 1.00% from its last all-time high. Are there more BEV Zeros to come? Could be, but I wouldn’t be surprised if the Dow’s last all-time high of 20 July 2016 also proved to be the last of the post-credit crisis advance.
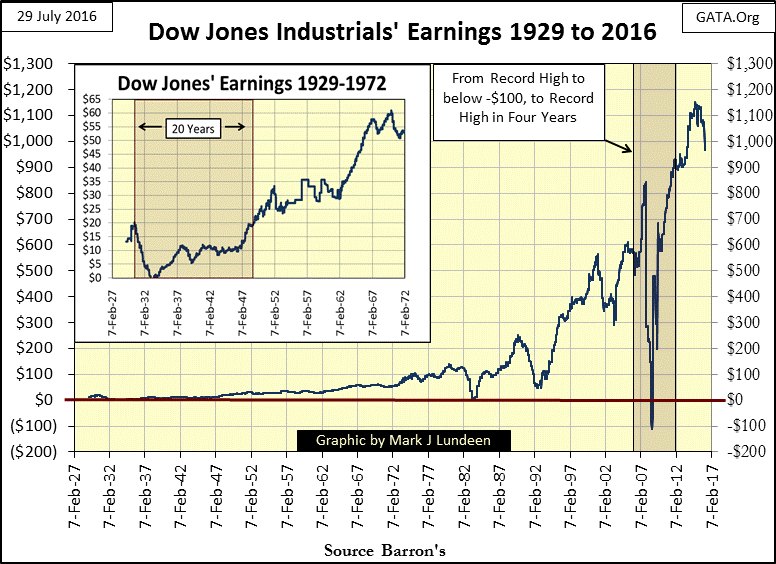
For one thing, reported earnings for the Dow Jones are coming down. They peaked at $1,154 in October 2014…and since then have done nothing but decline. Note, the earnings seen below are “per share.” As a result of corporate America’s share buyback programs, a significant percentage of the public float of the Dow Jones companies have been removed from the floor of the NYSE since October 2014. How much of a percentage I don’t know. However, even if only 10% to 15% of the float were absorbed by their parent companies, these share buybacks would have supported the reported “per share earnings” seen below.
Be that as it may, after what we saw the Dow Jones earnings do from 2007 to 2011, where in four years its earnings crashed from record highs to negative values for the first time since the 1930s, only to then go to new all-time highs in 2011. Consequently, I have to believe that what passes for earnings today is something completely different from what they were decades ago. After the 1929 crash, it took twenty years before the earnings for the Dow Jones recovered to their highs of the 1920s.
No matter, as we are constantly told by “market experts” on CNBC and elsewhere; as goes earnings so goes share prices. So I’d have to ask Mr. Wizard; after seeing the earnings for the Dow Jones do nothing but decline for the past two years, why is the Dow Jones going up to new all-time highs again?
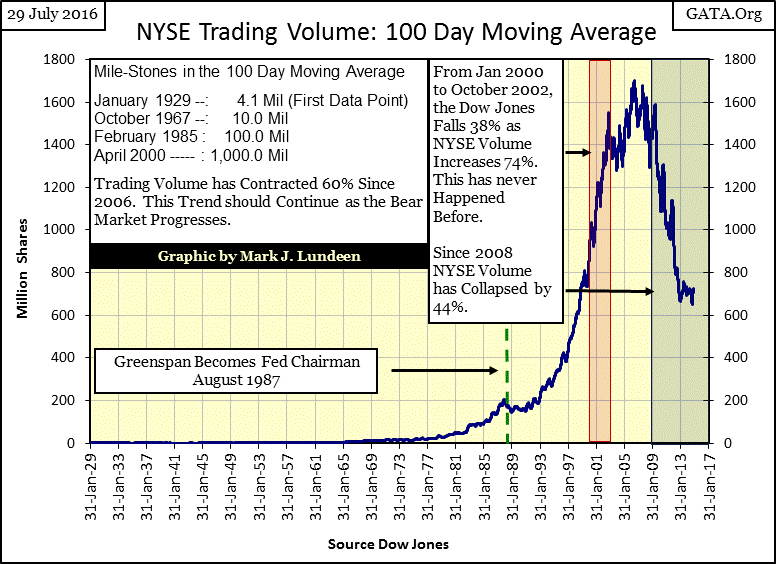
It isn’t because demand for shares, as seen in daily trading volume at the NYSE, is surging to new all-time highs. Rather, since 2006 demand for shares trading at New York has collapsed, as major market indexes have advanced to new all-time highs. That just isn’t right.
Look at how the market worked for the eighteen years spanning from 1900 to 1918 below. The Dow Jones saw new all-time highs in 1901, 1905 and 1916. To be sure each bull market saw trading volume at the NYSE expand. The Dow Jones saw big 45% bear markets in 1903, 1907 and 1914, each on collapsing trading volume. And up to January 2000, as the high-tech bull market saw its final top, this was how the stock market worked. But then after January 2000, the “policy makers” have had their meat hooks set deep into the financial markets, and now nothing works like it used to.
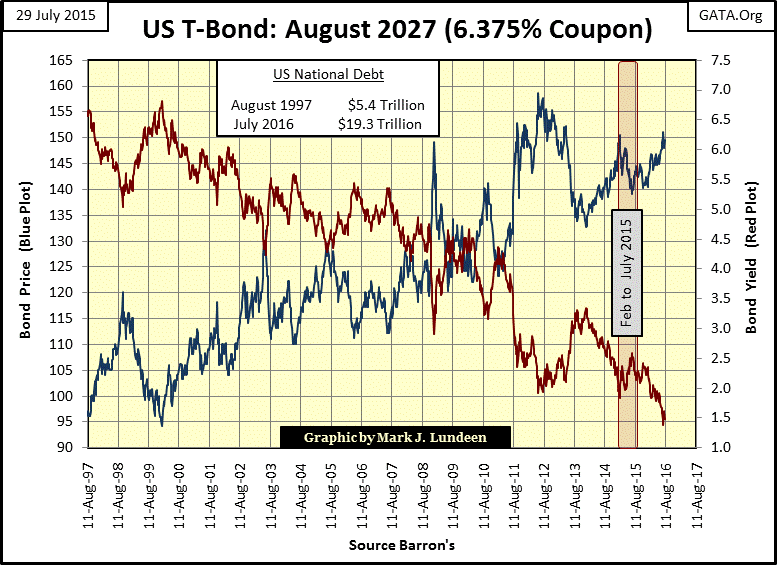
It’s not just the stock market that’s behaving strangely. Next is a chart for a US Treasury 30-year bond I’ve tracked weekly since its issue in August 1997. In August 1997 the US national debt was an alarming $5.4 trillion dollars. Two decades ago, that priced this 30-year bond with a 6.375% coupon.
Today the national debt is over $19 trillion dollars, not that anyone actually cares in the Treasury market. Each new 30-year bond issued in the past twelve months have had coupons of never more than 3.0%, some as low as 2.5%. In the next few weeks the Treasury should issue its next 30-year bond, and I suspect its coupon will be something less than 2.5%.
“Market experts” all agree that bond yields have no place to go but down. So, when the national debt goes above $20 trillion, will coupons on the newly issued long bond collapse below 2%? If Fed Chairwoman Yellen says they must to “stimulate growth”, who am I to disagree?
And look at this bond below; today people are standing in line to pay $1.50 for a bond that can only pay back a $1.00 eleven years from now. And as they wait for their guaranteed 33% loss of principal, they’re receiving an annual return of only 1.47%. What? You don’t believe New Yorkers aren’t willing to sell the Brooklyn Bridge to the rubes managing your pension fund?
Well they are. And it’s a sad fact of life today that in order to save their precious banking system, the “policy makers” have made it absolutely impossible for savers and fiduciaries to find income; even the pathetic returns seen below, without a mathematically guaranteed loss to principal.
Is it possible for this market to maintain its current low yield / overvalued price equilibrium? Where savers seeking safety are guaranteed massive losses as they receive a pittance in annual income while they wait to get scalped? One of these days the lights are going to come on, and people will flee for their financial lives from the fraudulent manipulation seen below. On that day we’ll see T-bond yields rocket upwards towards double digits, as gold and silver prices head toward the moon.
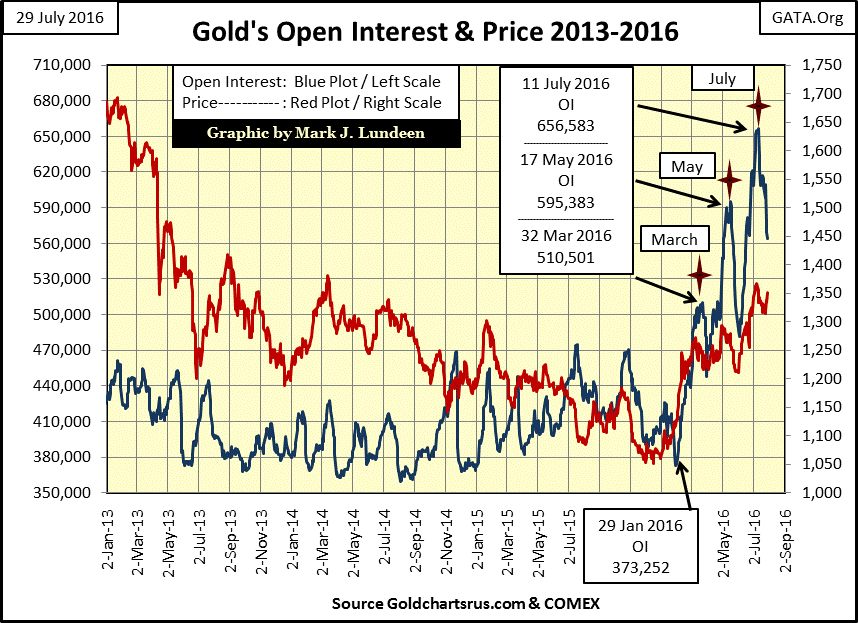
So how did gold and silver do this week? They could have done better. But in the past under similar circumstances they would have done worse. For the third time in 2016, the “policy makers” have engineered a collapse of open interest at the COMEX gold market (Blue Plot below), with minimal effect on the price of gold (Red Plot). That gives me a warm feeling!
What are the big banks going to do now? Heck if I know. But these guys are stuck holding on to what is increasingly looking like the shitty end of the stick. If they let gold and silver prices find their actual fair market prices, what happens then? Gold over $2000…silver over $100?
If that’s the case, can the banking system avoid a default at the COMEX? And then what happens to bond yields and share valuations? Insurance companies and pension funds, as well as individuals in the financial markets actually need to show a profit. Should gold, silver and the PM mining shares continue their advances, they’ll create tremendous pressures for current holders of stocks and bonds to sell what isn’t offering much in the way of a return, and begin buying what is – gold, silver and the PM mining shares. Precious metal assets are tiny markets. What happens when tens of trillions of dollars, now sitting in stocks and bonds begin to flow towards them?
Should that happen, and it will, there are hundreds of trillions of dollars in interest rate derivatives that will come into the money. The banks are counterparties to these contracts, and there is no way they can make good on their hundred-trillion dollar obligations when interest rates rise as the bond market deflates. So they will do everything within their corrupt means to prevent this from happening.
So my guess is they’ll most likely run up COMEX gold open interest for the fourth time in 2016, by once again promising to deliver gold they don’t have and could never get, to people on the other side of these contracts who so far haven’t demanded delivery of what the banks don’t have and can’t get. But one of these days the longs will demand delivery for more gold than the banks can deliver, and then it will be game over for the “policy makers.”
Not that they’ll see it that way. One of the nice things about being a “policy maker” is that they don’t have to follow the rules. They believe they always have the option of changing the rules whenever they lose. Since Alan Greenspan was Fed Chairman that has always been the case.
About the time you think you finally understand the rules, even the one that allows the “policy makers” to cheat, market forces somehow manage to change them to where the old rules are no longer applicable.
Last week, gold and its step sum appeared to be making a new bear box. Five trading days later that’s no longer so. As I said, one really has to wait a month or two before a step sum box formation should be taken seriously. As it is now, the plots below for the price of gold and its step sum are telling me that market reality (the rising blue price plot) is predicting future higher prices for gold, while market sentiment (the stalled red step sum plot) is still suffering from the trauma of five years of declining gold prices.
If you want to see a picture of a bull market climbing its preverbal “wall of worry”, look no further than the chart below.
One day, the step sum (market sentiment) will once again recouple with the market reality of rising gold prices. Expect the price of gold to see some really nice daily advances as its step sum plot breaks above its highs of last March (242).
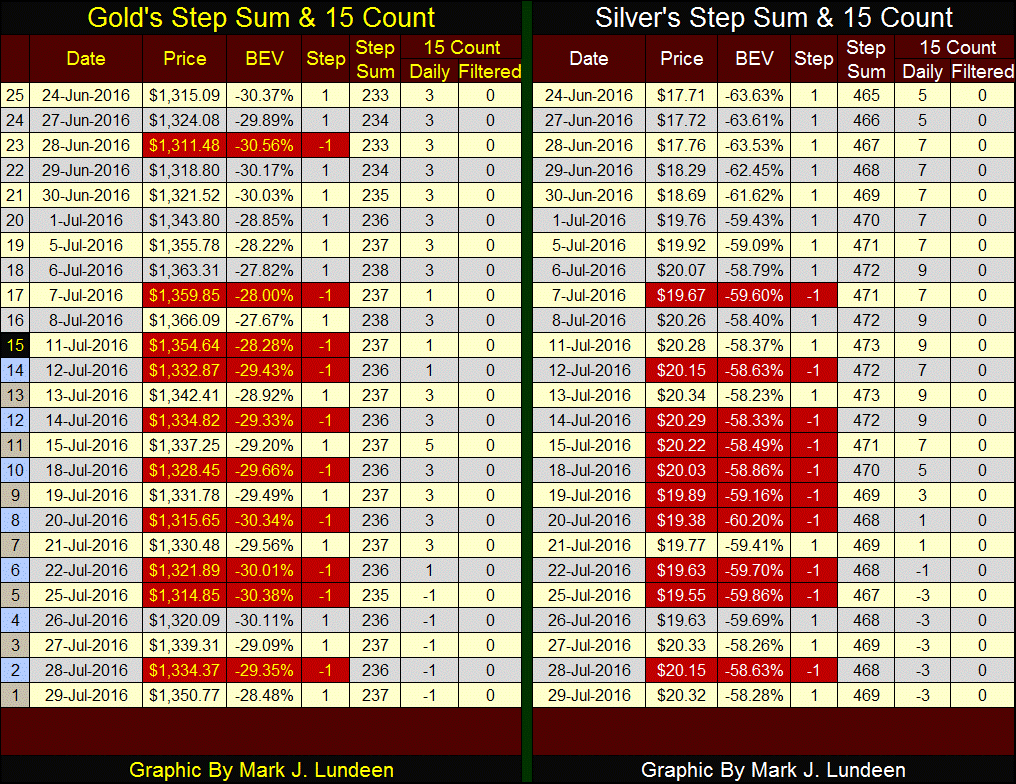
Gold and silver’s step sum and 15 count table below look very encouraging. In the past fifteen trading days (three trading weeks) both of the old monetary metals have seen more down days than up. Their negative 15 counts tell us that. Still, the price for both metals are holding up under the assault. One of these days the 15 count for both of these metals will once again be positive and in high single digits. I get excited thinking about the potential price gains when that happens in August or September.
Mind you, no guarantees my expectations becomes your market reality. But still, the above charts for gold’s Open Interest and its step sum, and silver’s step sum data in the table below, point toward a late July set up for some big price moves up in the coming weeks and months for gold and silver.
Walk around England’s cities and countryside and you’ll see who sits at the top of the social order. In Norman England (1066 to 1300) castles and cathedrals were the largest architectural constructions. The lords and their knights may have lived in their castles, but eight hundred years ago arch-bishops lived with more comfort and finer surroundings. Merchants too lived good, but not so well as to attract the unwanted attention from their betters.
With the reformation the churchmen’s position was knocked down a few notches, as the nobility’s station in society rose to the top. It was during the Tudor period (1485-1603) that England’s landed aristocracy stopped living in castles and began building their grand country estates. Queen Elizabeth signed the charter for the East Indian Company, a landmark event in the rise of the merchant class.
The growing influence of the merchant class wasn’t based upon the fear of violence as was the nobility, or the fear of hell as was the church, but with the making of money by providing goods and services in an expanding market place. With the rise of the merchant class came the construction of shipyards and docks, factories, and outlets for selling their wares.
With the arrival of the industrial revolution during the Victorian era, England’s landed aristocracy, and their grand country estates went into decline, as a new class in society, the Capitalist; base-born people who invented, and financed mass production, now came into their own. With the wealth created by mass production, for the first time since ancient Rome, cities once again had the means to construct water utilities and sewage systems that serviced even society’s poorest citizens.
The change in the English landscapes and skylines from the time of King Henry II in the 12th century, to that of the 19th during the reign of Queen Victoria was extraordinary. The transformation of society that came with the reordering of the social pyramid is best illustrated by a poem written by a Norman lord seven hundred years ago.
As bad as life was for an underpaid worker during the industrial revolution, living in the 19th century was far better for we commoners than during the 12th century when Bertran de Born; lord of Altaforte rode the English countryside. Still, with the possible exception of the age of industry, which ended with the arrival of World War One, the income tax and central banking, from one era to the next, the elite in society has always seen it as their right to extract wealth from the peasant and merchant classes as best they can.
As today’s politicians, bankers and academics know, there has never been a more successful scheme to extract wealth from the productive elements of society than with central banking.
"Bankers own the earth. Take it away from them, but leave them the power to create money and control credit, and with a flick of a pen they will create enough to buy it back."
- Sir Josiah Stamp, former President, Bank of England
The curious thing about the skyline of our cities, though they may appear similar to that seen during the 1950s, after decades of unchecked credit creation by central bankers, there is a huge difference.
Today, central bankers now occupy the pinnacle of the social pyramid, where once arch bishops, the landed gentry and capitalist towered over everyone else. So, if today’s urban buildings, the cars and pedestrians on the streets and homes in suburbia are burdened with tens-of-trillions of dollars of debt, created at virtually no cost to the banking system, it’s because central bankers thought this was a good idea, and no one was willing, or able to stop them.
The thing that makes central banking the “policy maker’s” peculiar institution; is that without the willing cooperation of its intended victims to enslave themselves with debt, it wouldn’t work at all. That’s why at the very beginning of the post-industrial world; our current era of credit, academics were courted by dark forces to administer the creation of credit, and to indoctrinate generations of students of the advantages of using debt over paying cash. But one aspect of educating students in the use of credit that is never taught; is that ultimately financing society by unchecked-credit creation is simply not sustainable.
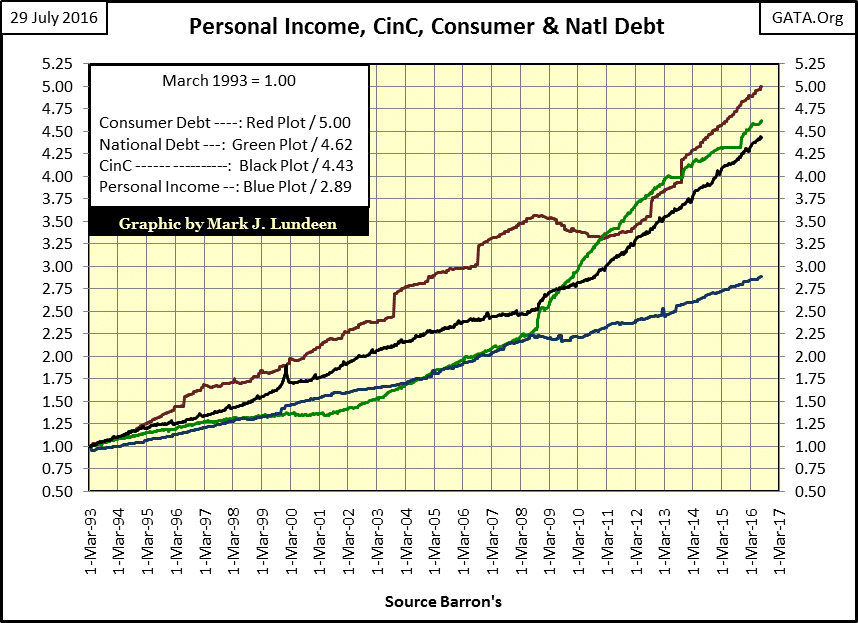
Today, the creaking edifice of credit now supporting the economy is doomed to crumble sooner rather than later. The reason is simple; as seen in the chart below. In just the past few decades, the burden of debt created by central banking (Red, Green & Black Plots) has outstripped the ability of consumers to service their obligations (personal income / Blue Plot). And have no doubt about it, the mounting debts assumed by government and large corporations also must be serviced by the wealth created by wage earners and small business owners, or be defaulted on. For the many tens of trillions of dollars in government, corporate and personal debt created since August 1971; default is exactly its destiny.
It’s important to know that this debt is also used as assets for pension funds and reserves for insurance companies, as well as to back the dollar these debts are denominated in. The pending and inevitable debt defaults will collapse the monetary system. For decades, Larry Parks, executive director of FAME has warned all who would listen:
“With the monetary system we have now, the careful saving of a lifetime can be wiped out in an eye blink.”
http://fame.org/notable-quotes
When this happens, don’t be shocked if the price of gold soars above $30,000 an ounce, or if in the main owners of gold would rather keep their ounces of gold than exchange then for any offered amount of paper money, backed only by the full faith and credit of the corrupt United States Government.
To most people today, five figure gold, or four figure silver prices seems farfetched. Then most people today have never made the effort to investigate the miserable five thousand year history of what government has done to their coin of the realm. As current “monetary policy” is to support stocks and bond prices far above fair market value, while subduing price gains for gold and silver, now seems the time to allow the “policy makers” to pay top dollar for your stocks and bonds, and then purchase as much subsidized gold and silver as you can, and still get a good night’s sleep.


