
Is The Bull Market In Stocks Over?
 share
share
 share
share
 share
share
 share
share
 share
share
Well, what a hammering the markets took on Thursday! There’s always a reason for this move or that and the Malaysia Airlines crash near the border of Ukraine and Russia and its potential consequences was the main driver in this case. However, we are right smack bang in the time zone for a top so it’s no surprise to see the markets start to head down. But the question remains, is the 5 year bull market in stocks now done? Well, it is way too early to confirm that. Perhaps a better question would be, is the current cycle top in? After yesterday’s spanking I began to think so. However, as the rally progressed today I began to have my doubts. I started to second guess myself. And that is exactly the mind frame the market aims to put us in. And I’m certainly not immune to its deception, its treachery. And being aware of this helped me to realise that, as it stands currently, the market is actually doing pretty much as expected so no need to fix something if it ain’t broke!
But let’s reassess things anyway, just to provide some peace of mind and regain any lost confidence. Before we get to the indexes, let’s first take a look at the VIX daily chart.
VIX DAILY CHART
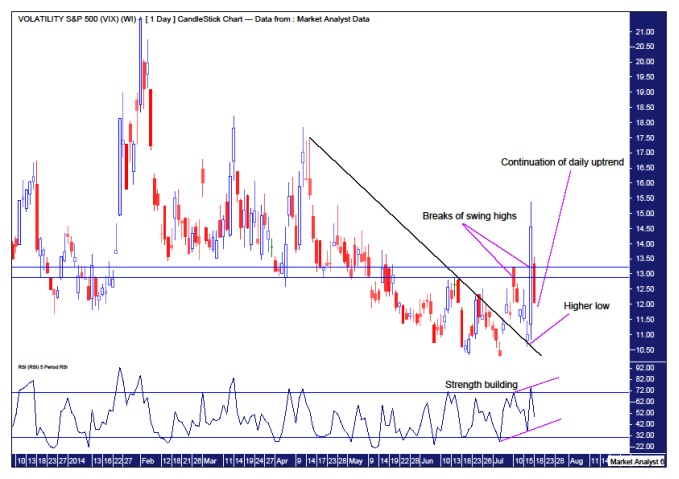
Wow! Look at that massive up move on Thursday. It finished the day up 34%. Surely one for the record books in terms of percentage gain. Probably no better example of the effect the Malaysia Airlines crash had on the markets, apart from I suppose the actual share price of Malaysia Airlines.
Note how the day after I put out my previous VIX report, price came back to test and hold the higher trend line before exploding higher the next day. The low on Wednesday was 10.59 which was just above the weekly PSAR support of 10.43 which I outlined in that report. Nice. And the close above the previous swing highs, denoted by the horizontal lines, and the fact that there is now an established pattern of higher highs and higher lows, means things look solid indeed for higher prices going forward. Some consolidation today is healthy for that expected up move. And the Relative Strength Indicator (RSI) shows that strength is building.
But does this positive action in the VIX mean the tops are in on the indexes. In a word, no. But it does suggest that if the tops are not already in then surely they can’t be far off. Let’s take a look at the Dow Jones Industrial Index first and then the Footsie to see what has transpired since my last update a few days ago.
DOW DAILY CHART
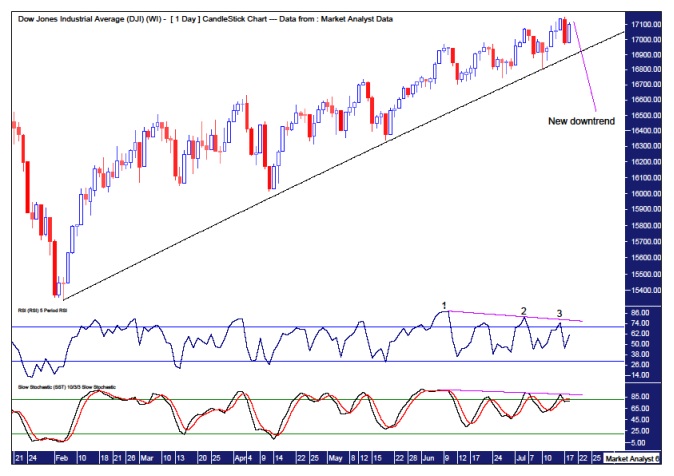
The current all time top at 17151 fell on the 17th July, one day after the most recent Bradley Model turn date. Nice. And looking at the RSI and Stochastic Indicator, this high was accompanied by a third bearish divergence. Even nicer.
So, on Thursday the Dow nudged marginally higher before reversing and starting to head south. Then around mid morning reports started coming through about the plane crash which helped push prices lower and this downward push accelerated in the afternoon.
Now I have a problem with news related moves. I view the moves as kind of artificial. I like the market to do its own thing without “outside influences”. The market can be like a little kid. Let’s call this kid Johnny. Johnny likes jumping off the couch. So he first climbs up on the couch. He then ventures to the edge and just before jumping Dad gives him a push and Johnny unwillingly jumps to the floor. That leads to a tantrum before he climbs back up to do it again. He has to do it himself. And in many ways the market is no different. It has to act of its own accord. It has to do things itself without being pushed. The news out of Ukraine was the push to send the market down. But as the market has to do it itself, it rallies or climbs back to where it started before it was pushed. The Dow was around 17120 before the plane crash news hit just after 11am. So perhaps the Dow can climb back to this level before jumping off again. And in this case the market is potentially jumping off the precipice!
I have also drawn the uptrend line from the February low and breaking that would signify the uptrend is most likely over. That support level is currently around 16900 and rising. Just a whisker away!
FOOTSIE DAILY CHART
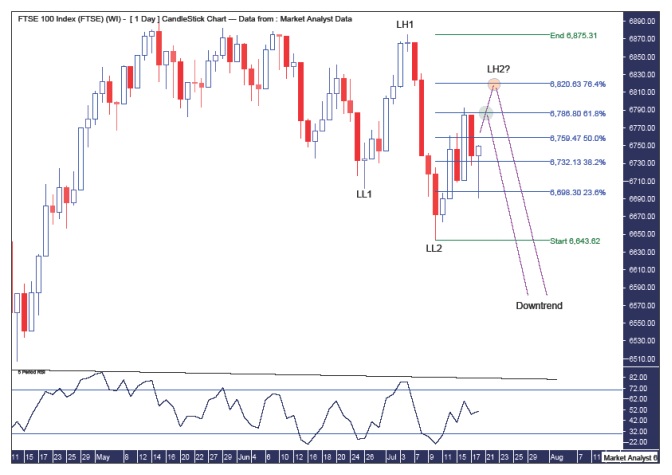
The Footsie is now showing a pattern of lower lows and lower highs on the daily chart – a bear trend. I have labelled the lows LL1 and LL2 while the recent lower high is LH1. Now we await the next lower high, LH2 which will hopefully be accompanied by a RSI reading that doesn’t break the down trending line. But where will that next lower high be? Well, I have drawn Fibonacci retracement levels of the down leg from the 4th July high to the 10th July low. So far, price has found resistance at the 61.8% level. Price actually went as high as 6792. I suspect that is it. Now price looks to have a little upward momentum currently so perhaps price can rise next week and tickle Thursday’s high at 6785. This is where I think price will turn back down and can be seen in the green highlighted circle. But that’s just my opinion.
Now, what if I’m wrong and price continues higher? Well, I don’t think my analysis is wrong but the market will be the one to decide that. So as a contingency plan, I looked at another possible level which is the 76.4% level which is at 6820 and can be seen in the orange highlighted circle. And if this were to occur then perhaps the Dow would also head to new highs with one last short covering rally up to around 17200. Much higher and I’m just completely wrong. But I’m not into any coulda, woulda, shoulda nonsense. I believe the tops are in. If you’re confident in your analysis, then sometimes you just have to grit your teeth and stick to the plan.
For those that like to skip to the conclusion, put simply, the VIX is rumbling and ready to rock n roll while the Dow and Footsie look to be peering over the edge but got a bit frightened on first look. Take the plunge!
share
share
share
share
share
More from Gold-Eagle


