
Calling A Gold Bottom…And This Is The Reason Why
 share
share
 share
share
 share
share
 share
share
 share
share
Summary
The latest COT report shows that speculators continued to close out gold positions at an extremely fast pace.
Despite the drop in gold, transparent gold holdings have actually increased over the past few weeks in contrast to what gold did during the 2013 drop.
This suggests that much of the gold drop may be due solely to speculators and now we are at much healthier speculative net long levels.
Premiums are rising for gold in India and China.
We think now is the time to buy gold as all of the evidence suggests a short-term bottom in gold rather than a new bear market.
Another big move by speculators as last week saw speculative positions in the Commitment of Traders (COT) report reach levels they haven't seen in months - and they did it in a very volatile way. Silver saw even greater action as those traders abandoned positions at an even greater rate than gold, which took down the net long speculative silver position to levels that are much healthier than we have seen in months.
We will also take a look at the "transparent gold holdings", which are the amount of gold held by repositories, mutual funds, ETFs and electronic precious metal sources across the world. That will give us an idea of what has really been behind this recent drop in gold.
While this week's drop was vicious for gold bulls, for long-time followers it should come as no surprise as we have been waiting for this drop for quite some time. We will take a look at speculative positioning to try and see if this is a good opportunity to buy gold or if there may be more downside, but before that let us give investors a quick overview into the COT report for those who are not familiar with it.
We will get a little more into some of these details but before that let us give investors a quick overview into the COT report for those who are not familiar with it.
About The COT Report
The COT report is issued by the CFTC every Friday, to provide market participants a breakdown of each Tuesday's open interest for markets in which 20 or more traders hold positions equal to or above the reporting levels established by the CFTC. In plain English, this is a report that shows what positions major traders are taking in a number of financial and commodity markets.
Though there is never one report or tool that can give you certainty about where prices are headed in the future, the COT report does allow the small investors a way to see what larger traders are doing and to possibly position their positions accordingly. For example, if there is a large managed money short interest in gold, that is often an indicator that a rally may be coming because the market is overly pessimistic and saturated with shorts - so you may want to take a long position.
The big disadvantage to the COT report is that it is issued on Friday but only contains Tuesday's data - so there is a three day lag between the report and the actual positioning of traders. This is an eternity by short-term investing standards, and by the time the new report is issued it has already missed a large amount of trading activity.
There are many different ways to read the COT report, and there are many analysts that focus specifically on this report (we are not one of them) so we won't claim to be the exports on it. What we focus on in this report is the "Managed Money" positions and total open interest as it gives us an idea of how much interest there is in the gold market and how the short-term players are positioned.
This Week's Gold COT Report

As investors can see, this week's report shows that speculative longs plummeted for the second week in a row by more than 43,000 contracts on the week. On the other side, speculative shorts once again took advantage of the drop in gold to increase their own positions by 8,091 contracts on the week.
We also want to point out to investors that short interest as a percentage of total speculative positions reached 19.11%, which is the highest since early February's 23.45% when gold was trading at $1209.50.
Moving on, the net position of all gold traders can be seen below:
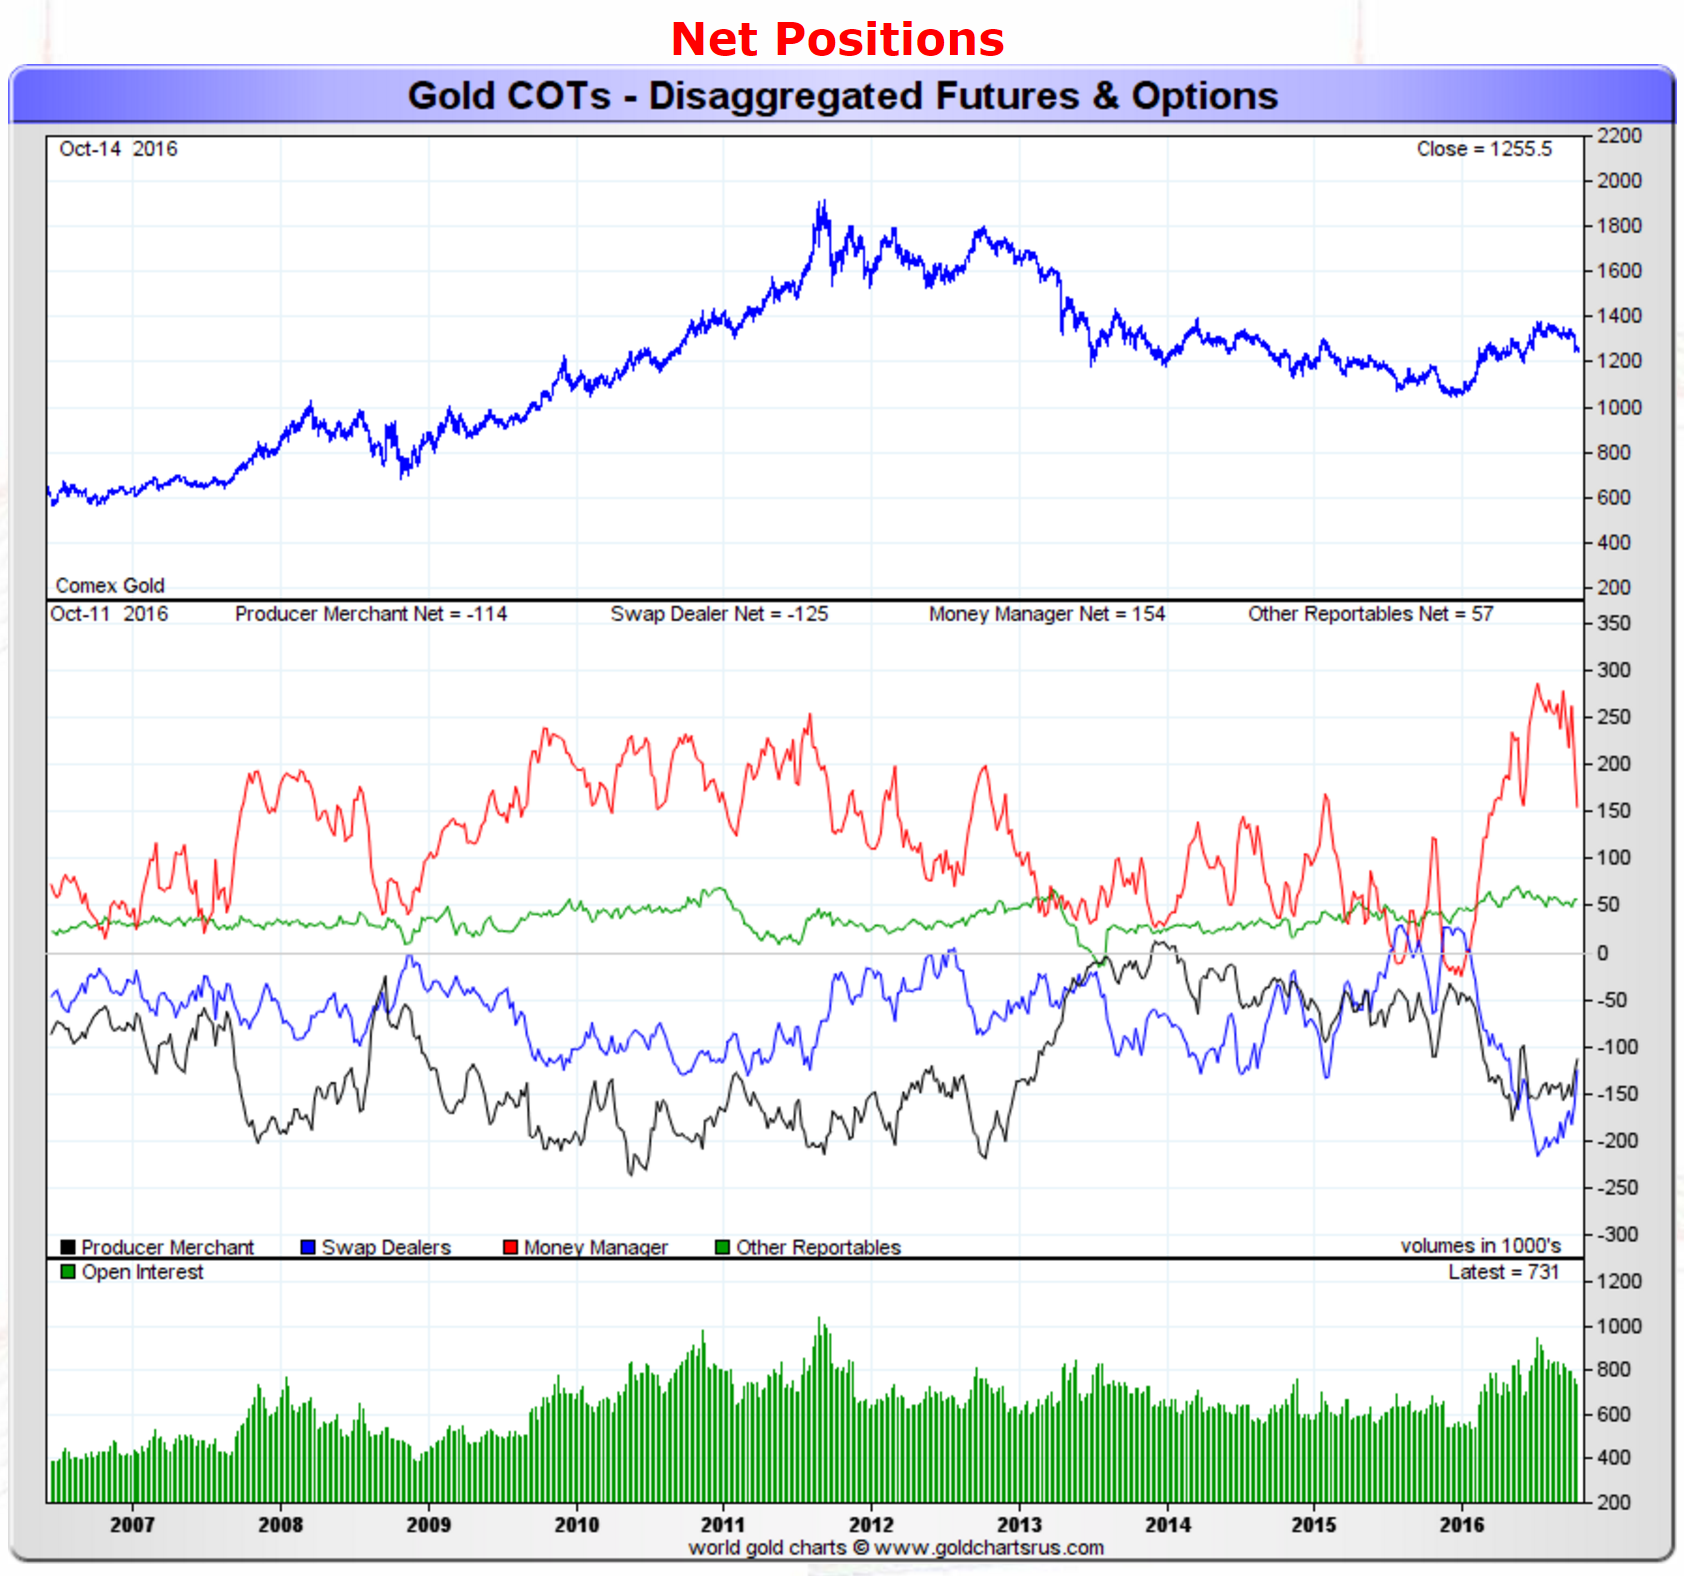
Source: Sharelynx Gold Charts
The red-line represents the net speculative gold positions of money managers (the biggest category of speculative trader), and as investors can see, speculative traders once again significantly decreased their positions for the week as they ended at a net long of around 154,000 contracts.
What that means for gold bulls is that we are now at much healthier positions in terms of speculative traders then we were a month earlier as a 154,000 net long speculative contract position is around the average of what we saw during the 2009-2011 portion of the gold bull market.
Even more interestingly, the net Producer/Merchant stands now at a net short position of around 114,000 contracts - which is actually towards the low end of what we saw during the 2009-2011 gold market. That's a positive factor as it suggests producers and merchants, who know the ins and outs of the physical side of the gold market, are more bullish than they have been in the previous gold market - that is a big positive.
As for silver, the action week's action looked like the following:

Source: Sharelynx Gold Charts
The red line which represents the net speculative positions of money managers, saw a large decline on the week of around 18,000 net contracts - which is an extremely large proportion of total outstanding silver contracts as it represents close to 10% of outstanding contracts compared to gold's net drop which was about 6% of outstanding gold contracts. This shouldn't be too surprising because silver dropped from $18.74 to $17.48 during the COT week which closed on Tuesday October 11th. The speculative net silver position is still a bit high compared to historical terms, but we are at much better levels then we have seen previously. Also, since silver closely tracks gold and gold is at much healthier speculative levels, we wouldn't be surprised if a gold rebound would bring silver up with it.
A Look At ETF Holdings
Before we close this piece we wanted to take a look at total published gold holdings over the past year, and especially focus on the last month.
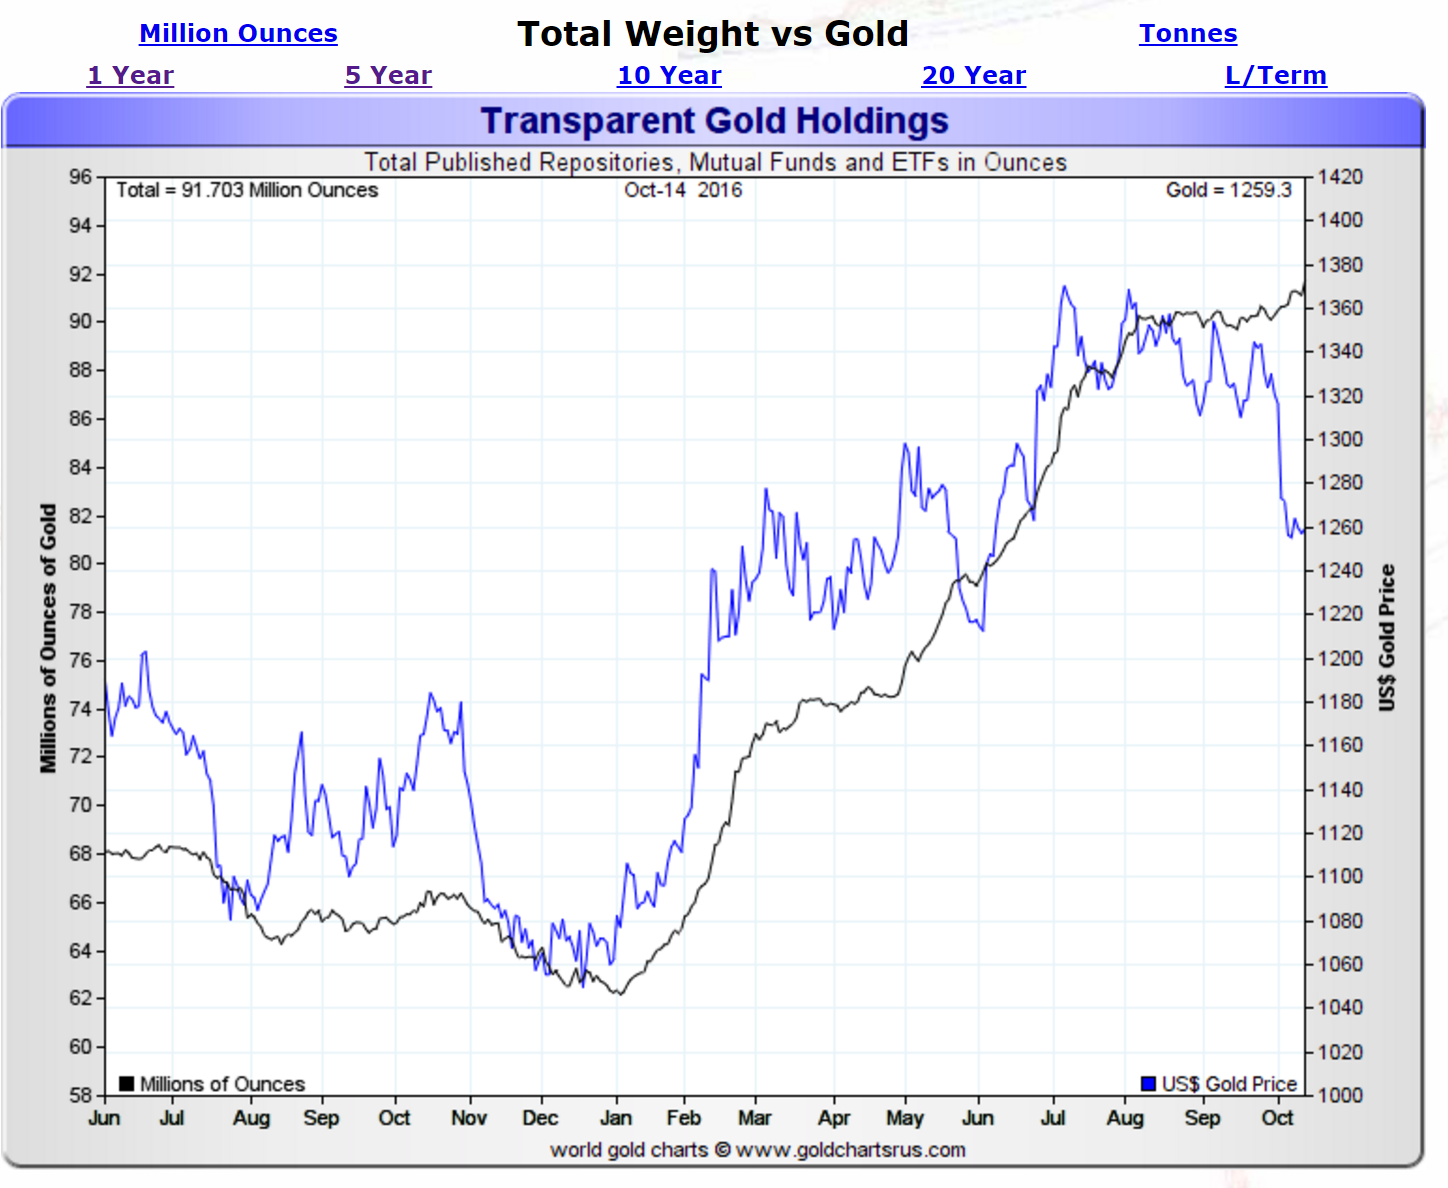
Source: Sharelynx Gold Charts
As investors can see above, despite the big drop in the gold price transparent investor gold holdings have actually increased over the past few weeks. In numeric terms, transparent gold holdings have increased by around 1.5 million ounces (around 1.7%) over the past four weeks despite the drop in the gold price.
Taking a look at the same chart over the past five years we see the following:

Source: Sharelynx Gold Charts
Investors can see that during the big price drop in gold from the middle of 2012 through 2015, the gold price dropped and investors holdings followed it down. It may be still a bit early, but we have not seen the same thing happen with this price drop as we have actually seen the opposite happen - transparent gold holdings have RISEN during the drop in the gold price.
What Does This Tell Us?
It tells us that the recent drop in gold was not due to ETF liquidation of gold holdings as holdings have not declined. Pairing that information with the information from the COT report, that speculative investors have massively cut gold positions by close to 50% from their highs in early July of around 287,000 net long contracts to the current positions of only 154,000 net long contracts, and this gives strong evidence that the gold drop was mainly due to speculators cutting back on their gold positions.
Conclusion For Gold Investors
While nobody can really know a bottom until after it happens, we think there is a high likelihood that the recent drop in gold has run its course. We know we are putting ourselves out there, but we come to that conclusion because we are only seeing speculators unload positions to levels which are much healthier and actually lower than we have seen in the previous gold bull market. Additionally, since we are not seeing any follow-through selling in transparent gold holdings, we think that many of these speculators may jump right back in to gold if the price doesn't continue to decline.
Finally, we just published another research piece on the physical side in terms of demand from India and China, and what we seem to be seeing is that premiums are rising in those Eastern gold markets for the first time since earlier in the year when gold was at much lower prices. This is a big positive as it would be a source of demand that we haven't seen in months, and would at least provide support to gold.
Thus we are going to put our necks out there and step out on that limb to say we think all the evidence points to a gold bottom here. For those investors that heeded our advice and sold over the past few months, we think now is the time to be buying back positions to previous portfolio levels in the gold ETFs such as the SPDR Gold Trust ETF (NYSEARCA:GLD), ETFS Physical Swiss Gold Trust ETF (NYSEARCA:SGOL), iShares Silver Trust (NYSEARCA:SLV) especially considering the important upcoming catalysts (the US presidential elections, the Italian Referendum, European banking shortfalls, etc.) that could benefit gold.
Source Link
share
share
share
share
share


