
Crude Oil, Gold And Crude Oil - General Stock Market Links
 share
share
 share
share
 share
share
 share
share
 share
share
Without a doubt the most important event of the recent month (or even the recent years) was unexpected OPEC's decision to limit its production to a range of 32.5-33.0 million barrels per day. The agreement reached in Algiers (which is expected to be implemented this year) improved oil investors' sentiment and pushed the price of crude oil above the barrier of $50. But is it enough to break above the Jun peak? Is it possible that the relationships between crude oil, gold and the general stock market give us more clues about future crude oil's moves?
Let's jump right into charts (chart courtesy of http://stockcharts.com) and find out.
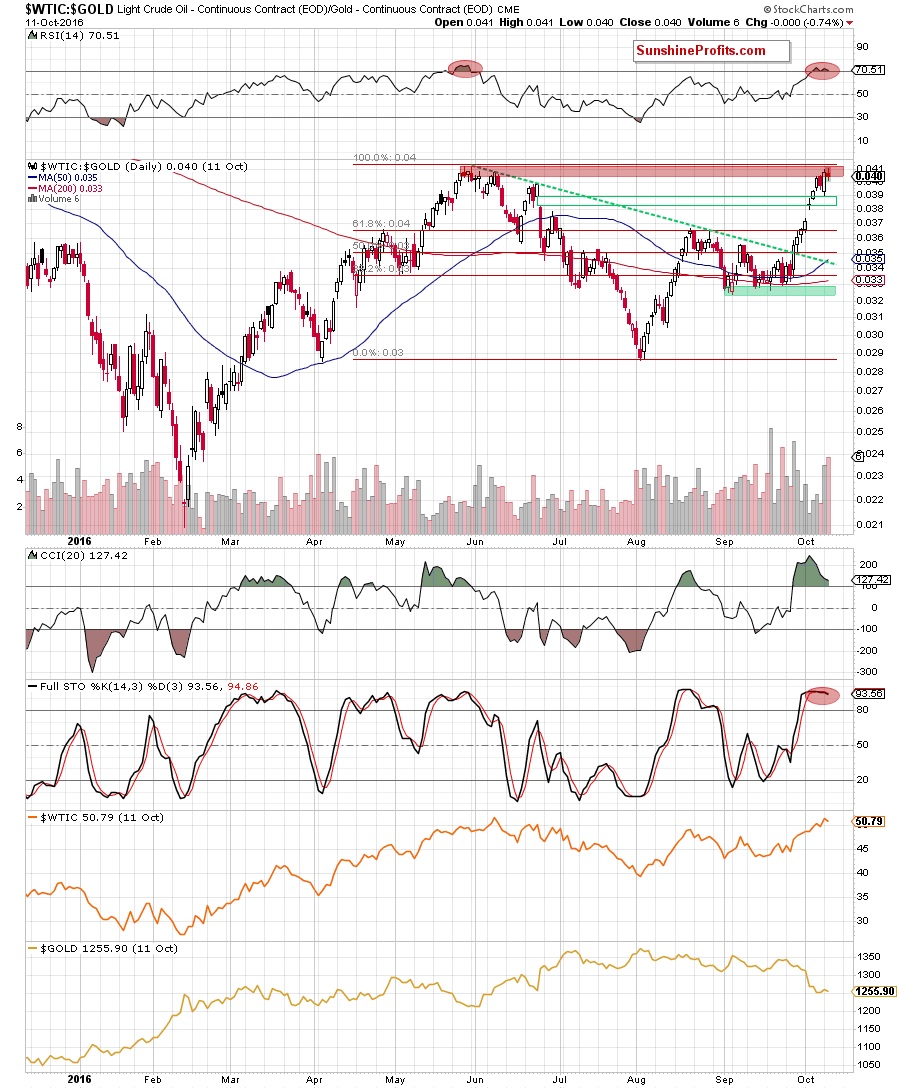
The daily chart indicates the ratio moved sharply higher in recent days, which resulted in a bullish gap in the previous week. This event triggered another upswing, which closed the bearish gap from Jun 24 and encouraged bulls to further action. Thanks to these circumstances, a rally developed, which approached the ratio to the red resistance zone based on May and June highs.
What can we expect in the coming days? Taking into account the proximity to this important resistance zone and the current position of the indicators (the RSI climbed above the level of 70, the CCI moved lower, creating a negative divergence between itself and the value of the ratio and the Stochastic Oscillator generated a sell signal), we think that reversal is just around the corner.
How did this move affect the medium-term picture?

The first thing that catches the eye on the weekly chart is a breakout above the neck line of a potential Inverted Head&Shoulders formation. Although this is a bullish signal, we should keep in mind that there was a similar price action in the previous week. Back then, bulls didn't manage to hold gained levels, which resulted in a pullback. Therefore, in our opinion, this week's breakout would be more reliable only if the ratio closes this Friday's session above 0.04.
Let's take a closer look at the relation between oil and the general stock market.
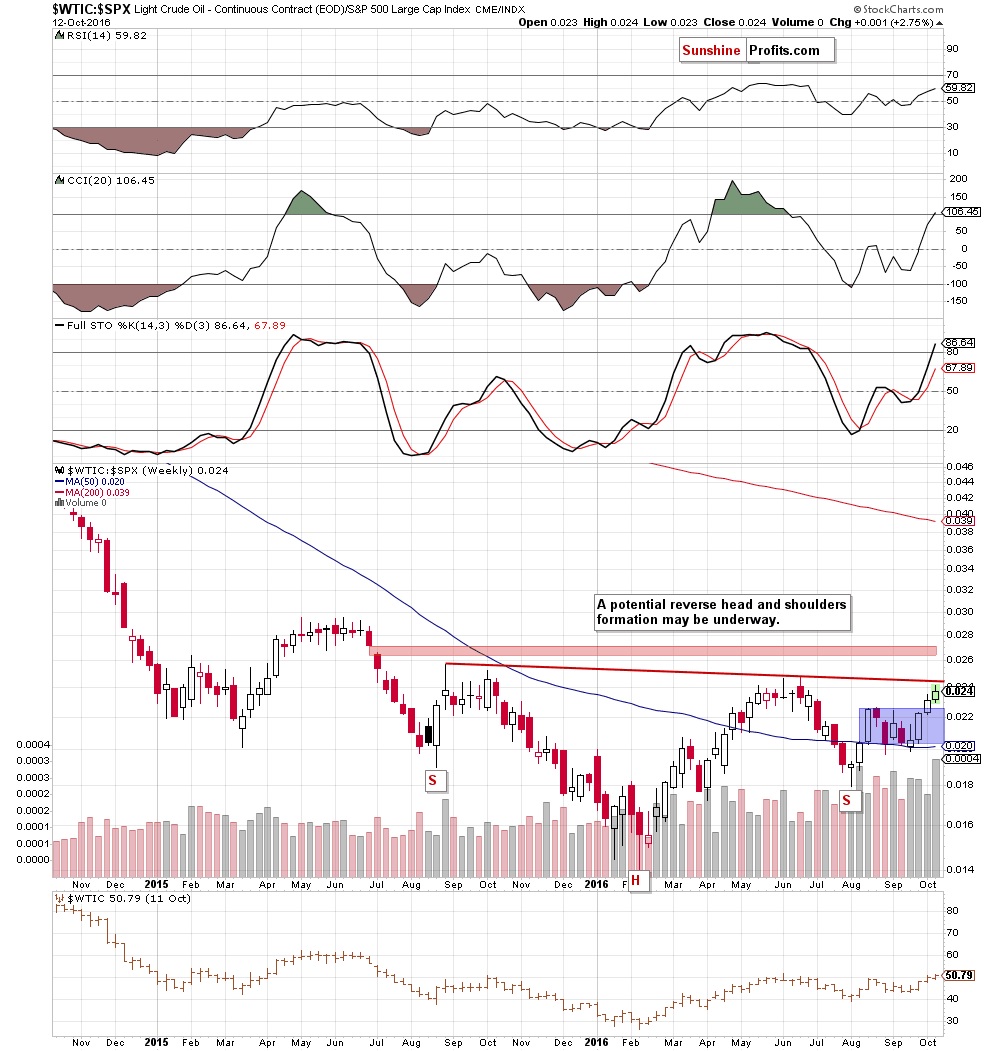
On the weekly chart, we see that although the ratio broke above the upper border of the blue consolidation, the red resistance line based on the Aug 2015 and Jun 2016 highs (a neck line of a potential reverse head and shoulders formation) continues to keep gains in check. Additionally, the ratio remains under the red resistance zone marked on the very short-term chart below.

From the daily perspective, we also see that (similarly to what we wrote in case of the oil-to-gold ratio) there are negative divergences between indicators and the ratio, which do not bode well further rally. On top of that, the Stochastic Oscillator generated a sell signal, which would become even more bearish if drops below the level of 80 in the coming days.
Summing up, the oil-to-gold and oil-to-stocks ratios extended gains in recent weeks, climbing to the key resistance zones, which suggest that reversals are just around the corner. Additionally, the current position of the daily indicators (negative divergences and sell signals generated by the Stochastic Oscillators) doesn't bode well for further rallies. What does it mean for crude oil? Taking into account the fact that strong positive correlation between both ratios and crude oil remain in play, we think that lower values of both ratios will translate into lower prices of light crude (similarly to what we saw many times in the past) in the coming days.
share
share
share
share
share
More from Gold-Eagle


