
Dow Set For Bullish 2016
 share
share
 share
share
 share
share
 share
share
 share
share
Ahhhh, the Ides of March. This is a time when stock market participants get the heebie-jeebies and it is my expectation that the first part of the month will play into this superstitious claptrap. However, once an expected higher low is in place, then a big move to the upside will be witnessed that sees March end impressively in the green.
The January analysis outlined the expectation of a move down to put in a higher low. Bingo. The February analysis outlined the expectation of another downside test that puts in another higher low. Bingo again. In this March analysis, I’m gunning for the jackpot prize in calling for one final downside test to put in yet another higher low before price launches higher big time.
Let’s begin the analysis with the daily chart to get an idea of how I believe price is set to trade.
DOW DAILY CHART

We can see an impulsive move up off the previous low at 15503. This has started to struggle somewhat in the latter stages and in the process looks to have formed a 5 point broadening top with the point 5 high now looking in place at 16795.
The Bollinger Bands show price toing and froing between the upper and lower bands and I believe price is now set to trade back down to the lower band.
The Fibonacci Fan shows the point 4 low at support from the 76.4% angle while the points 1, 2 and 5 highs all at resistance from the 61.8% angle.
I have added Fibonacci retracement levels of the move up from the January 2016 low to recent high. First corrections in a new bull trend often make deep retracements and that has certainly been the case so far this year. I am looking for one final downside test and I favour the next higher low to be somewhere between the 76.4% and 88.6% levels which stand at 15768 and 15603 respectively.
The RSI shows a little bearish divergence at the recent price high while the MACD indicator looks to be threatening a bearish crossover.
DOW WEEKLY CHART
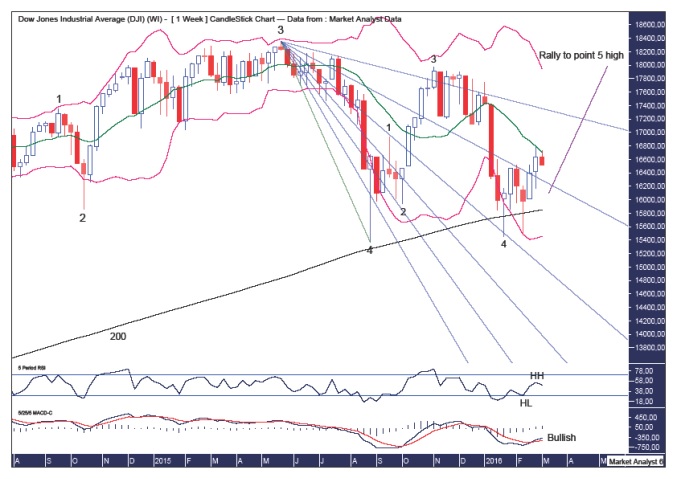
The numbers on the chart refer to two separate 5 point broadening tops. The larger formation shows the all time high being point 3 with the August 2015 low point 4. That means the move up to the final point 5 high is already underway, albeit in its infancy.
The smaller formation shows the first high after the August 2015 low being the point 1 high while price recently put in the point 4 low in January 2016. That means price is now on its way to a point 5 high in both formations. I suspect it will take until late 2016 or early 2017 to form the final point 5 high.
I have drawn a Fibonacci Fan from the all time high to August 2015 low. It shows price finding resistance around the 88.6% angle towards the end of 2015 while the 61.8% angle provided resistance at the point 1 high and support at the point 4 low of the smaller broadening top formation.
The Bollinger Bands show price right around the middle band and while price could zoom straight up to the upper band I personally favour a move back to the lower band one last time.
The black line denotes the 200 period moving average which looks to be providing solid support. There have already been three tests of this line and I favour one final test before price rockets to the upside.
The RSI now looks to be trending up with a higher low in place and price now making a higher high.
The MACD indicator has just made a bullish crossover.
Let’s move on to the monthly chart.
DOW MONTHLY CHART

I have drawn an Andrew’s Pitchfork including swing parallel lines. This shows the all time high right at resistance from the upper channel line while price is now finding resistance at a swing parallel line. After one last downside test I expect price to bust through this swing parallel line and head back up to the upper channel line with the final high likely to be a false break above that upper channel line.
The Fibonacci Fan shows the uptrend into the all time high found support at 61.8% angle. Price broke below this support angle in August 2015 which then became resistance. Price seems to be stabilising and I am looking for price to launch higher again for another assault at this 61.8% angle. I expect the final high to be around resistance from this angle perhaps even nudging slightly above.
The Bollinger Bands price repeatedly finding support at the lower ban albeit trading under before reversing back up. I am looking for one last test of this lower band before the uptrend really gets going.
I have added two moving averages - the 100 (red) and 200 (black). These are in bullish formation and if price were to break to new lows then one of these lines would become a potential downside target. I highly doubt this scenario but if I am wrong and price breaks the 2015 low of 15370 then this would become my Plan B. For now my Plan A looks to be sticking solid!
The RSI shows a higher high in place and now looking for a high low to form and then the next leg higher can really let loose.
The MACD indicator is still bearish but this should change in due course if my analysis is correct.
Let’s wrap things up by looking at the big picture using the quarterly chart.
DOW QUARTERLY CHART

We can see the massive 5 point broadening top in play with points 1 to 4 already in place. Many pundits also seem to think the point 5 high is now in place. Not me. I favour one last parabolic surge is still to come before the topping formation is complete.
The Bollinger Bands show price finding support at the middle band and I now favour one final surge back up to the upper band and most probably trading well above the band which is a common feature found at solid tops. The upper band currently stands just over 19000.
The Fibonacci Fan, drawn from the 2002 low to 2007 high, shows the all time high around resistance from the 38.2% angle with the subsequent move down finding support around the 50% angle. I now favour a move back up to around the 38.2% angle for the final high.
The RSI shows a triple bearish divergence forming at the 2015 high. This often leads to a significant move back down and that has certainly been the case. I now favour a resumption of the overall bull trend with the final high likely to set up a quadruple bearish divergence.
The MACD indicator is bearish but that may change should price launch higher from here.
Summing up, price has been trading as outlined at the start of the year and after one last downside test I expect price to put this tough period behind it and explode to record highs.
********
© 2014 Copyright The Voodoo Analyst - All Rights Reserved
Disclaimer: The above is a matter of opinion provided for general information purposes only and is not intended as investment advice. Information and analysis above are derived from sources and utilising methods believed to be reliable, but we cannot accept responsibility for any losses you may incur as a result of this analysis. Individuals should consult with their personal financial advisors. Put simply, it is JUST MY OPINION.
share
share
share
share
share


