
Dueling Forces, Part 2
 share
share
 share
share
 share
share
 share
share
 share
share
December Gold: $319.80
Critical underlying support: $317.50
Critical overhead resistance: $324-$326
In our last gold futures commentary we noted that the daily gold futures chart is a classic example of "dueling forces," or the conflict between the bulls and bears. We highlighted this beautiful parabolic bowl pattern plainly visible in the daily chart and asserted that "It's the kind of pattern that will literally make or break a market as it represents two powerful forces vying for control of the market with only one winner." Let's examine the updated daily gold futures chart (below), a remarkable study in market forces.
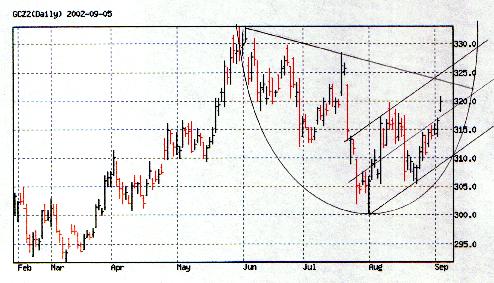
Note the parabolic bowl that has formed since the early June peak. When we last published this chart gold prices had just passed the mid-point, or "vertex," of the bowl after having bottomed smack-dab in the middle of the bowl at $300 (intra-day). This was a strongly bullish indication that prices would seek higher levels, at least in the short term. Since that time prices have crept higher despite great volatility and frantic whipsaws along the way. Wednesday-Thursday of this week (Sept. 2-6) was a case in point. After showing signs of waning volume and upside momentum, gold futures produced a surprise up-gap opening and closed near the top of its trading range on Thursday. This type of herky-jerky trading activity is typical of markets that must contend with heavy overhead supply.
Still, gold did rally and broke above the mid-point of a three-pronged upward trading channel (see above chart). Prices appear to be headed toward the next highest benchmark of $324-$326, an area of strong potential resistance. Not only is there a nearly 3 ½ month declining trend line that intersects this area in coming days but $325-$326 also represents the top of the three-pronged trading channel. Also, $324 approximates to the 75% retracement level of the June-August decline. The 75% retracement was a favorite of W.D. Gann since he found it to be an extremely common one in most actively traded commodities. Gold futures closed almost precisely at the Fibonacci 62% retracement on Thursday, so it this level (about $320) can be overcome it would only follow that the 75% retracement area would be the next logical benchmark.
Looking at the daily chart from another perspective, note the symmetrical triangle that prices recently broke out of. This has bullish implications and a follow-through to the 75% retracement level would suggest the full measuring implications of the triangle will be fulfilled. The triangle projects to a minimum of $330-$335, or even higher, depending on how the measurement is taken.

Volatility and whipsaws notwithstanding, the immediate trend in gold futures remains up until the rim of the parabolic bowl in the daily chart is broken. Crossing above $325-$326 would be very bullish and would lead to a test of the June highs. Piercing above the June highs, even if only marginally, would indicate that gold will seek higher levels in coming months (even if the new high is followed by a pullback and lengthy consolidation). For our tastes, we would feel justifiably bullish just to see gold cross above $326.
share
share
share
share
share
More from Gold-Eagle


