
Ewave Analysis Of Major Markets
 share
share
 share
share
 share
share
 share
share
 share
share
GOLD

Gold reached a low of 1150.10, in yesterday's day session before recovering to almost unchanged on the day.
Our best bullish count remains that a major low is in at 11462.20 and that we are starting higher in either wave -d- or wave -iii-.
However, until we break above the upper downtrend line of the wave .c. diagonal triangle that is connecting 1187.30 and 1174.40, it is still possible that we are going to revisit the 1146.20 low one more time.
Until this happens we can only assume that this wave .c. diagonal triangle is still NOT complete at the 1146.20 low.
If wave -c- or -ii- did end at 1146.20, then the bullish count we have is:
^i^ = 1163.70;
^ii^ = 1150.10, if complete;
^iii^ rally is next.
We note that gold now has a record spec short position, which we suggest is signaling that a major low is in the making!
No change to our current 5 long positions, with 1150 puts, but will add 5 long positions at 1165!
CRUDE OIL
Well, they got the Iranian deal, although whether it ever gets approved by the US Congress is another matter for another day.
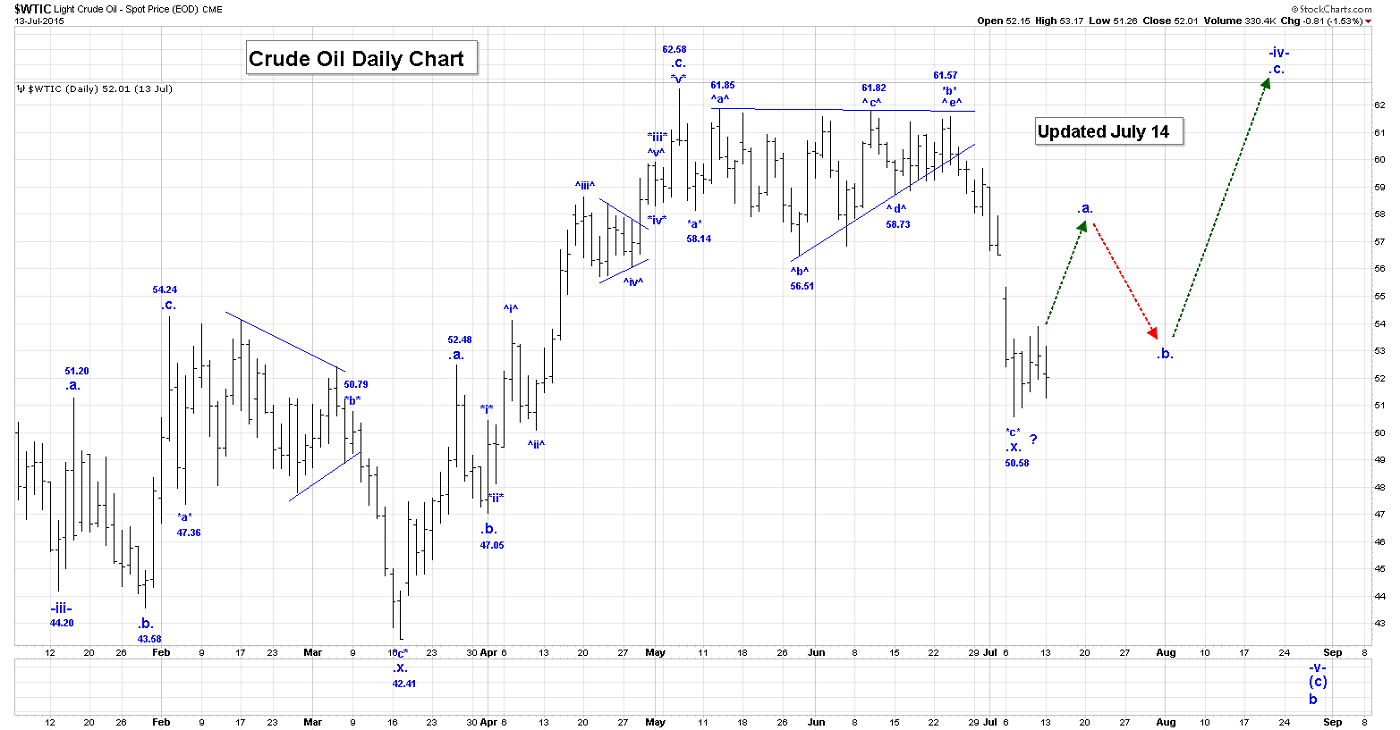
In the overnight session crude dropped to a low of 50.89, before moving higher, now trading above 52.00, at the time that this Post was being written. We see no reason to change to our current outlook, with our second wave .x. ending at 50.58.
We are likely now rallying in our third wave .a. We need a break above the 53.81 high to give us a little more confidence that the 50.58 low is really the end of our second wave .x.
The other option is that we are going to see one more dip below 50.58 to complete wave .x., before we move higher in our third .a., .b., .c. pattern.
From our wave -iii- low of 44.20, our current wave -iv- rally looks like:
.a. = 51.20;
.b. = 43.58;
.c. = 54.24;
.x. = 42.11;
.a. = 52.48;
.b. = 47.05
.c. = 62.58
.x.:
*a* = 58.14
*b* triangle = 61.57;
*c* = 50.58, if complete. Our *c*=2.618*a* projection is 49.95.
Our third .a. rally is now underway.
We are long 5 positions, with 50.00 puts!
S&P500

The attached 10 Min and 120 Min S&P Charts provide the details of our scenario.
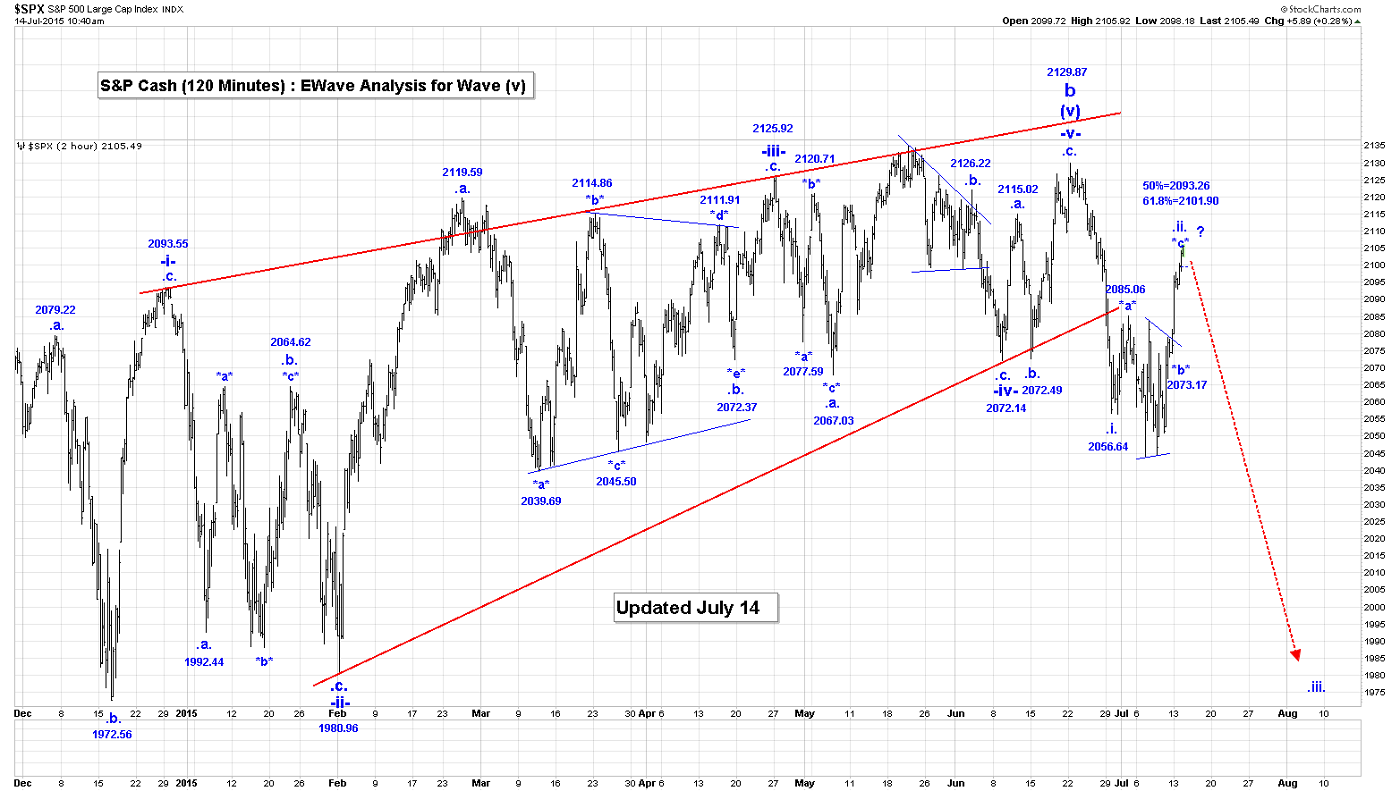
The bottom line:
All the elements are now in place for a completed wave .ii. as the S&P rallied sharply today is what we believe to be is all or most of wave .ii.
We reached a high yesterday 0f 2100.67, which is within our 50 to 61.8% retracement zone for wave .ii. We added to our short positions at 2097!
Our target zone for the end of wave *c* and all of wave *ii* remains as:
50% = 2093.26;
61.8% = 2101.90.
We cannot rule the possibility that this wave -v- ending diagonal triangle is simply extending and that the S&P will make all time new highs in the months ahead. For the time being this will be our alternate. A break of 1980.96, would eliminate this possibility.
We expect the S&P to now turn sharply lower in wave .ii. as we suspect that the Greek Communists will not approve the Euro “deal”.
We are short 3 positions at 2115, and 5 at 2070, 3 at 2097, risking all to 2130!
USDX
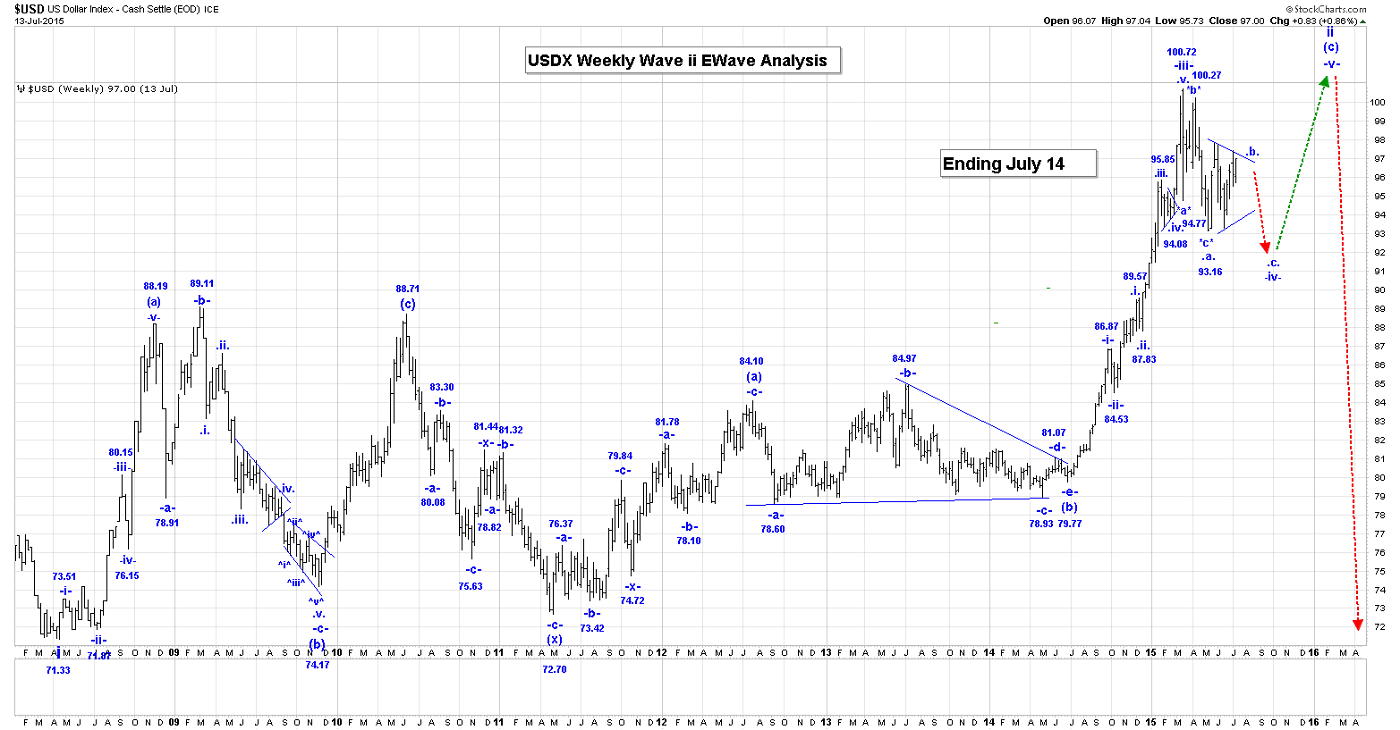
The USDX reached 97.20 in the overnight session, before turning lower. We would expect that if our current analysis is correct, and wave *c* of our wave .b. triangle ended at 97.44, then we need to turn lower now.
Otherwise it might be possible that our wave .b. triangle is expanding and wave *c* is not complete at the 97.44 high.
Our current count within wave -iv- is as follows:
.a.:
*a* = 94.88;
*b* = 100.27;
*c* = 93.16, to complete all of wave *a*;
.b. triangle:
*a* = 98.00;
*b* = 93.30;
*c* = 97.44, if complete:.
*d* drop is now;
*e* to go to complete all of the wave *b* triangle.
.c. drop to go, to least the wave .a. low of 93.16, to complete all of wave -iv-
Wave *d* cannot drop below the wave ^b^ high of 93.30, for this triangle formation to remain valid.
NATGAS
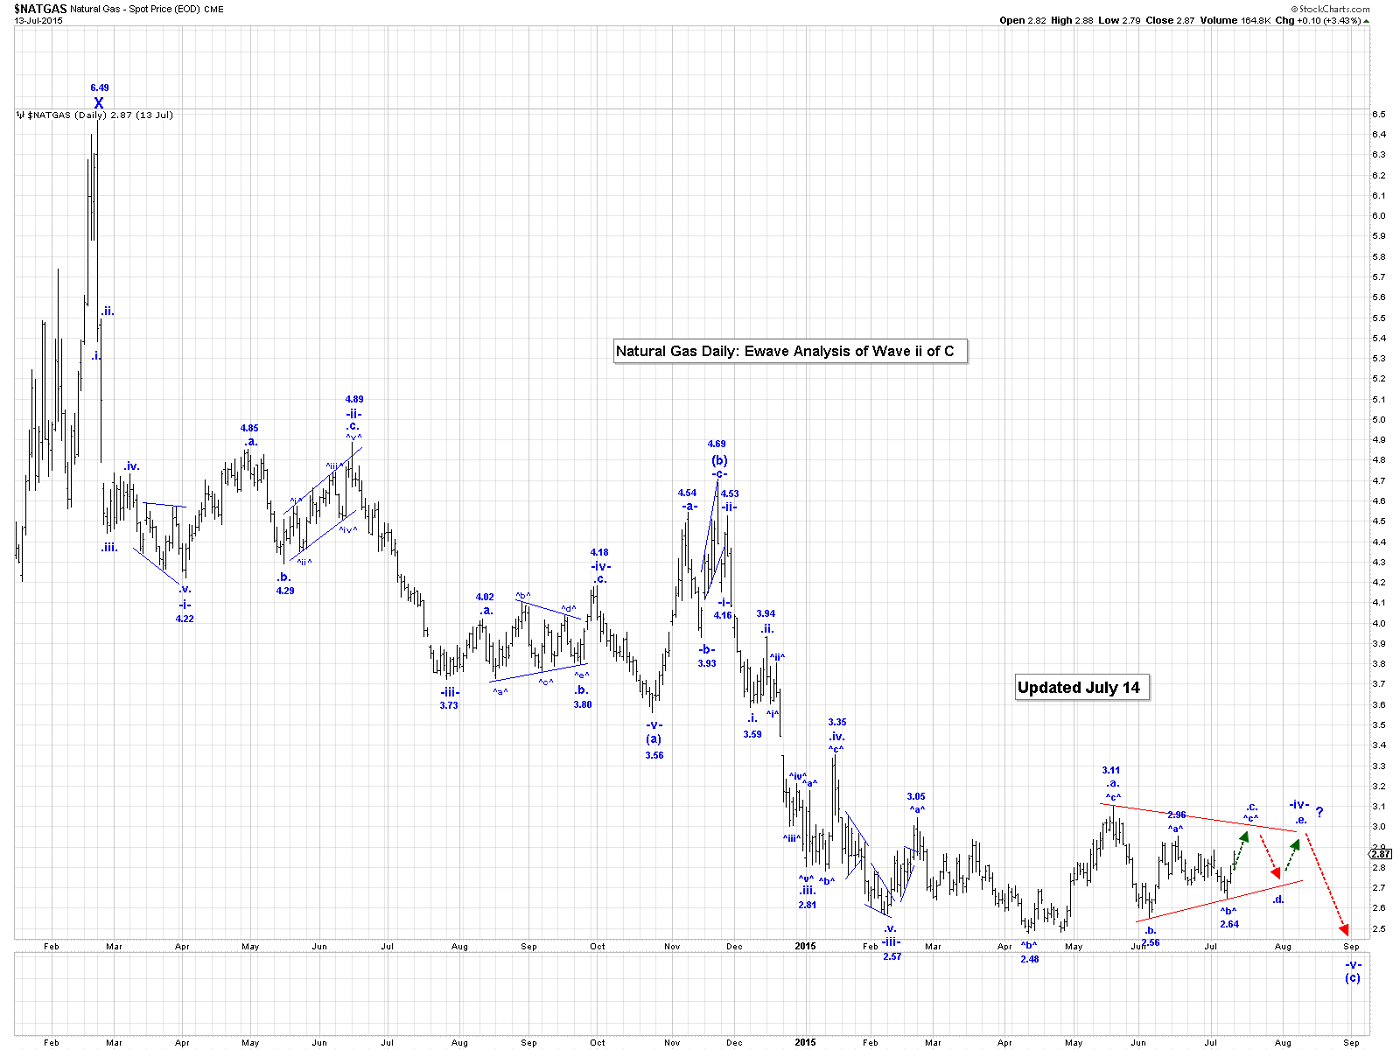
NG moved a little higher in the overnight session, reaching 2.89, at the time that this Post was being written.
Our minimum target for end of this current rally is the wave ^a^ high of 2.96, but we do have a projection that suggests a run to the 3.04 level, before all of wave .c. ends.
Our current wave -iv- triangle count looks like:
.a.= 3.11;
.b. = 2.56;
.c.:
^a^ = 2.96;
^b^ = 2.64;
^c^ rally is now to at least the wave ^a^ high of 2.96. A projections for ^c^ is: ^c^ = ^a^ = 3.04.
.d. and .e. to go to complete all of this wave -iv- triangle.
HUI/GDX
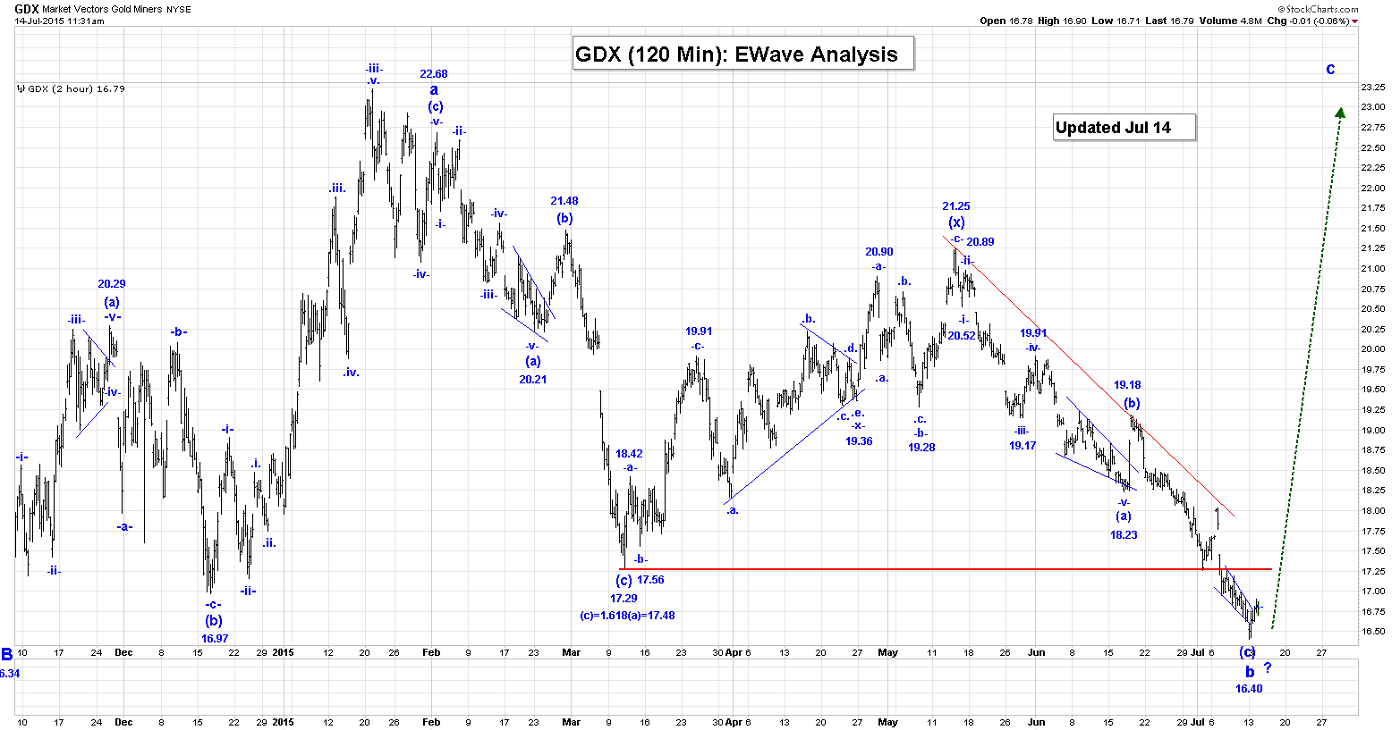
The GDX has continued to drift lower, reaching one marginal low after another. The final bottom in wave b is likely near!
We are very long the GDX, risking to 16.00!
********
Special Offer For Ewave Riders: We are doing a special free post this week-end on gold stocks. Send us an email to [email protected] and we’ll send you the report, which includes key Ewave analysis of stocks like Kinross and Claude Resources, as well as the HUI index!
Email: [email protected]
Website: www.captainewave.com
Risk: CAPTAINEWAVE.COM IS AN IMPERSONAL ADVISORY SERVICE. AND THEREFORE, NO CONSIDERATION CAN OR IS MADE TOWARD YOUR FINANCIAL CIRCUMSTANCES. ALL MATERIAL PRESENTED WITHIN CAPTAINEWAVE.COM IS NOT TO BE REGARDED AS INVESTMENT ADVICE, BUT FOR GENERAL INFORMATIONAL PURPOSES ONLY. TRADING STOCKS DOES INVOLVE RISK, SO CAUTION MUST ALWAYS BE UTILIZED. WE CANNOT GUARANTEE PROFITS OR FREEDOM FROM LOSS. YOU ASSUME THE ENTIRE COST AND RISK OF ANY TRADING YOU CHOOSE TO UNDERTAKE. YOU ALSO AGREE TO BEAR COMPLETE RESPONSIBILITY FOR YOUR INVESTMENT RESEARCH AND DECISIONS AND ACKNOWLEDGE THAT CAPTAINEWAVE.COM HAS NOT AND WILL NOT MAKE ANY SPECIFIC RECOMMENDATIONS OR GIVE ADVICE TO YOU OR ANY OF ITS CLIENTS UPON WHICH THEY SHOULD RELY. CAPTAINEWAVE.COM SUGGESTS THAT THE CLIENT/MEMBER TEST ALL INFORMATION AND TRADING METHODOLOGIES PROVIDED AT OUR SITE THROUGH PAPER TRADING OR SOME OTHER FORM OF TESTING. CAPTAINEWAVE.COM, ITS OWNERS, OR ITS REPRESENTATIVES ARE NOT REGISTERED AS SECURITIES BROKER-DEALERS OR INVESTMENT ADVISORS EITHER WITH THE U.S. SECURITIES AND EXCHANGE COMMISSION OR WITH ANY STATE SECURITIES REGULATORY AUTHORITY. WE RECOMMEND CONSULTING WITH A REGISTERED INVESTMENT ADVISOR, BROKER-DEALER, AND/OR FINANCIAL ADVISOR. IF YOU CHOOSE TO INVEST WITH OR WITHOUT SEEKING ADVICE FROM SUCH AN ADVISOR OR ENTITY, THEN ANY CONSEQUENCES RESULTING FROM YOUR INVESTMENTS ARE YOUR SOLE RESPONSIBILITY.
ALL INFORMATION POSTED IS BELIEVED TO COME FROM RELIABLE SOURCES. CAPTAINEWAVE.COM DOES NOT WARRANT THE ACCURACY, CORRECTNESS, OR COMPLETENESS OF INFORMATION AVAILABLE FROM ITS SERVICE AND THEREFORE WILL NOT BE LIABLE FOR ANY LOSS INCURRED. DUE TO THE ELECTRONIC NATURE OF THE INTERNET, THE CAPTAINEWAVE.COM WEBSITE, ITS E-MAIL & DISTRIBUTION SERVICES AND ANY OTHER SUCH "ALERTS" COULD FAIL AT ANY GIVEN TIME. CAPTAINEWAVE.COM WILL NOT BE RESPONSIBLE FOR UNAVAILABILITY OF USE OF ITS WEBSITE, NOR UNDELIVERED E-MAILS, OR "ALERTS" DUE TO INTERNET BANDWIDTH PROBLEMS, EQUIPMENT FAILURE, OR ACTS OF GOD. CAPTAINEWAVE.COM DOES NOT WARRANT THAT THE TRANSMISSION OF E-MAILS, OR ANY "ALERT" WILL BE UNINTERRUPTED OR ERROR-FREE. CAPTAINEWAVE.COM WILL NOT BE LIABLE FOR THE ACTS OR OMISSIONS OF ANY THIRD PARTY WITH REGARDS TO CAPTAINEWAVE.COM DELAY OR NON-DELIVERY OF THE CAPTAINEWAVE.COM NIGHTLY EMAILS OR "ALERTS". FURTHER, WE DO NOT RECEIVE ANY FORM OF PAYMENT OR OTHER COMPENSATION FOR PUBLISHING INFORMATION, NEWS, RESEARCH OR ANY OTHER MATERIAL CONCERNING ANY SECURITIES ON OUR SITE OR PUBLISH ANY INFORMATION ON OUR SITE THAT IS INTENDED TO AFFECT OR INFLUENCE THE VALUE OF SECURITIES.
THERE IS NO GUARANTEE PAST PERFORMANCE WILL BE INDICATIVE OF FUTURE RESULTS. NO ASSURANCE CAN BE GIVEN THAT THE RECOMMENDATIONS OF CAPTAINEWAVE.COM WILL BE PROFITABLE OR WILL NOT BE SUBJECT TO LOSSES. ALL CLIENTS SHOULD UNDERSTAND THAT THE RESULTS OF A PARTICULAR PERIOD WILL NOT NECESSARILY BE INDICATIVE OF RESULTS IN FUTURE PERIODS. THE RESULTS LISTED AT THIS WEBSITE ARE BASED ON HYPOTHETICAL TRADES. PLAINLY SPEAKING, THESE TRADES WERE NOT ACTUALLY EXECUTED. HYPOTHETICAL OR SIMULATED PERFORMANCE RESULTS HAVE CERTAIN INHERENT LIMITATIONS. UNLIKE AN ACTUAL PERFORMANCE RECORD, SIMULATED TRADES DO NOT REPRESENT ACTUAL TRADING. ALSO, SINCE THE TRADES HAVE NOT ACTUALLY BEEN EXECUTED, THE RESULTS MAY HAVE OVER OR UNDER COMPENSATED FOR THE IMPACT, IF ANY, OF CERTAIN MARKET FACTORS SUCH AS LACK OF LIQUIDITY. YOU MAY HAVE DONE BETTER OR WORSE THAN THE RESULTS PORTRAYED. NO REPRESENTATION IS BEING MADE THAT ANY ACCOUNT WILL OR IS LIKELY TO ACHIEVE PROFITS OR LOSSES SIMILAR TO THOSE SHOWN. NO INDEPENDENT PARTY HAS AUDITED THE HYPOTHETICAL PERFORMANCE CONTAINED AT THIS WEBSITE, NOR HAS ANY INDEPENDENT PARTY UNDERTAKEN TO CONFIRM THAT THEY REFLECT THE TRADING METHOD UNDER THE ASSUMPTIONS OR CONDITIONS SPECIFIED HEREAFTER. WHILE THE RESULTS PRESENTED AT THIS WEBSITE ARE BASED UPON CERTAIN ASSUMPTIONS BELIEVED TO REFLECT ACTUAL TRADING CONDITIONS, THESE ASSUMPTIONS MAY NOT INCLUDE ALL VARIABLES THAT WILL AFFECT, OR HAVE IN THE PAST AFFECTED, THE EXECUTION OF TRADES INDICATED BY CAPTAINEWAVE.COM. THE HYPOTHETICAL RESULTS ON THIS WEBSITE ARE BASED ON THE ASSUMPTION THAT THE CLIENT BUY AND SELLS THE POSITIONS AT THE OPEN PRICE OF THE STOCK. THE SIMULATION ASSUMES PURCHASE AND SALE PRICES BELIEVED TO BE ATTAINABLE. IN ACTUAL TRADING, PRICES RECEIVED MAY OR MAY NOT BE THE SAME AS THE ASSUMED ORDER PRICES.
share
share
share
share
share


