
Gold Getting Stale? – Charts And COTs
 share
share
 share
share
 share
share
 share
share
 share
share
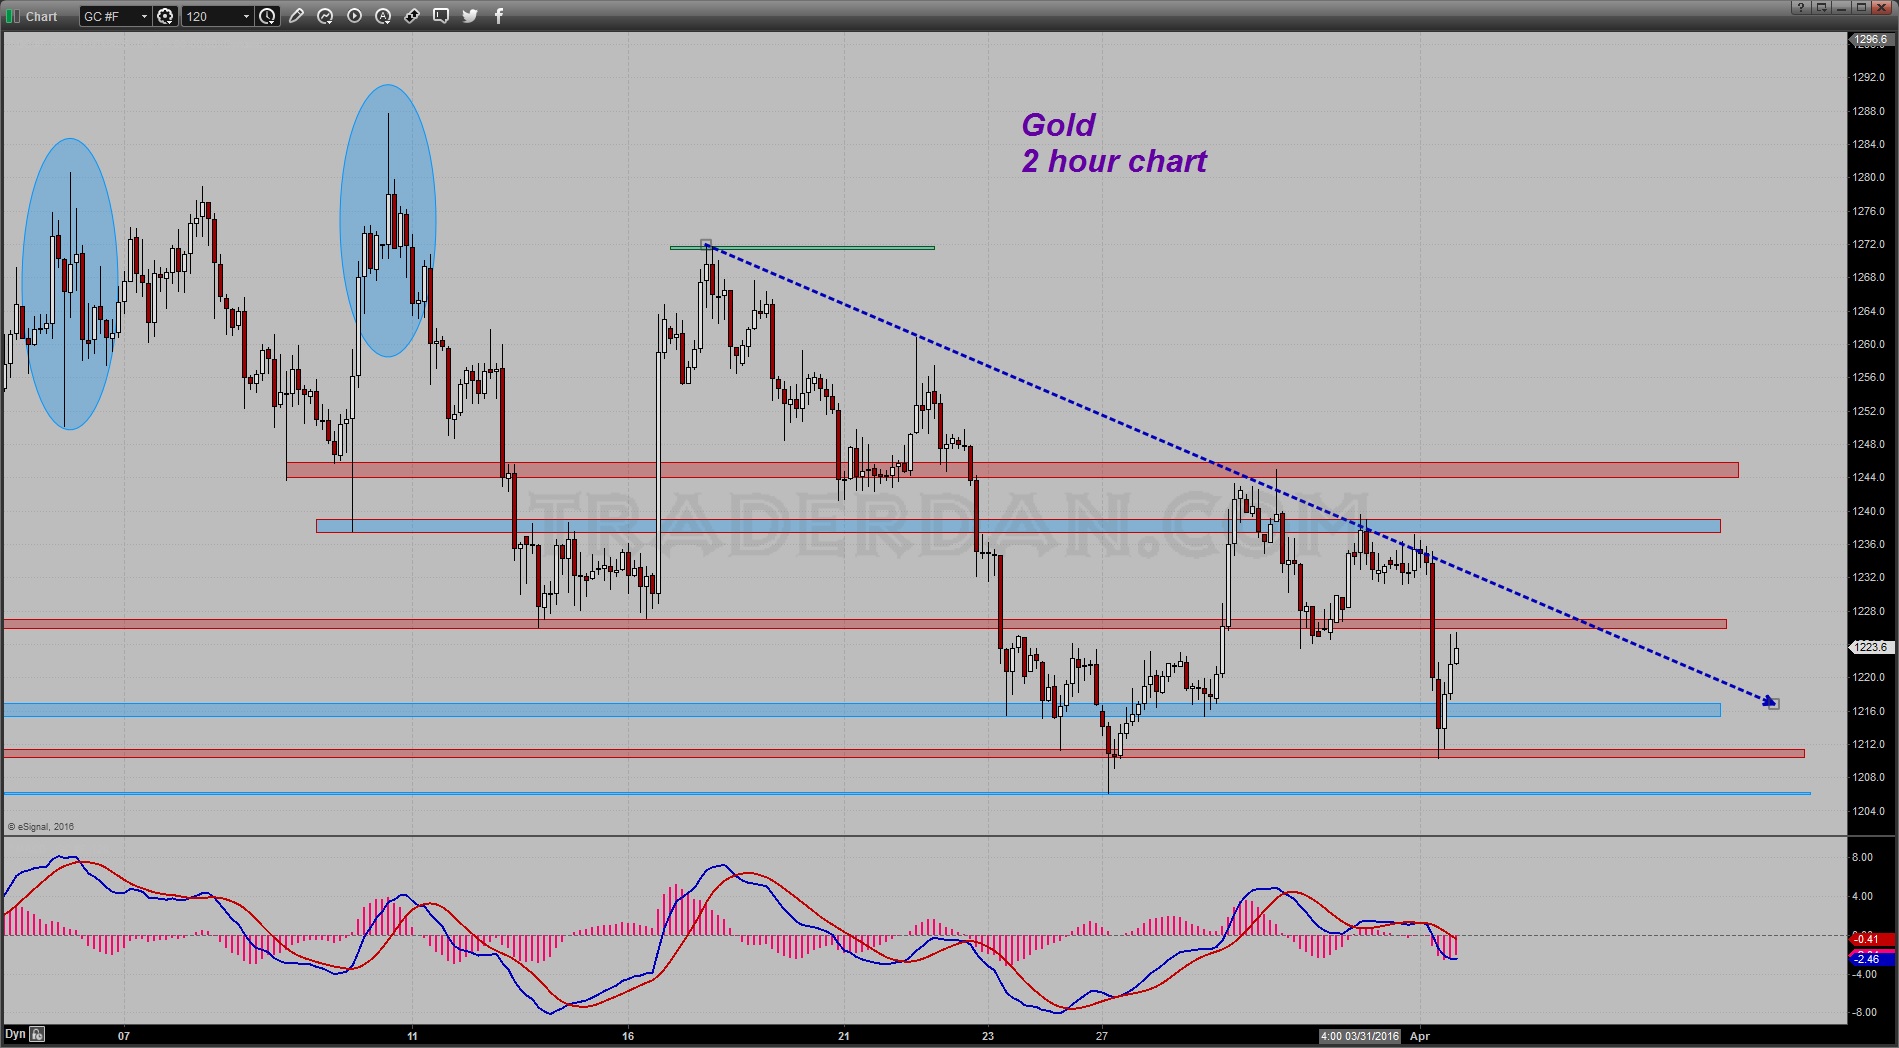
Notice on the very short-term chart (basis 2 hours), gold has been in a steady decline since the middle of last month with rallies attracting selling at the key resistance levels noted on the chart.
Price is currently holding below $1212 – $1210.
Initial resistance begins near $1225 and extends higher towards $1228. Above that lies $1237-$1240.
Watch out if that low near $1205 were to give way. There still remain a large number of spec longs in this market.
On a percentage basis, this is the largest combined large spec long position going back past 2011.

It should be noted that back in August 2011, gold peaked above $1900 with the large spec long position actually at 39.1% compared to this week’s 40.3%. Also, this week’s combined large spec long position on a percentage basis exceeded that of January 2015, which was at 40.0%. In other words, this trade remains very, very crowded.
Here is a chart showing the hedge fund only positioning compared to the gold price. Notice that the number of outright longs in this camp exceeded the January 2015 peak.
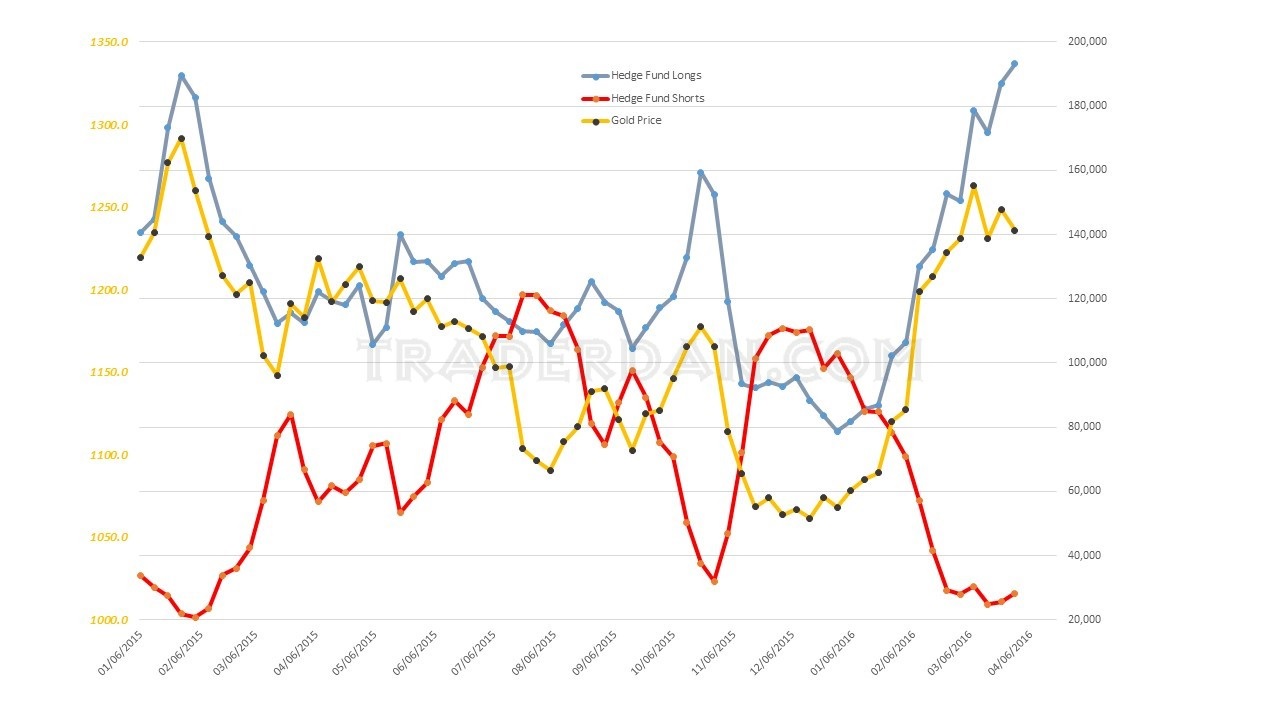
Here is the hedge fund NET LONG POSITION.
As you can see in this format, it remains below both the January 2015 peak -- and is certainly much lower than it was back in 2011 when gold was above $1900. Viewed in this form, it does not look quite so intimidating.

Next is the Commercials/Swap Dealers NET positioning.
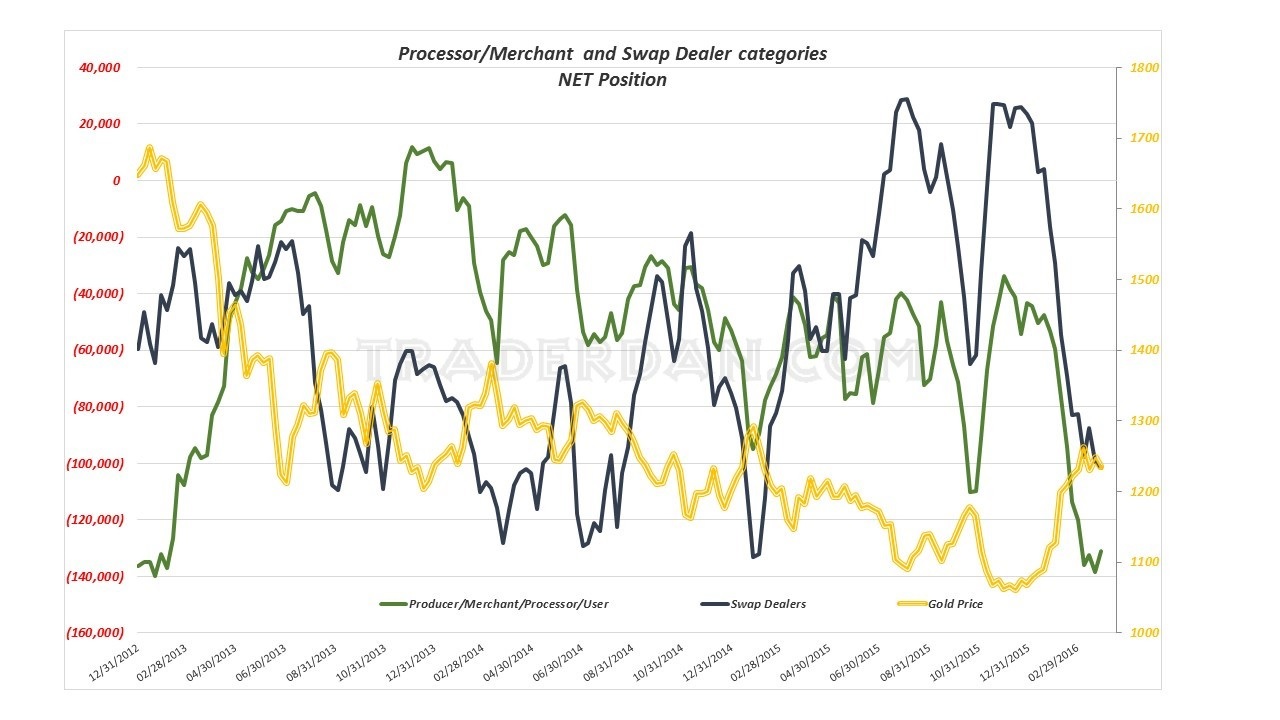
It remains significantly heavy.
Lastly, here is the standard format that we typically view.
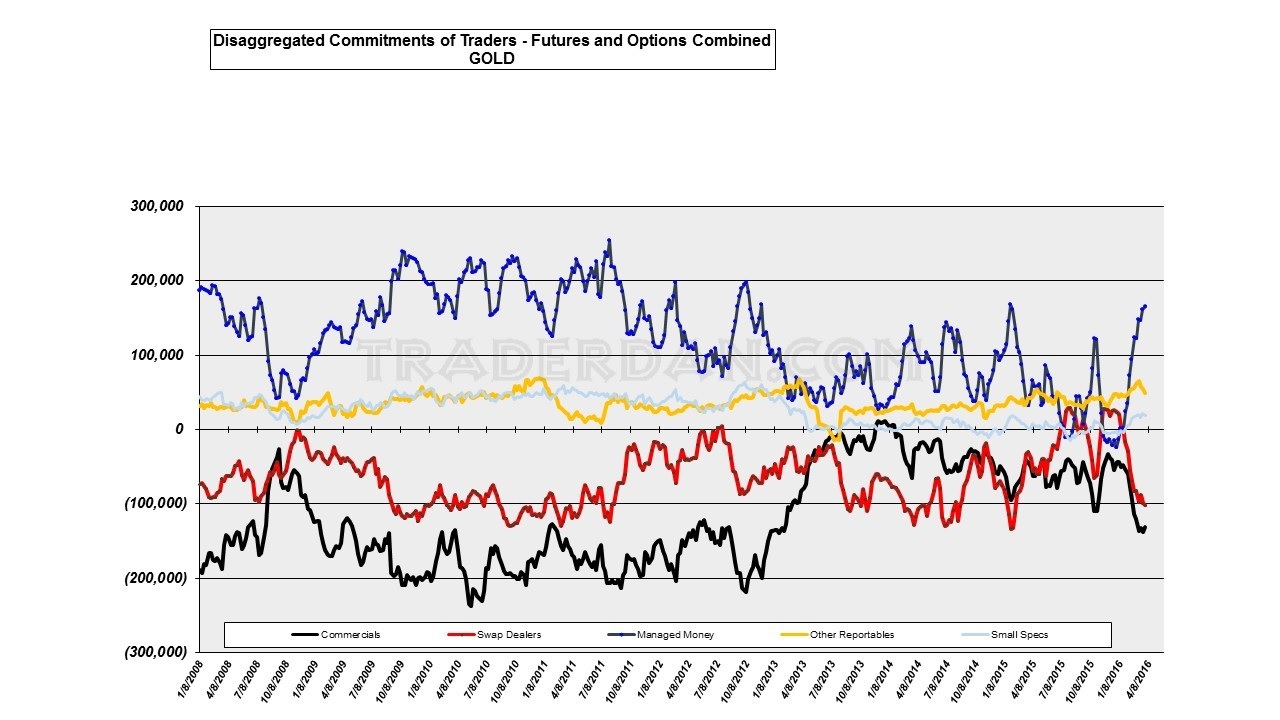
So where to things stand now for gold? Answer: Specs remain in a very bullish posture with commercials/swap dealers remaining strongly bearish.
The key for this spec position, which remains heavy, is whether or not downside chart support levels will hold if those are tested.
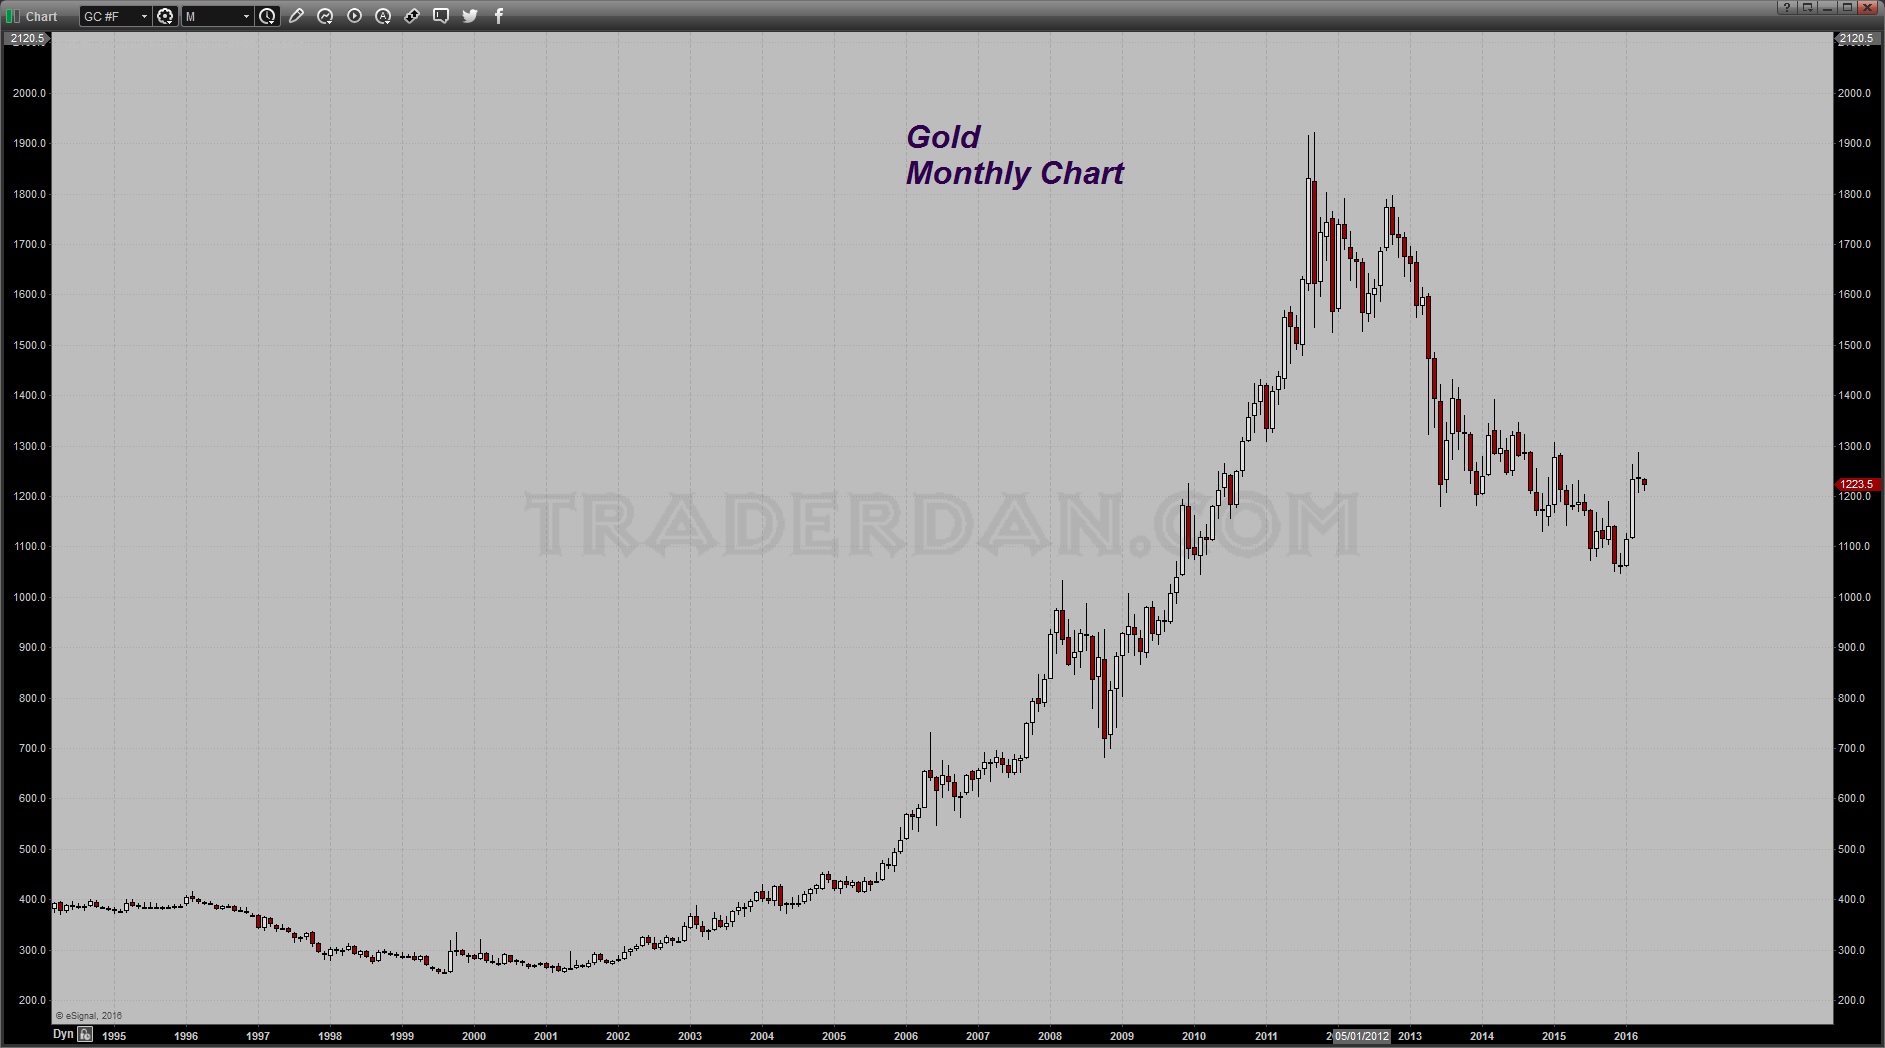
In going back to the Daily chart, I am struck by the fact that gold remains stuck beneath the median line of the Bollinger Bands. That in itself is negative. One indicator is already in a sell mode; the DMI lines are very close to generating a negative or a sell signal as well.
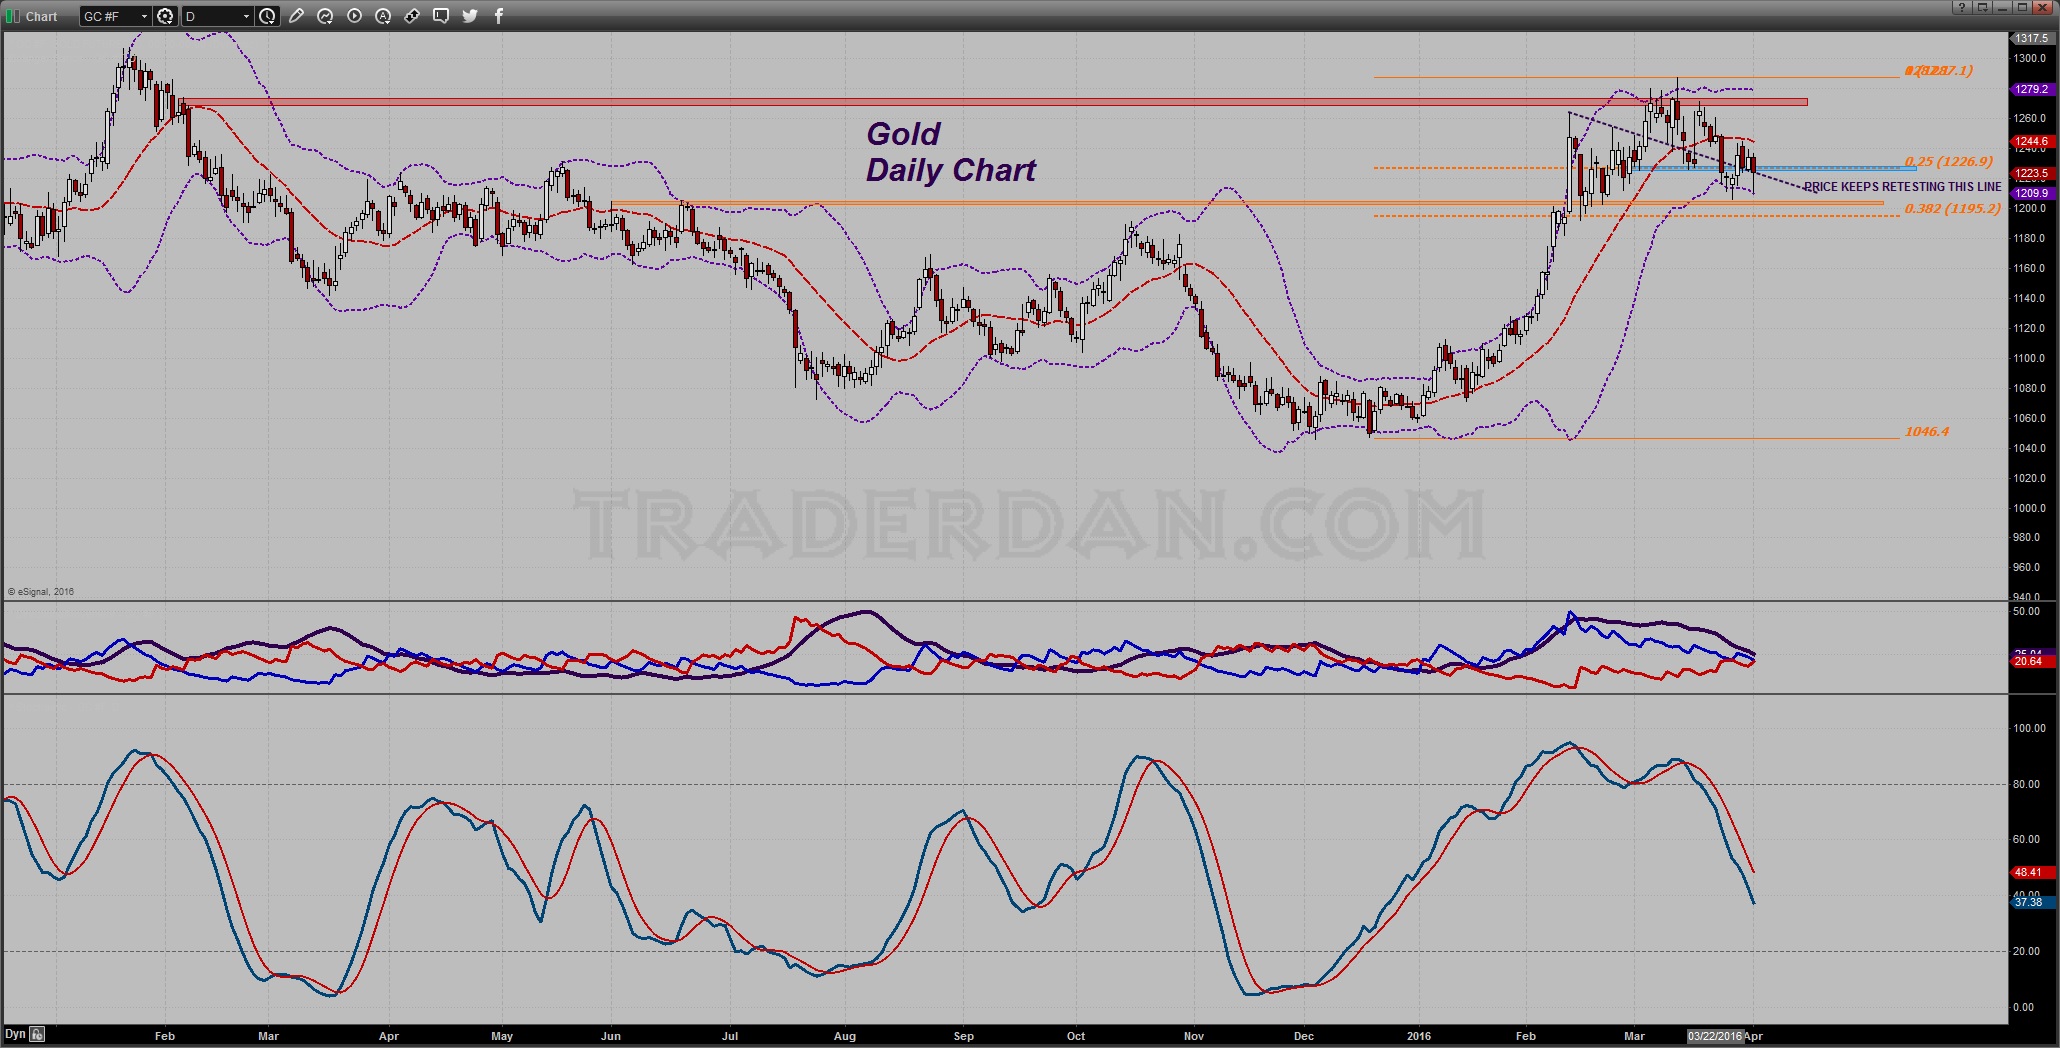
In view of the heavily lopsided large spec long position, and with an increasingly negative chart pattern forming, if $1205 were to be tested and failed to hold, we will see a significant amount of selling hit this market.
I do not know whether $1205 will be tested; I can only say what will happen if it is tested and fails. I could easily envision enough selling to drive the price back down to the February spike low near $1190. If that were to go, Katie bar the door.
On the upside, for the bulls to turn the current negative posture of the chart positive, they would need to start by pushing price back above that median line of the Bollinger Bands, which comes in near $1245. It certainly is not helping their cause with the gold ETF (GLD) losing gold.
GLD shed another ton of gold yesterday. Moreover, it lost about 5.6 tons of gold the past week. That is going in the wrong direction if you want to be a bull.

The HUI is not very insightful as it is moving sideways between support and resistance. Its current technical posture remains mixed.

The HUI/Gold ratio continues to hold up well – that is constructive but it should be noted that it is not rising to fresh highs.

In my view, the problem for gold is that you have a large number of STALE LONG positions in this market. With traders these days having the attention span of a gnat, there is the risk of impatient longs beginning to throw in the towel. That would precipitate the selling avalanche that is possible when a market becomes this lopsidedly crowded on the long side. Again, at the risk of repeating myself…as long as key downside support levels do not fail, this speculative position will be okay. If they do fail, all bets are off.
Bulls are going to need some fresh ammunition from somewhere soon. WE can only get so much traction out of Dr. Yellen being a super dove for so long. The market will shift, as it always does, into “WHAT ARE YOU GOING TO DO FOR ME NEXT”. Yellen being a super dove is now old news. Negative interest rates in Europe is now old news. Furthermore, Fed rate hikes being off the table for a while is old news. Bull markets need to be fed every day to keep going. That is what is lacking right now. I am convinced that is why we are not seeing fresh inflows into GLD.
Something new needs to come along soon.
********
Courtesy of Trader Dan http://traderdan.com/
share
share
share
share
share


