
Gold Just Sits As The World Flies By
 share
share
 share
share
 share
share
 share
share
 share
share

Per the above Scoreboard, Gold year-to-date clearly is tracking with the least degree of comparative alacrity to the prior three years, the price plot plodding along with a wee downside bias as if 'twere all quiet on the financial front.
Never mind that the folks at the Federal Open Market Committee have shifted their bias from tightening to neutral; nor the turbulent uncertainty being tossed about in TariffTalk; nor that the price of Oil from 66.60 on 23 April traded down to 57.33 this past Thursday for a five-week dive of -13.9%, even in the renewing face of feared militaristics 'round the Persian Gulf; nor that the S&P 500 forever is trading at double its earnings support; nor even that Gold's typical allies -- the Bond market and Swiss Franc -- have been our best performers month-over-month. Nope. Gold is merely content to continue its sitting upon the upper rung of The Box (1280-1240) watching the world fly by. Stretch, yawn, perhaps another nap, and that's that.
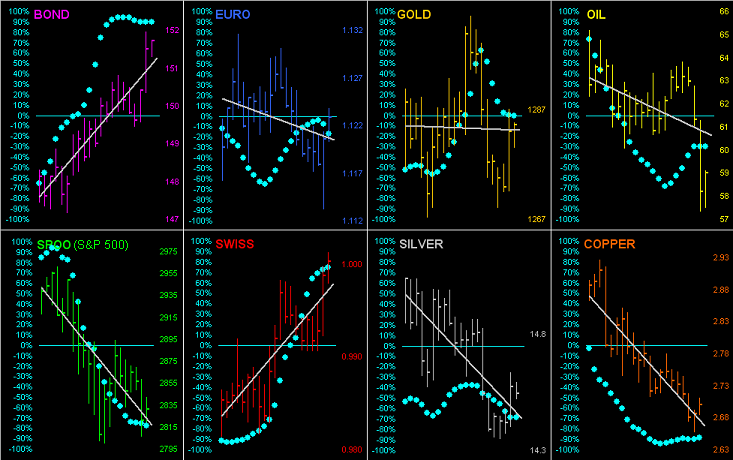
Graphically, here we've the percentage tracks of the five primary BEGOS Markets from six weeks ago-to-date. Obviously Gold has been both the least volatile and least changed of the bunch. A "has been" indeed:

"And bitcoin has more than doubled so far this year, mmb..."
Really, Squire, must we soil the time-honoured legacy of Gold and these dedicated discussions thereto with such talk of crypt-tripe? At present, so-called bits**t in settling the week at 8140 is -59% from its high trade of 20030 on 18 December 2017. 'Course to be fair, Silver's settle for the week at 14.55 is -71% from its 25 April 2011 all-time high of 49.82. But at least Silver is real tangible money, as is Gold which finished its week yesterday (Friday) at 1284, albeit -33% from its own All-Time High (which by now you regular readers know by rote) of 1923 on 06 September 2011. And again per the Scoreboard, Gold is trading at less than half its Dollar debasement value.
Such is Gold's state in "The Now" which these days amounts to nothing more than price's persistently criss-crossing The Box's upper purple boundary at 1280 as we next see in the weekly bars chart from a year ago-to-date. The parabolic Short trend, now 13 weeks in duration per the descending red dots, is sufficiently squeezing down on what is stubbornly resilient price such that the trend could well flip to Long within just a week's time simply through normal trading oscillation: the distance from present price (1284) to parabolic (1306) is 22 points; Gold's "expected weekly trading range" is at present 23 points. Moreover: throughout this current Short trend in regularly noting that Gold itself has not had much actual downside, the prior three Short trends of at least 13 weeks or more at their 13th week mark found price's change from high-to-low respectively -12.4% (Nov '14), -16.0% (Dec '16), and -8.7% (Jul '18). This time through 13 weeks? Just -5.1%. Here's the graphic:
Further, all this criss-crossing at the 1280 level is quite the tug-of-war given that trading volume is fairly robust. For this month of May, despite price having not really gone anywhere, contract volume is on pace to reach the 6,000,000 level, a monthly amount not recorded since last October. Love that liquidity!
As for the Economic Barometer, 'twas one of its quietest weeks for input that we've had in recent memory, with just four metrics coming into the mix, including declines for April's New and Existing Home Sales as well as for Durable Orders. However, incoming data releases increase twofold to eight metrics due in the new week. Thus with those still in the balance as we wind toward May's end, here's the sleepy Baro, with this subtle reminder: throughout the 22 years we've been charting this (and as is clearly evident in the current graphic), 'tis the red line that ultimately moves to the level of the blue line, not vice-versa:
Now to accentuate how much Gold is on the fence these days, let's go 'round the horn for all eight of the BEGOS Markets. Here we've the bars for their respective past 21 trading days (one month), highlighted by their "Baby Blues" denoting trend consistency. And note that the only two grey trendlines in ascent are for both the aforementioned Bond and Swiss Franc. Given that -- for those two stalwart safe haven components -- Gold's trendline ought also be up, non? Non! Incredible:
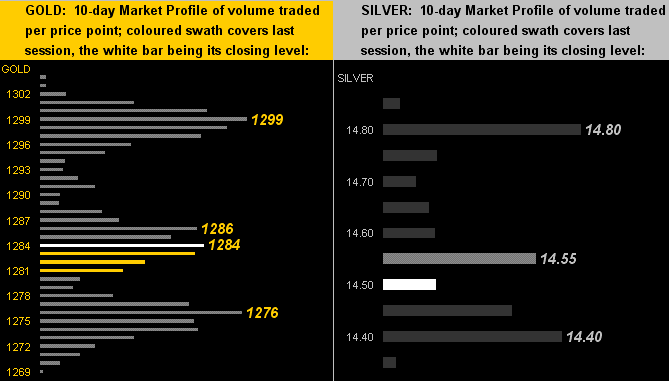
Next, drilling down into just the past fortnight we've the precious metals' 10-day Market Profiles for Gold on the left and Silver on the right. The yellow metal has managed its way back toward its Profile's midpoint, whereas the white metal continues to lag, the Gold/Silver ratio remaining well at historically high extremes by its present reading of 88.3x:
So to stack it all up, here is...
The Gold Stack
Gold's Value per Dollar Debasement, (from our opening "Scoreboard"): 2866
Gold’s All-Time High: 1923 (06 September 2011)
The Gateway to 2000: 1900+
Gold’s All-Time Closing High: 1900 (22 August 2011)
The Final Frontier: 1800-1900
The Northern Front: 1750-1800
On Maneuvers: 1579-1750
The Floor: 1466-1579
Le Sous-sol: Sub-1466
Base Camp: 1377
The 1360s Double-Top: (1362 in Sep '17 and 1369 in Apr '18)
2019's High: 1349 (20 February)
The Weekly Parabolic Price to flip Long: 1306
Neverland: The Whiny 1290s
Trading Resistance: 1286 / 1299
10-Session “volume-weighted” average price magnet: 1286
Gold Currently: 1284, (expected daily trading range ["EDTR"]: 10 points)
Trading Support: right here at 1284 and then 1276
The Box: 1280-1240
The 300-Day Moving Average: 1270 and falling
10-Session directional range: down to 1269 (from 1304) = -35 points or -2.7%
2019's Low: 1267 (02 May)
In closing, (and we really ought get away from these, but the Barron's brain-trust keeps allowing them to pass editing muster), here is their past week's daily "Dow" rationale: (Mon) "The Dow Drops 84 Points Because This Is Way More Than a Trade War"; (Tue) "The Dow Rose 197 Points Because Huawei Gets Some Cover in the Trade War"; (Wed) "The Dow Fell 101 Points Because Apple Could Be Drawn Into the Trade War"; (Thu) "The Dow Dropped 286 Points Because the Trade War May Be Just the Tip of the Iceberg"; (Fri) "The Dow Rose 95 Points Because Trump Says Huawei Could Be Part of the Trade Deal" ... and then to cap it all off in style: "The Dow Celebrates Five Weeks of Futility" Hilarious!
'Course, it shan't be so hilarious when it all really does go futile; so stay the Gold Course!
A thoughtful Memorial Day to Everyone.
share
share
share
share
share

Mark Mead Baillie has had an extensive business career beginning in banking and financial services for two years with Banque Nationale de Paris to corporate research for three years at Barclays Bank and then for six years as an analyst and corporate lender with Société Générale.
For the last 22 years he has expanded his financial expertise by creating his own financial services company, de Meadville International, which comprehensively follows his BEGOS complex of markets (Bond/Euro/Gold/Oil/S&P) and the trading of the futures therein. He is recognized within the financial community of demonstrating creative technical skills that surpass industry standards toward making highly informed market assessments and his work is featured in Merrill Lynch Wealth Management client presentations. He has adapted such skills into becoming the popular author each week of the prolific “The Gold Update” and is known in the financial website community as “mmb” and “deMeadville”.
Mr. Baillie holds a BS in Business from the University of Southern California and an MBA in Finance from Golden Gate University.
More from Gold-Eagle


