
Gold Market Update
 share
share
 share
share
 share
share
 share
share
 share
share
On Wednesday gold broke out from a 10-week long box or rectangular consolidation pattern to commence its next major upleg. Fundamentally this coincided with noises emanating from the US to the effect that it is recognized that there is no alternative but to continue with QE. Denials later in the day caused the broad stockmarket to lose much of its gains, but the fact is that there is no alternative to QE, except a global systemic economic implosion, and thus, there is no alternative to QE, although attempts may be made to disguise the extent of it.
On our 6-month chart we can see gold's breakout and how, after 7 days of gains, it is starting to become overbought. However, apart from brief pauses to partially unwind the overbought condition, it is expected to continue to advance strongly in coming weeks and months, overbought or not, and this positive outlook is reinforced by the strongly bullish picture for silver and Precious Metals stocks.

There has been talk in some quarters about gold "being in a bubble", but our long-term chart for gold going back to before the start of the bullmarket, shows that such an assertion is ridulous - gold has been in a steady uptrend as it has moved simply to compensate for the destruction of the purchasing power of fiat. What we are seeing here is real money, which gold is, standing out in an ocean if increasingly worthless fiat. Since gold has not been in a bubble and has not attracted the attention of speculators to any great degree it can be said to have an almost full tank of "bubble power", and if, in addition to its continued rise to compensate for the relentless attacks on fiat by central bankers and politicians, it does attract the attention of the investing public at large, its rate of rise could very easily accelerate rapidly and it could go into an ascending parabolic arc. This development is actually viewed as inevitable as we move ever closer to the fiat endgame of hyperinflation, but as we can see on the chart, it hasn't even started yet.

Speaking of gas in the tank, the last COT chart showed a setup similar to that which existed back at the start of February - before a $260 runup in the price of gold - so the impications of this chart are obvious.

We are going to end this Gold Market update by briefly summarizing the "global playbook" - once you grasp what is set out below you will understand why the continued advance in the prices of gold and silver are inevitable, and why their rate of advance is set to accelerate...
There is no way of resolving the Global Debt Crisis in a direct and honest manner - any attempt to tackle it head on would result in a global economic implosion and deep depression - and very possibly a state of total anarchy. The "de facto" decision has already been taken to inflate it away. While this will ultimately result in hyperinflation and possibly depression anyway, the transition to that state will be a lot smoother by taking the inflationary approach than it would be by taking the draconian root and branch approach. There will still be small to medium size defaults such as Greece, then Portugal, and after that probably Spain and Italy, but what will happen in each of these cases as they arise is that imminent default will be headed off at the last minute by them being bailed out and propped up, and whatever money is needed to patch things up and keep the system limping along will be forthcoming. In the United States, after much ritual wrangling, the debt ceiling will be raised - again and again and again, and the Fed will continue to backstop the Treasury market, and there will be QE3, QE4, QE5 and on and on, even if disguised under other names, and money will be manufactured in ever increasing quantities to keep eveything pumped up. For an investor it is crucially important to grasp what this means - it means that every default scare of this kind that spooks the markets will present another buying opportunity, as just happened with Greece, especially in commodities and in particular in gold and silver. A country such as Portugal will verge on default, bankers and politicians will run around like headless chickens for a few weeks, markets will drop, then suddenly - hey presto - the necessary funds to "kick the can down the road" yet again will be forthcoming and markets will breathe a sigh of relief and rally - and inflation will continue to build as the debt bill is pushed ever more onto the populace. The middle and lower classes of the world have been targeted to pay down the debts through ever increasing inflation that will reduce most to a state of penury. The good news is that if you understand the game THAT DOES NOT HAVE TO INCLUDE YOU.
The continuing debasement of fiat currencies around the world means that the bullmarkets in gold and silver are set to continue and to accelerate. Up until now both gold and silver having been moving higher in large part simply to compensate for the destruction of the purchasing power of fiat caused by inflation, but there is going to come a point when IN ADDITION to these important drivers, speculative interest in both metals is going to ramp up, as speculators are increasingly attracted to both metals simply because their prices continue to rise, with no prospect of them ceasing to do so. In addition there will be an ever increasing flow of funds into the Precious Metals by those desperate just to preserve their purchasing power in the face of the demise of fiat. This increasing influx of funds both from desperate investors and from speculators will eventually power the acclerating ramp in both gold and silver.
While it is true that China and Europe have been playing a dangerous game of chicken in recent weeks by raising interest rates, it is presumed that they will wake up soon and "come on side" and fully partake in the money pumping game, because if they don't the dollar will collapse relative to their currencies and their own economies will implode.
![]() Yesterday's high volume breakout above its 50-day moving average marked completion of the intermediate basing pattern and the start of the next major uptrend in silver. Everything in now in place for a substantial uptrend to develop in coming months that should take silver comfortably to new highs. Fundamentally yesterday's breakout was due to the realization in the markets that QE is set to continue, whether called QE or not, and in fact it must continue, as any attempt to apply the brakes at this late stage would result in a global systemic economic collapse. Hyperinflation will be the inevitable end result, as will prices for gold and silver at levels that many now would consider to belong solely in the realms of fantasy. We already had a foretaste of this coming ramp in Precious Metal prices earlier this year with the big runup in silver prices, before powerful interests decided the time was right to put the boot into the little guy by repeatedly hiking margin requirements over a short period. This served big money interests in 2 ways - first of all it crashed the silver price so that they can move in and scoop up more of it. Secondly big money is not all at concerned about margin requirements, since being wealthy in the first place they don't need to bother with margin at all, although it suits them to use it at times to maximise leverage. What the hiked margin requirements did do was to throw the little guy off the train, and like one of those old westerns big money is stood at the open end of the train carriage lighting up a cigar and grinning with satisfaction as the little guy rolls down the embankment and is left lying in the dust as the train chugs off into the distance without him.
Yesterday's high volume breakout above its 50-day moving average marked completion of the intermediate basing pattern and the start of the next major uptrend in silver. Everything in now in place for a substantial uptrend to develop in coming months that should take silver comfortably to new highs. Fundamentally yesterday's breakout was due to the realization in the markets that QE is set to continue, whether called QE or not, and in fact it must continue, as any attempt to apply the brakes at this late stage would result in a global systemic economic collapse. Hyperinflation will be the inevitable end result, as will prices for gold and silver at levels that many now would consider to belong solely in the realms of fantasy. We already had a foretaste of this coming ramp in Precious Metal prices earlier this year with the big runup in silver prices, before powerful interests decided the time was right to put the boot into the little guy by repeatedly hiking margin requirements over a short period. This served big money interests in 2 ways - first of all it crashed the silver price so that they can move in and scoop up more of it. Secondly big money is not all at concerned about margin requirements, since being wealthy in the first place they don't need to bother with margin at all, although it suits them to use it at times to maximise leverage. What the hiked margin requirements did do was to throw the little guy off the train, and like one of those old westerns big money is stood at the open end of the train carriage lighting up a cigar and grinning with satisfaction as the little guy rolls down the embankment and is left lying in the dust as the train chugs off into the distance without him.
Our 6-month chart for iShares, which is a good proxy for silver, shows the now extraordinarily bullish setup for silver. For some weeks it was not clear whether the C wave of the now completed A-B-C correction would take the silver price below the A wave low in May, which for iShares was exactly at $32, and had Greece not been bandaged up it would have, of course. The first sign of improvement was the breakout from the C wave downtrend channel about a week ago, after which the price was temporarily restrained by unfavorably aligned (falling) 50-day moving average, which forced a test of support at the top line of the channel, which we correctly anticipated. Then just yesterday the price blasted through the 50-day moving average on the highest volume for weeks, the importance of the resistance in the vicinity of this average being illustrated by the way the price gapped above it - a bullish "breakaway" gap. This is what we have been waiting for. This marks the end of the intermediate base building phase and the start of the next major uptrend.

The picture could not be more bullish. The price and its 50-day moving average have corrected back almost to the rising 200-day moving average which is now coming into play to support a major advance. The volume pattern during the base building process has been positive, with volume contracting, and the Accum-Distrib line shown at the top of the chart rising, indicating accumulation. Finally the COT charts are at their most bullish for ages with Commercial short and Large Spec long positions being at their lowest levels for a very long time.

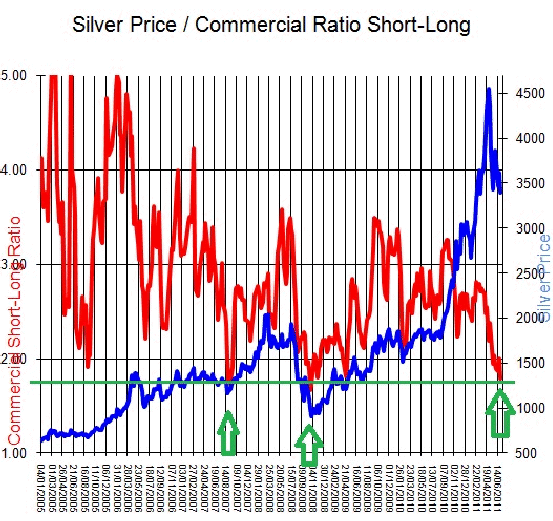
The lower COT chart is courtesy of the renowned Scarborough Bullion Desk in England.
Clive Maund, Diploma Technical Analysis
[email protected]
www.clivemaund.com
Copiapo, Chile, 14 July 2011
share
share
share
share
share

Clive P. Maund’s interest in markets started when, as an aimless youth searching for direction in his mid-20’s, he inherited some money. Unfortunately it was not enough to live a utopian lifestyle as a playboy or retire very young. Therefore on the advice of his brother, he bought a load of British Petroleum stock, which promptly went up 20% in the space of a few weeks. Clive sold them at the top…which really fired his imagination. The prospect of being able to buy securities and sell them later at a higher price, and make money for doing little or no work was most attractive – and so the quest began, especially as he had been further stoked up by watching from the sidelines with a mixture of fascination and envy as fortunes were made in the roaring gold and silver bull market of the late 70’s.
Clive furthered his education in Technical Analysis or charting by ordering various good books from the US and by applying what he learned at work on an everyday basis. He also obtained the UK Society of Technical Analysts’ Diploma.
The years following 2005 saw the boom phase of the Gold and Silver bull market, until they peaked in late 2011. While there is ongoing debate about whether that was the final high, it is not believed to be because of the continuing global debasement of fiat currency. The bear market since 2011 is viewed as being very similar to the 2-year reaction in the mid-70’s, which was preceded by a powerful advance and was followed by a gigantic parabolic price ramp. Moreover, Precious Metals should come back into their own when the various asset bubbles elsewhere burst, which looks set to happen anytime soon.
Visit Clive at his website: CliveMaund.com
More from Gold-Eagle


