
Gold Price And Silver Price Update
 share
share
 share
share
 share
share
 share
share
 share
share
 Since the flash-crash (24th of July down to $1,071), the technical picture for Gold has been improving step by step. First a $100-short-squeeze pushed Gold towards $1,170 in mid of august. Gold only briefly touched this level and corrected all the way down to $1,098. But during the last two weeks Gold managed to start a rally from these levels. Therefore we have a "$27 higher low" on the chart. That is positive. It has been quite a while since we got such a higher low in the gold market. The miners and silver still remain kinda shaky...but one could argue for bottom building patterns as well.
As you know I have been quite bearish the last 1-2 years but I feel like its getting time to join the bulls now. Its still way too early to call the definite end of this devastating four year bear market in precious metals but while listening to the gold-market the picture clearly is improving. I also like the fact that basically nobody is talking about a new gold bull. People gave up on precious metals or lost their last shirt catching a falling knife. As well I like the type of price action in the last two weeks... Looks like a "strong wall of worry" on which Gold is climbing higher. On top my model is in super bull mode!
Therefore I am now officially changing my mantra to "buy the dips as long as Gold stays above $1,120".

The fact that Gold is outperforming silver and the miners (GDX & GDXJ) is not supporting the idea of a new bull in Gold. You´d expect the miners to lead the sector higher. Especially with these low oil prices but so far the performance is pretty muted.
The Midas Touch Gold Model
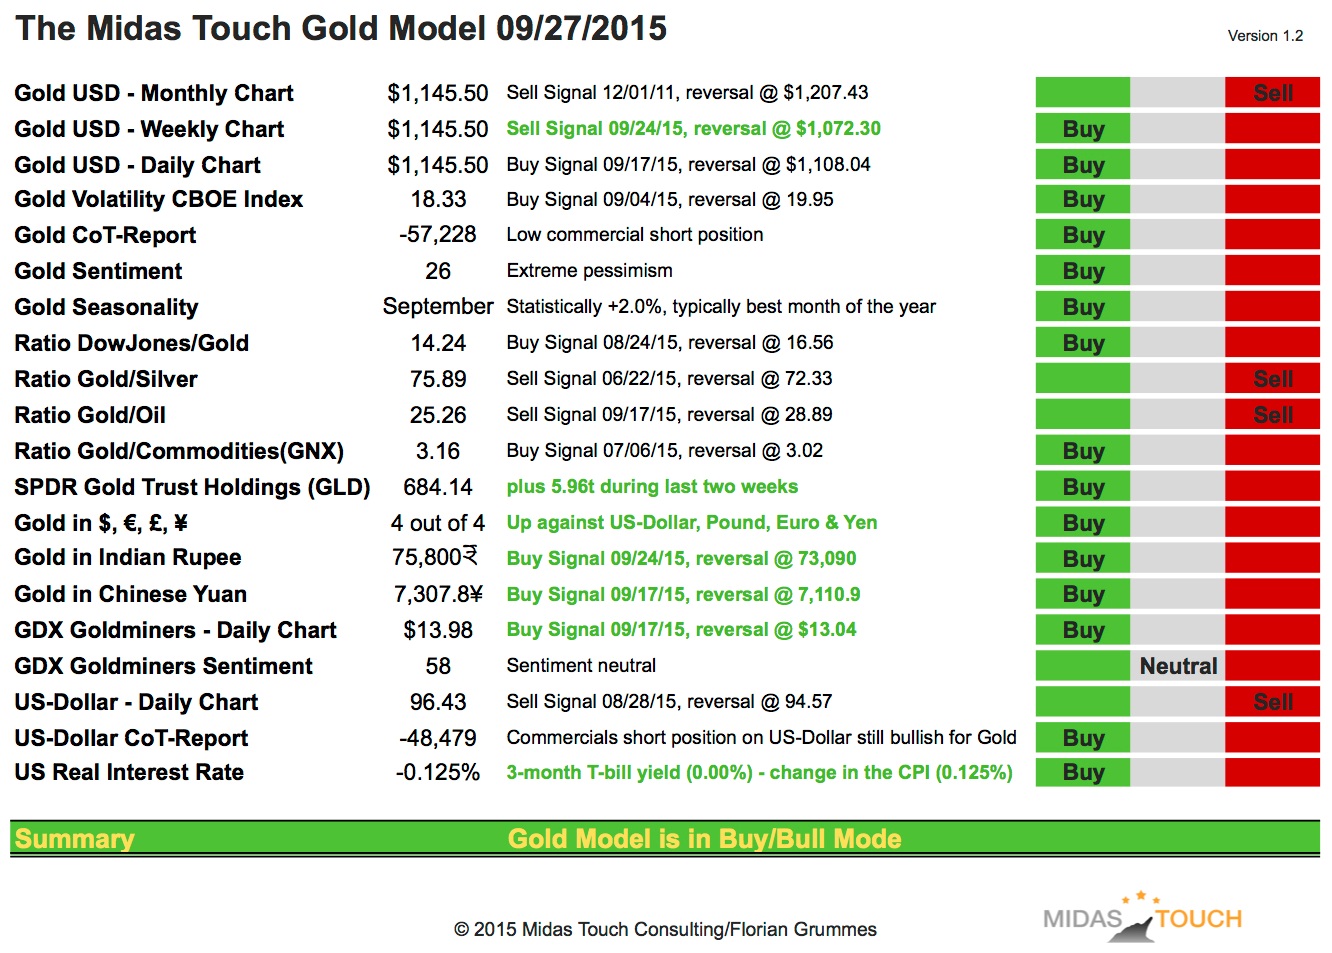
My Gold Model finally and for the first time ever is in super strong bull mode!!! Since it´s development it has been bearish most of the time but now the vast majority of its signals are all flashing a strong buy. Last Thursday the Gold USD-Weekly Chart flipped to bullish. The Gold USD-Daily Chart is already on a buy signal since 10 days. The Gold Cot-Report, Gold Sentiment and Gold Seasonality are already on a buy signal since many many weeks. The SPDR Gold Holdings has seen some inflows and Gold in $, €, £, ¥ turned bullish on Friday. Now that the FED has officially announced negative US Real Interest Rates, we should not be surprised if this is going to be the main fundamental driver for a new Gold bull.
Overall the model is in Buy/Bull mode.
Gold Daily Chart
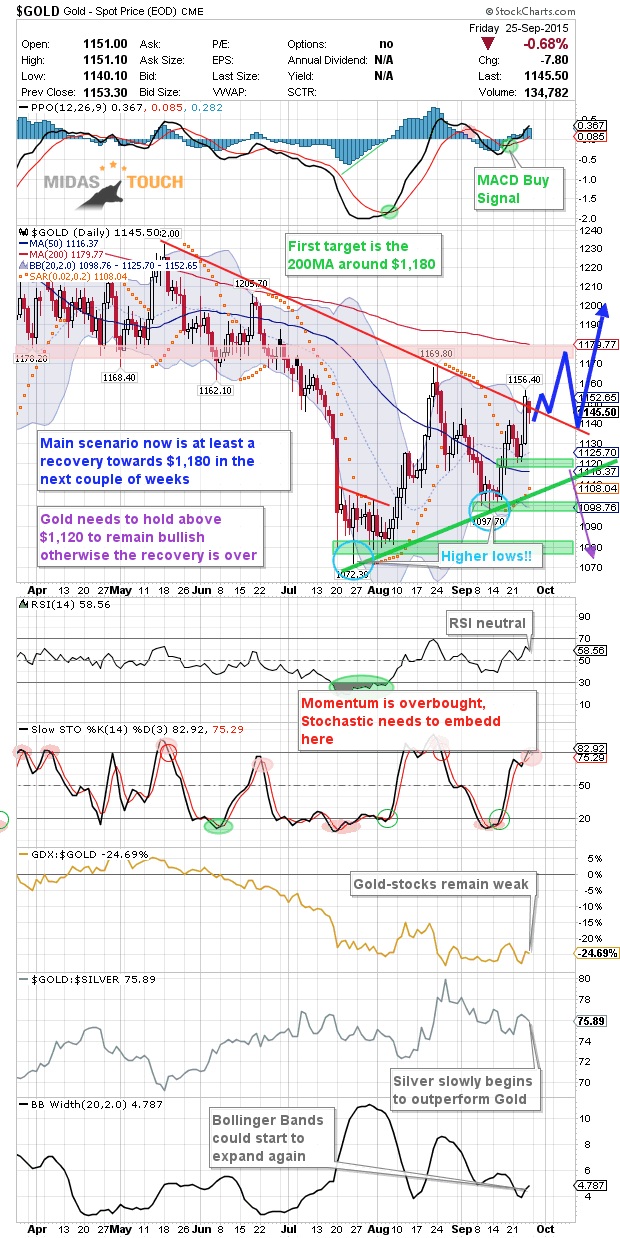
As I have already laid out: Gold is bullish - at least short-term The only concern is the overbought stochastic indicator. This indicator needs to embed if Gold wants to push towards $1,160 and later towards the 200MA ($1,179). If it doesn't we will get another setback which has to hold above $1,120 to keep the bullish picture alive. Overall a test of the former support and now strong resistance zone $1,170-$1,180 is very likely until mid of October.
Recommendations:
Swing-traders (if not already long) should search for an entry below $1,140 with a tight stopp at $1,120 and a profit target at $1,180. The risk reward ratio is not optimal but worth a try. If you don't find an entry within the next couple of days you need to stay patient. The resistance around $1,180 is a clear sell on the first attempt and should throw Gold back to at least $1,140 again later in October or November. Then you will get another (and better) chance to buy the dip/weakness.
I also do recommend buying/adding shares of GDX and GDXJ at current prices. Keep the position sizing small and use a 25% trailing stopp. Your initial position should already be profitable. Once the turnaround is getting more clear I will start publishing interesting stocks that have great fundamentals, an outstanding management and a very good technical setup.
Investors should now wait until the Goldmarkt presets another opportunity to pick up the physical metal below $1,100. If it doesn't get that cheap anymore I hope you acted on my numerous recommendations in the last couple of months.
Long-term personal beliefs
The return of the precious metals secular bull market is moving step by step closer and should lead to the final parabolic phase (could start in summer 2015 or 2016 and last for 2-5 years or even longer). Before this can start Gold will need a final selloff down to $1,050-$980. (Note: I am starting to question this believe!!! Should we have seen the bottom in July, Gold will move towards $1,500 within the next 2-3 years...). My long-term price target for the DowJones/Gold-Ratio remains around 1:1. -- and 10:1 for the Gold/Silver-Ratio. A possible long-term price target for Gold remains around US$5,000 to US$8,900 per ounce within the next 5-8 years.
Fundamentally, as soon as the current bear market is over, Gold should start the final 3rd phase of this long-term secular bull market. 1st stage saw the miners closing their hedge books, the 2cd stage continuously presented us news about institutions and central banks buying or repatriating gold. The coming 3rd and finally parabolic stage will end in the distribution to small inexperienced new traders and investors who will be subject to blind greed and frenzied panic.
********
If you like to get regular updates on this model and gold you can subscribe to my free newsletter here: http://bit.ly/1EUdt2K
share
share
share
share
share
 Florian Grummes (born 1975 in Munich) has been studying and trading the Gold market since 2003. In 2008 he started publishing a bi-weekly extensive gold analysis containing technical chart analysis as well as fundamental and sentiment analysis. Parallel to his trading business he is also a very creative & successful composer, songwriter and music producer. You can reach Florian at: [email protected].
More from Gold-Eagle


