
Gold Price And Silver Price Updates
 share
share
 share
share
 share
share
 share
share
 share
share
Gold sector cycle is down as of 10/30, ending the up cycle since 9/11.
Gold Sector
$HUI is on a long-term sell signal since March 2012.
Long term signals can last for months and years and are more suitable for the long-term investors.
$HUI is on a short-term buy signal.
Short-term signals can last for days and weeks and are more suitable for traders.
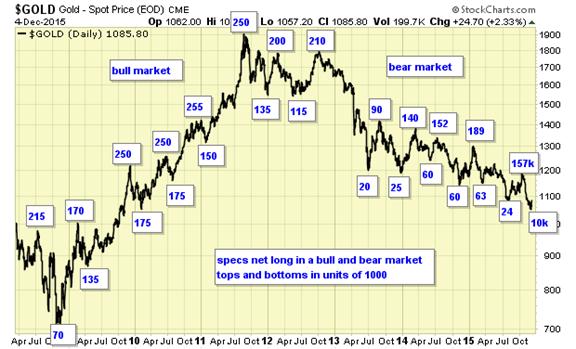
Speculation is now at the lowest level since 2001, primed for a recovery.
However, the long-term trend remains down and the current consolidation could take a few weeks to resolve.
Summary
Gold sector is on major sell signal.
Cycle is down.
A recovery is in progress but condition can be very choppy.
Silver Sector
Silver is on a long-term sell signal since Dec 2011.
Long term signals can last for months and years and are more suitable for long term investors.
SLV – is on short term buy signal.
Short term signals can last for days and weeks and are more suitable for traders.
Summary
Silver is on a long-term sell signal and investors should be in cash or short.
Short-term is on buy signal and a recovery is in progress.
Traders should wait for the completion of the recovery and begin shorting again.
********
Courtesy of www.simplyprofits.org
share
share
share
share
share

Jack Chan is the editor of Simply Profits, established in 2006. Chan bought his first mining stock, Hoko Exploration, in 1979, and has been active in the markets for the past 37 years. Technical analysis has helped him filter out the noise and focus on the when, and leave the why to the fundamental analysts. His proprietary trading models have enabled him to identify the NASDAQ top in 2000, the new gold bull market in 2001, the stock market top in 2007, and the US dollar bottom in 2011.
More from Gold-Eagle


