Gold Price Forecast – Watch Out! Gold in Bear Market
 share
share
 share
share
 share
share
 share
share
 share
share
 Gold and silver are in bear markets.
Why? The market-perceived reaction by the Federal Reserve to quash inflation by raising interest rates.
Whether or not the Fed is ever successful at bringing inflation down is immaterial – the market believes that the Fed will be successful, and the market is selling gold as a result. Those who disagree with the price action of the market itself will do so at their own peril over the coming years.
Precious metals investors should temper their expectations for higher prices, and take appropriate defensive action.
Gold Breaks Lower
Below is the chart of gold from 2003 through present.
Gold has just broken lower from a pattern which was last triggered in 2013, following which it fell by nearly $500 over the next three years.
Note the breakdown (red callout) of the 2.5-year consolidation (black lines) above the $1,676 level. Gold has officially broken lower through this support.
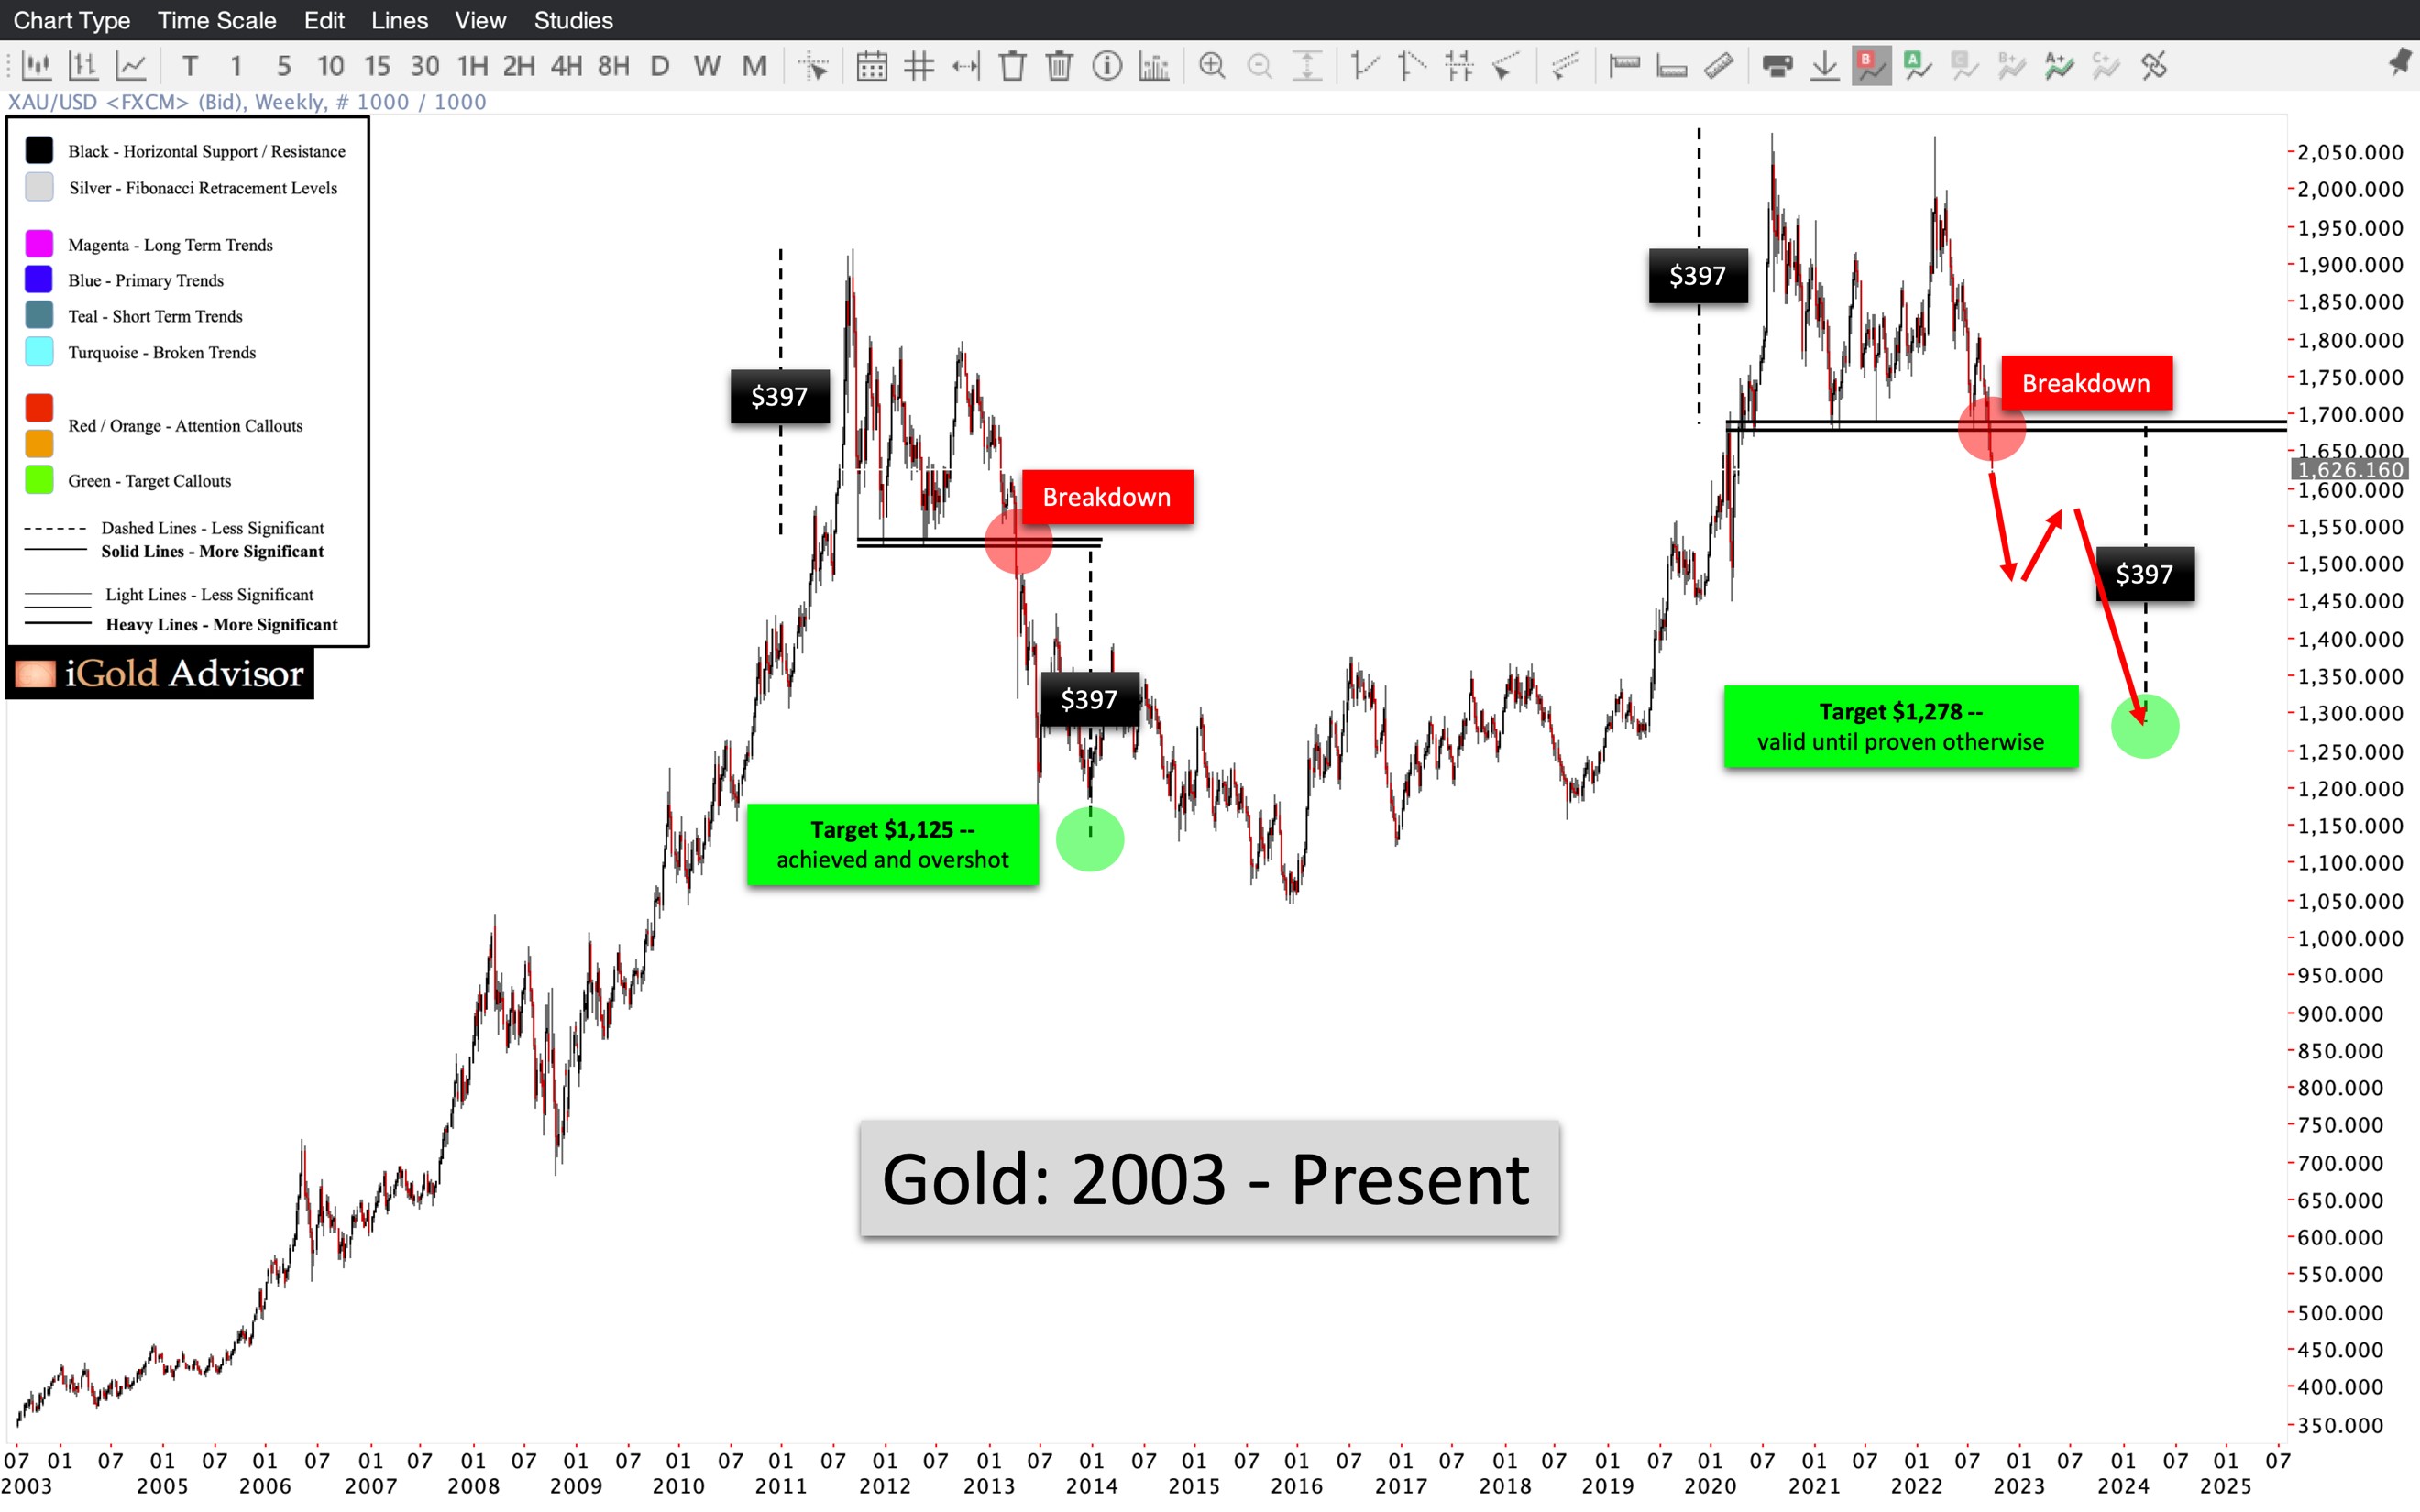
The last time that gold witnessed a breakdown of this magnitude was in 2013. Between 2011 – 2013, gold consolidated in a range between $1,522 - $1,919, an amplitude of $397.
When gold broke lower through this consolidation in 2013 (red callout), we calculated a target of $1,125 (green), equal to the amplitude of the consolidation subtracted from the breakdown point.
This target was indeed achieved for gold in 2014, when prices crossed lower through $1,125 (green). Not only that, but gold actually overshot the target, falling to $1,045 in December 2015.
This is the power of technical analysis – it cuts through the rhetoric.
Anyone claiming “the dollar is going to fall, so buy gold”, or “you won’t be able to buy physical” were dead wrong, as the dollar remained strong, and physical gold could be purchased during this entire time (always at a premium to the bulk commodity, similar to how T-shirts have astronomical premiums over bulk cotton; this premium waxes and wanes as demand for small denomination gold changes throughout time).
Gold Breakdown Again
This exact same breakdown as in 2013 has just been witnessed again for gold. The only difference is that this time it has been triggered from a slightly higher level. Whereas in 2013 the breakdown point was $1,522, this time the trigger point is $1,676. The end result is the same as per downside calculation.
Note that the amplitude of the previous 2.5-years of consolidation is exactly the same as in 2013: $397.
Again, the breakdown has already occurred. This is no longer hypothetical.
To derive a target for a breakdown of this magnitude, we subtract the amplitude of the consolidation from the breakdown point, and arrive at a target of $1,278 for gold.
$1,278 is thus our official target for gold, valid until proven otherwise.
What Would Negate the Breakdown?
What would it take to negate this target? There is always a point at which an analyst recognizes that his operating thesis is wrong. What would it take to show us that we are wrong here?
Let us refer to the following chart:
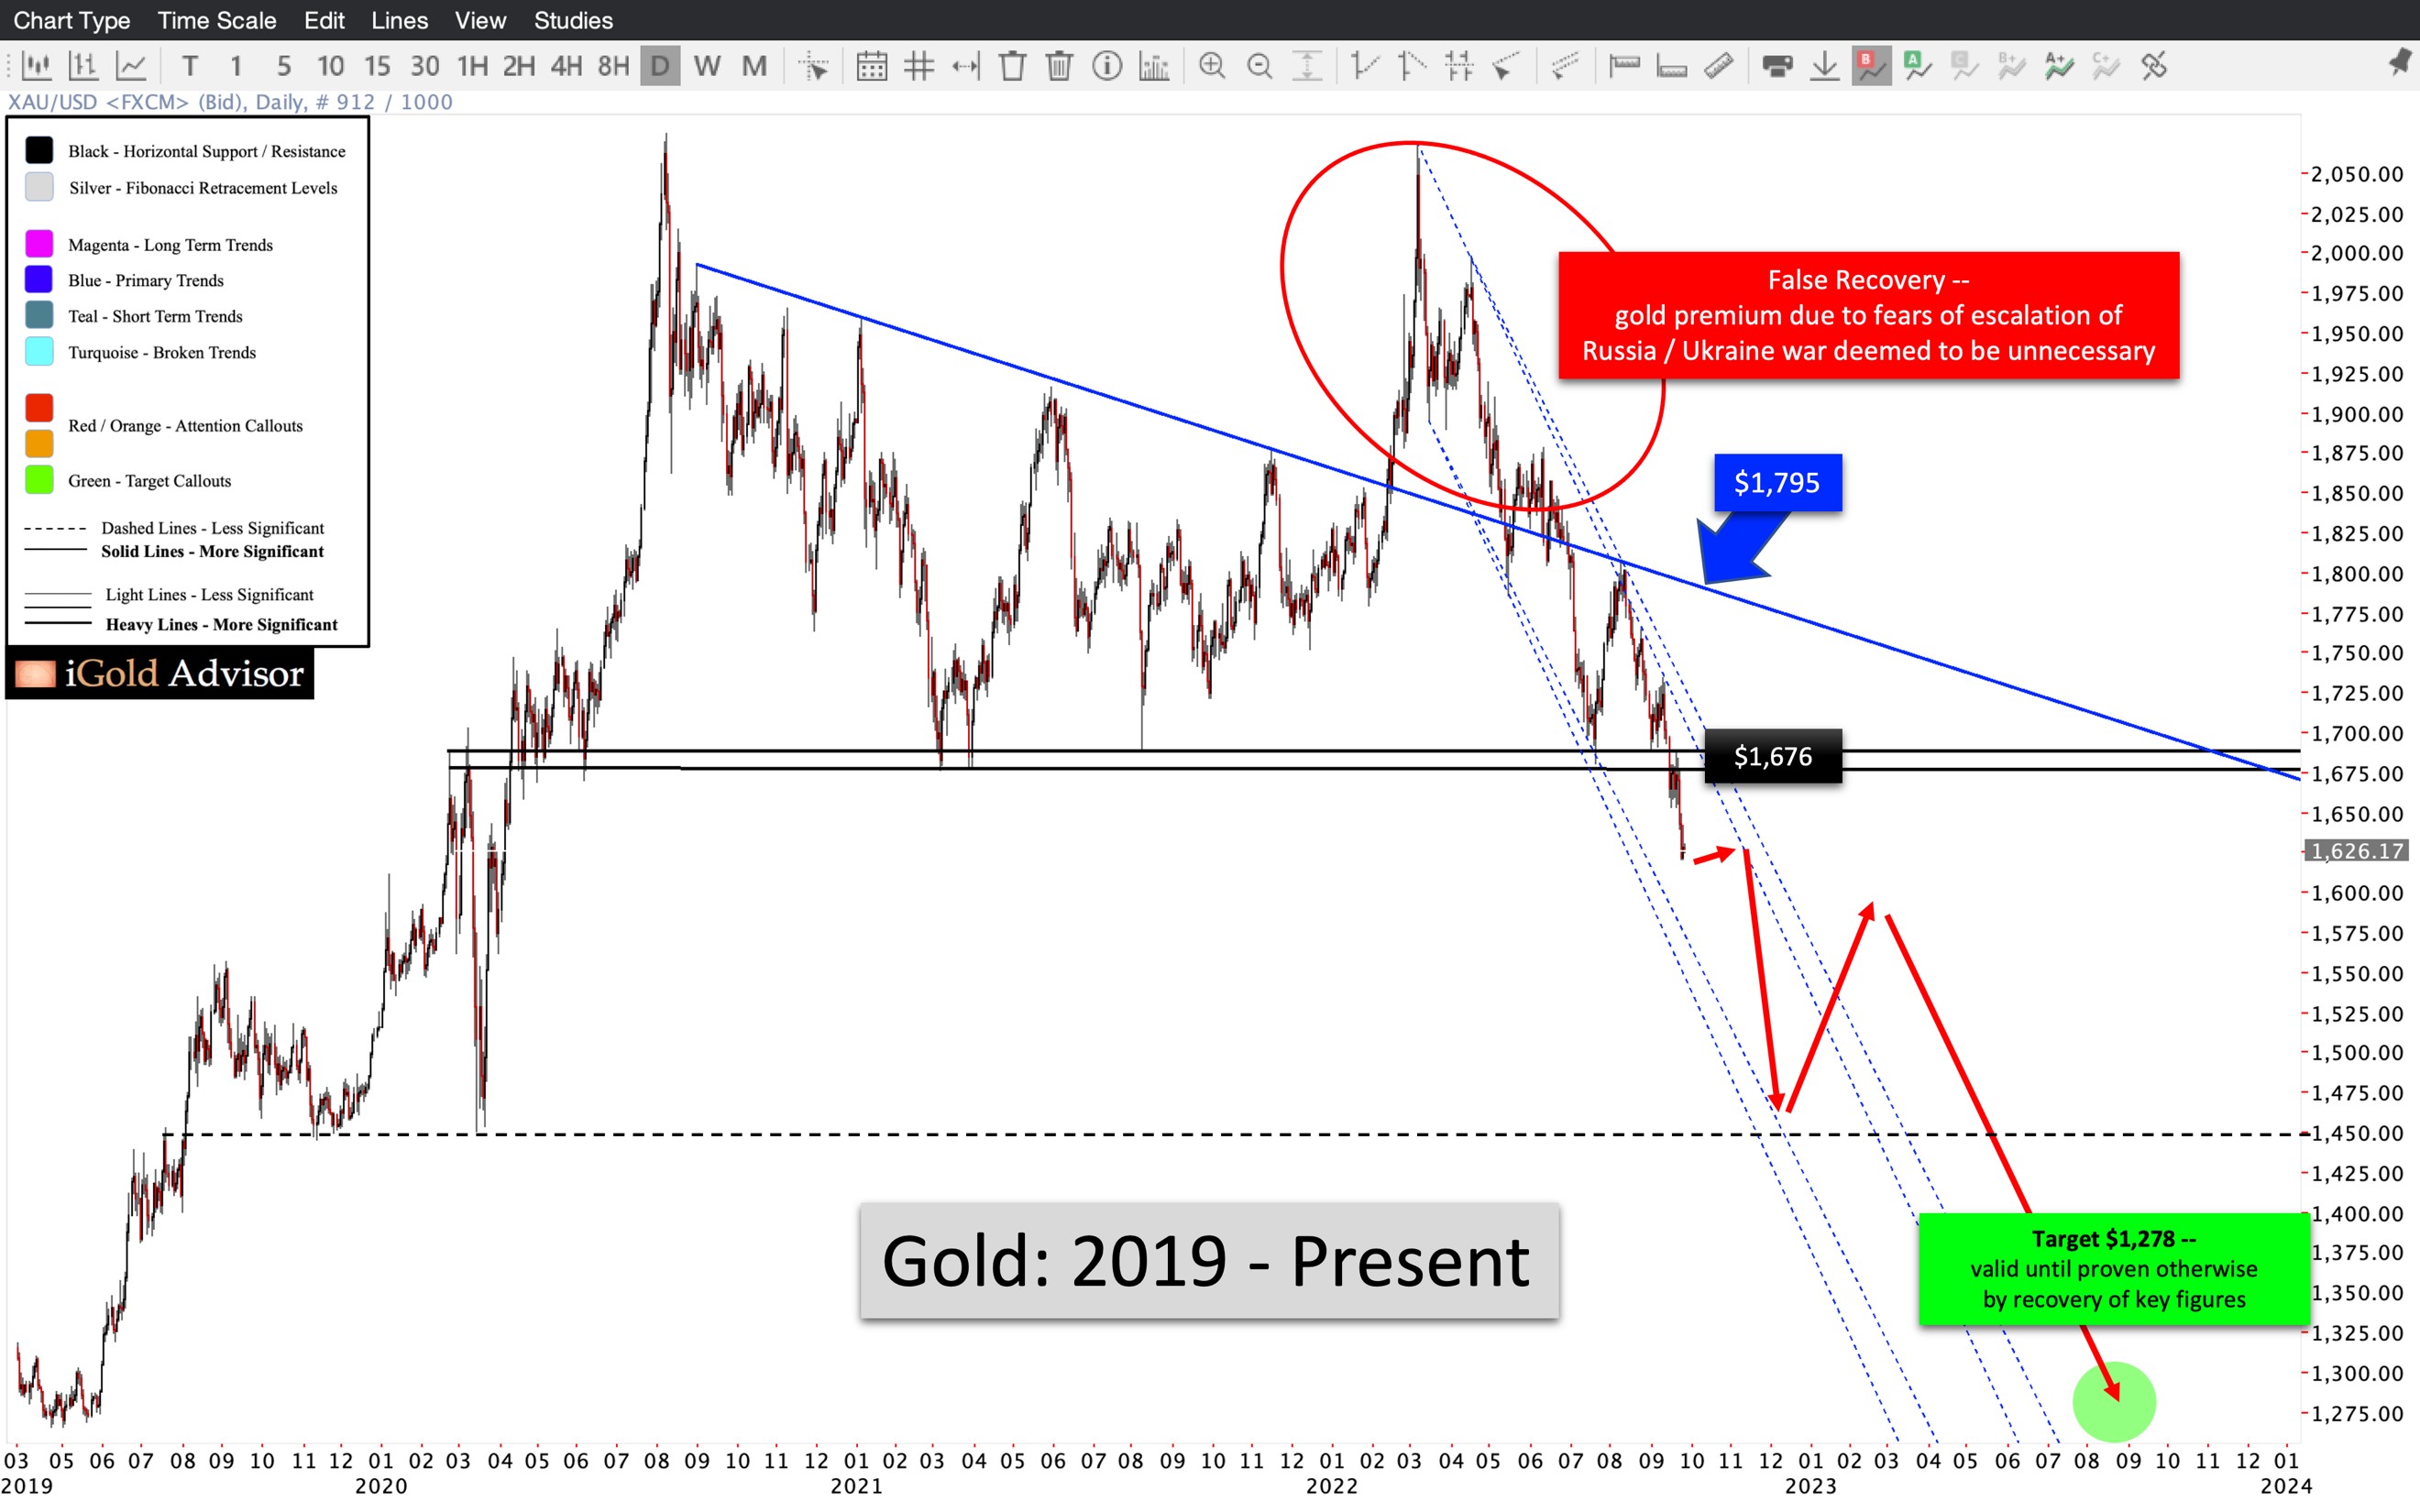
To negate the lower target, a recovery of the breakdown point at $1,676 (black) would be a healthy start in showing us that this breakdown is false. However, it would not be enough on its own.
In order to fully negate the $1,278 target, we also need to see a breaking of the downward structure which has defined gold’s decline since 2020 (blue). This level presently comes in at $1,795, and it is falling in time.
As we can see from the number of times this trend of sellers was respected in 2020 – 2022, on at least six occasions these sellers appeared at successively lower prices along this resistance zone. The one exception to this was the attempted breakout in Q1 2022 (red), which proved itself to be a false recovery in retrospect, as the Russia war gold premium was deemed to be unnecessary after the conflict did not spread beyond Ukraine.
In sum then, as technical-based investors and traders we must wait for both a recovery of the breakdown point ($1,676), and furthermore a breaking of the downward structure for gold ($1,795, falling) before we can call this bear market over.
Beware Fundamental Myth-Tellers
Over the coming months and years, as gold is declining, many fundamental-based analysts will be claiming that the bottom is in for gold at frequent intervals, often relying on one form of misleading analysis or another.
Example A: “The dollar is eventually going to zero, so buy gold now!”
Example B: “The stock market is going to crash, so buy gold now!”
Example C: “It’s only the paper price which is falling, not the physical price, so buy gold now!”
No. No. No.
All of these false narratives will be proven wrong over the coming months and years, as the price steadily declines toward our outstanding $1,278 target (unless proven otherwise by a negation of the key price triggers defined above).
The truth is, the bottom will not be in until gold hits a visible support level on the chart, and witnesses a bottoming technical formation simultaneously. We will be monitoring for these signals and tuning out the fundamental myths regularly for our premium subscribers going forward.
Takeaway on Gold
Gold has broken through a key technical level last witnessed in 2013. A near-$500 decline followed over the next three years.
Gold has broken lower again this time, and has a target of $1,278.
Remember, it is not about whether or not the Fed is successful in controlling inflation. It is about what the market believes. And right now, the market believes the Fed will be successful. Ignore the market in the same way you might ignore an irrational stampede of people fleeing from an imaginary boogeyman – you might be “right”, but you will be crushed nonetheless.
I’d rather avoid the stampede and profit as gold falls.
Our subscribers at www.iGoldAdvisor.com have already booked a 121% profit in less than three weeks on one trade as gold declined. Our next trade is presently up by 159% in six weeks, and there is plenty of more profit to be made as we wait for gold to decline.
Now, initiating these exact same trades is NOT recommended at this time, as the premiums have already skyrocketed compared to when we bought them. However, there may be an appropriate time to take defensive action again in the near future.
Are you prepared this time, or will you be listening to the same fundamental myths that led investors to catastrophic declines from the 2011 – 2015 bear market?
*******
share
share
share
share
share

Christopher Aaron began his career as an intelligence analyst for the CIA and Department of Defense. He served two tours to Afghanistan and Iraq between 2006 - 2009, conducting pattern-of-life mapping for military leaders.
Mapping shares similarities with technical analysis of the financial markets because both involve the interpretation of repeating patterns found in human nature. He is the founder of iGold Advisor, providing independent research and analytics on all aspects of the precious metals markets.
He speaks regularly on the cyclical patterns found within the financial markets and on international policy. He has been featured in the New York Times and NPR news amongst other financial publications.
More from Gold-Eagle


