Gold Prices In 2020?
 share
share
 share
share
 share
share
 share
share
 share
share
 US National Debt: We know the progression of debt – it increases, or it increases rapidly. Since 1913 the official US national debt has increased about 9% per year – every year. Has the economy increased 9% per year? Of course not! And that is why, in truly simple terms, prices rise. The same is largely true in the UK, Europe, and Japan. It is the same old story throughout the history of other fiat currency experiments.
Prices rise for consumer goods and for gold, stocks, and almost everything else (gasoline no longer costs 15 cents nor coffee 5 cents per cup).
But you might argue that the population increased and that was why debt increased. Not so! Examine the (linear scale) graph below. It shows the US national debt divided by population and compares it to the SUM of gold and the S&P 500 Index for 40 years.

This is the same data shown on a log scale graph. Debt and prices increase together exponentially.
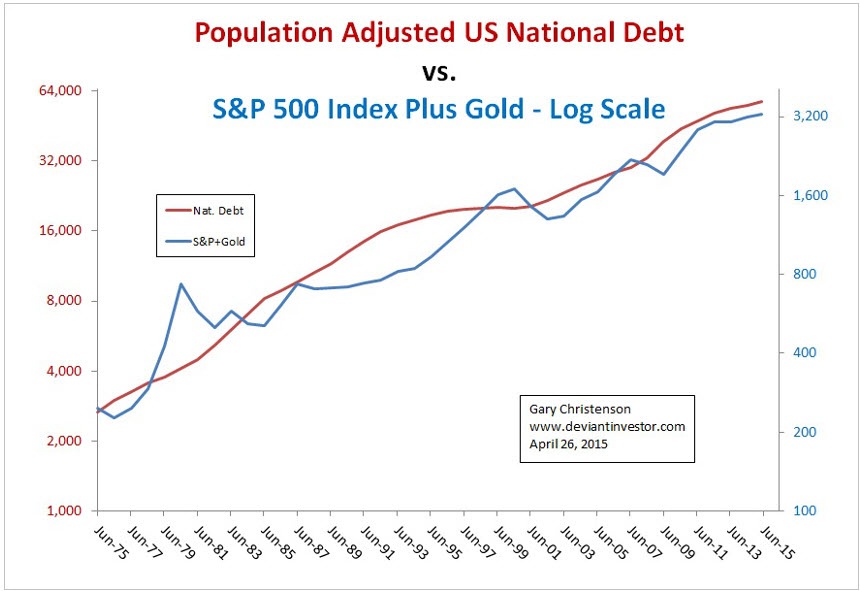
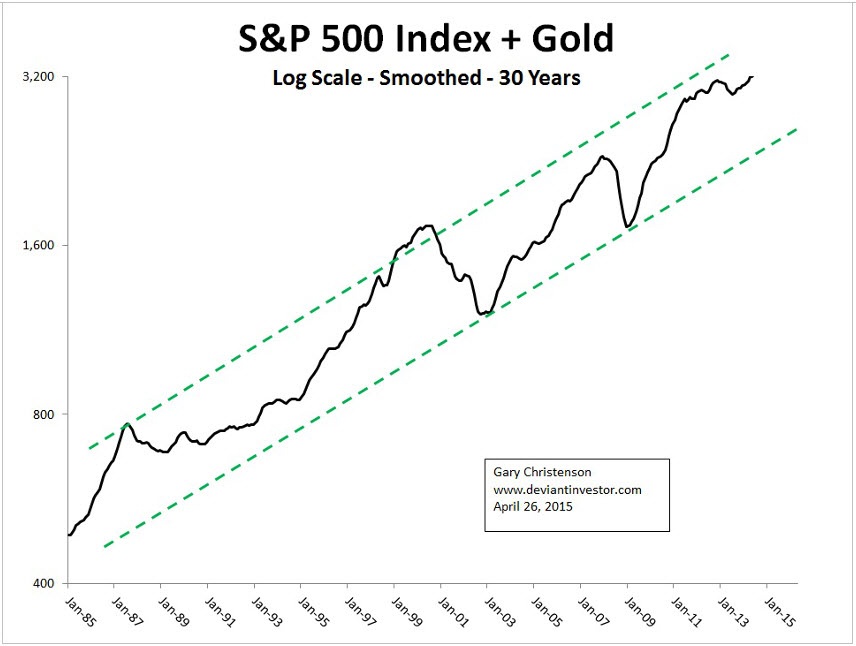
Why use the Sum of gold prices plus the S&P500 Index? Gold prices and the S&P500 move higher together in the long-term because the dollar buys less each decade. But in the short-term they often move in opposite directions. Gold represents real assets while the S&P500 represents paper assets so the Sum relates well to population adjusted national debt. Examine the following log scale graph of monthly prices.
SUMMARY:
- Population adjusted national debt moved higher along with the Sum in a channel at approximately 6.7% per year for the last 30 years. The statistical correlation between national debt and the Sum for 30 years of annual prices is over 0.95. We can be assured that national debt will increase, so expect the Sum to increase also.
- National debt in the US and elsewhere is rising rapidly. As the debt increases the dollar, yen, pound, and euro devalue and purchase less gold and equities. Hence stock prices and gold prices rise.
- The S&P500 Index reached an all-time high in April 2015 while gold has fallen back to 2010 levels and is approximately 40% below its all-time 2011 high. The next major moves are likely to be:
- National debt moves higher – all but guaranteed.
- The S&P 500 Index corrects lower. When? Ask the High-Frequency-Traders!
- Gold begins a new rally phase and surpasses $2,000 on its way much higher.
SPECULATION…MORE OF THE SAME SCENARIO
MORE OF THE SAME SCENARIO
- US population adjusted national debt increases at an average 6.7% rate until 2020.
- The S&P oscillates above and below 2,000 as the economy weakens.
- No nuclear war, no financial meltdown, the usual politics, more QE, and no “black swans” landing.
- The “big reset” is miraculously delayed into the next decade.
- The SUM reaches approximately 4,800 by 2020, with the S&P at about 2,000 and gold sells for about $2,500 – $3,000.
CHICKENS COME HOME TO ROOST SCENARIO
- US population adjusted national debt increases more rapidly at about 7.5% per year until 2020.
- Business conditions deteriorate causing the S&P to fall from its current 7.5 year cycle high to about (guessing) 1,200 – 2,000.
- The Middle-East, Ukraine, and other wars intensify, by 2020 the US dollar is no longer the undisputed global reserve currency, and the US dollar has weakened considerably.
- By 2020 many financial and paper assets are recognized as dangerous and gold and silver have been revalued much higher.
- Gold prices rise propelling the Sum to the high end of its 30 year range – about 6,500 to 8,000. By 2020 gold prices average $5,000 to $7,000.
HYPERINFLATIONARY SCENARIO for 2020
- Debt escalates out of control to unimaginable numbers. Governments find someone else to blame.
- The S&P500 Index goes parabolic.
- Financial TV commentators are practically breathless as they discuss the huge increases in the S&P and ignore the rampant inflation, unemployed workers, and social distress.
- Social and economic conditions are deadly and exceedingly difficult.
- Income equality in the western world worsens and riots become more common.
- Gold prices go parabolic and reach currently unthinkable numbers.
CONCLUSIONS REGARDING ALL SCENARIOS
- History and current actions justify the expectation that governments and central banks will increase debt, devalue fiat currencies, and thereby force gold and silver prices much higher.
- Convert digital dollars, yen, pounds, and euros into gold and silver while you can. Current “on sale” prices will not last much longer.
- Look for similar analysis regarding silver prices in 2020 in an upcoming article.
********
Courtesy of http://goldsilverworlds.com/
share
share
share
share
share


