
Gold Stocks: Spectacular Charts In Play
 share
share
 share
share
 share
share
 share
share
 share
share
 Gold and Japanese fiat are unlikely friends. During economic crisis, money managers treat both gold and the yen as safe havens. Top FOREX traders use the action of the dollar against the yen for cues to place bets on gold against the dollar.
From a fundamental perspective, while it’s true that both the US and Japanese governments worship debt, Japanese citizens are maniacal savers, while American citizens are notorious “debtaholics”. Also, most institutional carry trades are based on the yen. When those trades implode, significant buying of the yen, and gold, can occur.
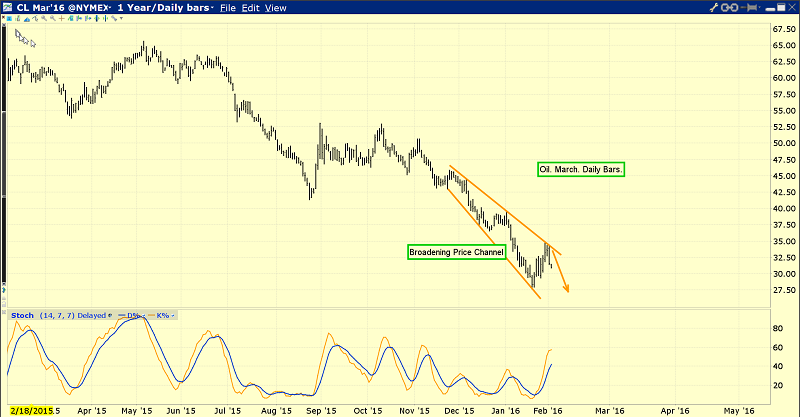
That’s the daily bars chart for oil. The latest rally is failing, within an ugly broadening down channel.
The failing oil rally could trigger another global stock market rout, and another surge of yen and gold buying.

This is the dollar versus yen daily bars chart. After breaking a major uptrend line, the dollar has rallied back towards that trend line.
That’s a tiny “risk on” rally. The dollar rallies against the yen when oil rallies, and when global stock markets rally. If oil and global stock markets take out their recent lows, the yen and gold will probably surge higher, and do so aggressively.
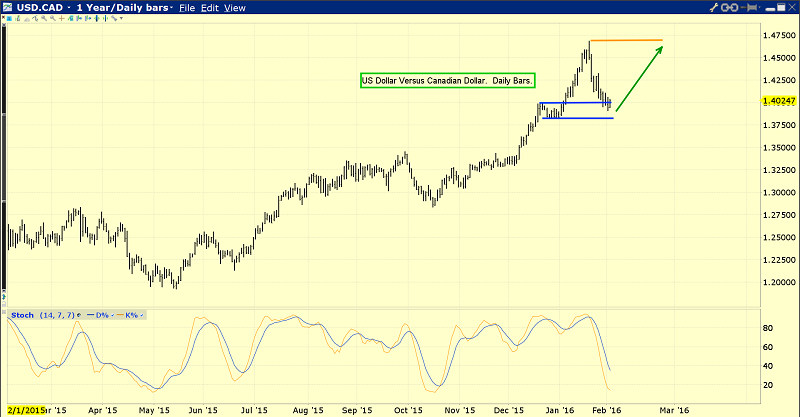
The technical action of this US dollar versus Canadian dollar daily bars chart is in sync with what is happening on the yen and oil charts.
US fiat will rally against Canadian fiat if oil tumbles, because Canada is a major oil exporter. Oil companies in Alberta are in a lot of trouble already, and the situation is becoming dire.
Having said that, it’s very important that the Western gold community makes a serious effort to be realistic about the price drivers that are actually in play in the gold market.
America’s days as the world’s “top economic dog” are over. From a simple mathematics perspective, 350 million (or more) debt-oriented Americans can’t compete with 2.7 billion gold-oriented Chindians.
America is probably going to experience another 1929 type of event, and it will likely be sooner rather than later. Regardless, the Eastern love trade (gold jewellery) is quickly becoming the main factor in the overall US dollar gold price discovery process.

This is the beautiful daily bars gold chart. A magnificent uptrend channel is in play.
While the love trade continues to grow in price discovery power, the fear trade is still very important. Gold has a rough general tendency to swoon in the days ahead of the monthly US jobs report, and the next one will be released on Friday at 830AM.
After the report is released, gold tends to stage a very strong rally in the days that follow that report. Gold is trading with very modest volatility now, because of Chinese New Year buying, and ongoing buying in India.

Indian gold demand is not “here today and gone tomorrow” like it is in America. It’s inelastic and based on religion.
In a nutshell, gold demand growth in India is probably the most powerful citizen-oriented economic force on planet Earth.
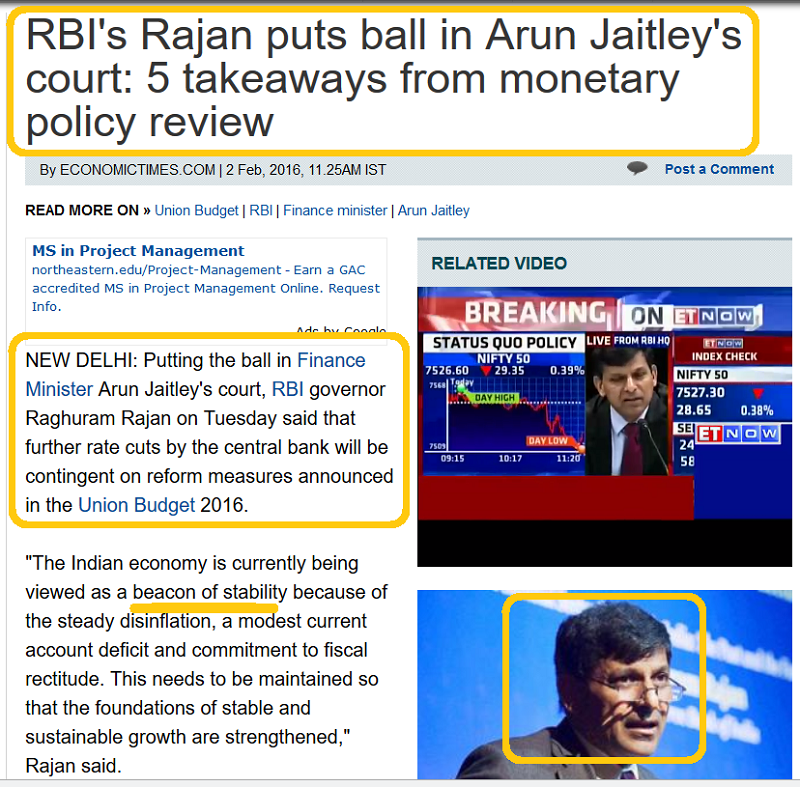
I’ve argued that Raghuram Rajan is likely the greatest central banker in the history of the world, and certainly one of them. He’s putting real pressure the India’s finance ministry to unveil serious economic reforms.
His actions open the door for Janet Yellen to do the same thing, and I don’t think she will drop that ball. More pressure from Janet on the US government’s insane spending habits is coming. That means more US rate hikes are coming, and since American QE has failed, gold revaluation is the tool Janet would use if America experiences a “1929 2.0” economic meltdown.
Sir John Templeton never tried to call any kind of “final bottom” in financial markets. He simply looked for, and found, outstanding value. Likewise, value-oriented investors in the Western gold community should never view their account drawdowns as an “error”.

For the value investor, viewing drawdowns as an error is like calling the concrete foundation of their house an error. There is no error. In regards to the concept of value, what is arguably the global financial markets’ “chart of the year”. The massive bullish wedge pattern in play on this daily bars GDX chart looks truly spectacular.
Note how close GDX is, to staging a significant upside breakout above the supply line of the wedge! Within GDX itself, many of the component stocks are staging massive upside rallies. That suggests a GDX breakout is now imminent.
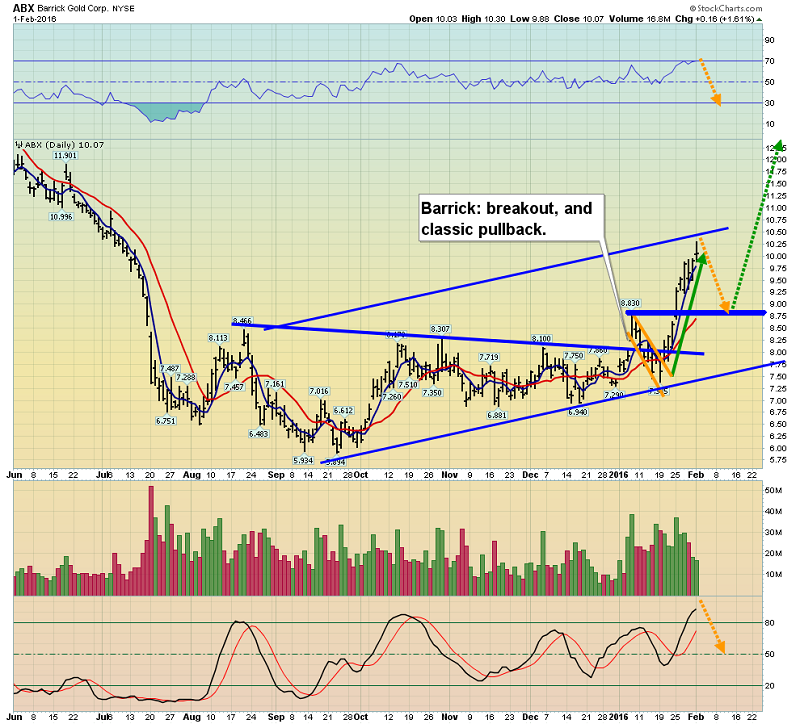
That’s the Barrick daily chart. With significant cost cutting and massive production in play, the stock is poised to lead GDX higher.
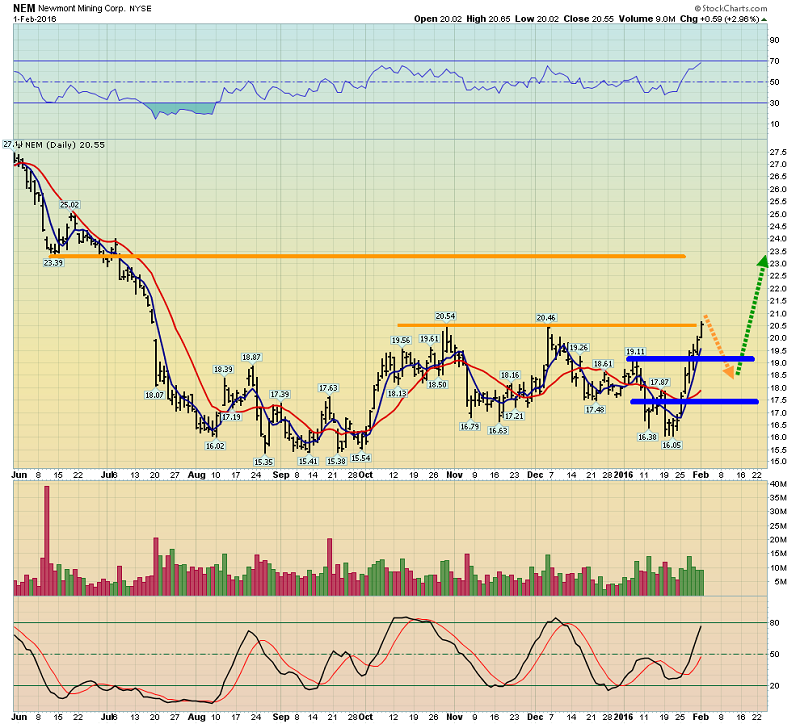
This is the Newmont daily chart. The company is poised to stage a major upside breakout. With both Newmont and Barrick surging higher, institutional and value-oriented money managers are beginning to pay attention to the price action.
Most gold stocks have “proven their mettle” in the latest financial markets meltdown, and are poised to become the world’s “go to” asset. Western financial markets look shaky at best. Chinese gold buying is solid. Indian gold buying intensifies with each gold buying season, while mine supply stalls. Clearly, all lights for gold are green!
********
Special Offer For Gold-Eagle Readers: Please send me an Email to [email protected] and I’ll send you my free “X Marks The Golden Spot!” report. I highlight five “under the radar” GDX component stocks that appear poised to join the upside leaders. I include key buy and sell points for each stock!
Note: We are privacy oriented. We accept cheques. And credit cards thru PayPal only on our website. For your protection. We don’t see your credit card information. Only PayPal does. They pay us. Minus their fee. PayPal is a highly reputable company. Owned by Ebay. With about 160 million accounts worldwide.
Email: [email protected]
Rate Sheet (us funds):
Lifetime: $799
2yr: $269 (over 500 issues)
1yr: $169 (over 250 issues)
6 mths: $99 (over 125 issues)
To pay by cheque, make cheque payable to “Stewart Thomson”
Mail to:
Stewart Thomson / 1276 Lakeview Drive / Oakville, Ontario L6H 2M8 Canada
Stewart Thomson is a retired Merrill Lynch broker. Stewart writes the Graceland Updates daily between 4am-7am. They are sent out around 8am-9am. The newsletter is attractively priced and the format is a unique numbered point form. Giving clarity of each point and saving valuable reading time.
Risks, Disclaimers, Legal
Stewart Thomson is no longer an investment advisor. The information provided by Stewart and Graceland Updates is for general information purposes only. Before taking any action on any investment, it is imperative that you consult with multiple properly licensed, experienced and qualified investment advisors and get numerous opinions before taking any action. Your minimum risk on any investment in the world is: 100% loss of all your money. You may be taking or preparing to take leveraged positions in investments and not know it, exposing yourself to unlimited risks. This is highly concerning if you are an investor in any derivatives products. There is an approx $700 trillion OTC Derivatives Iceberg with a tiny portion written off officially. The bottom line:
Are You Prepared?
share
share
share
share
share
 Stewart Thomson is president of Graceland Investment Management (Cayman) Ltd. Stewart was a very good English literature student, which helped him develop a unique way of communicating his investment ideas. He developed the “PGEN”, which is a unique capital allocation program. It is designed to allow investors of any size to mimic the action of the banks. Stewart owns GU Trader, which is a unique gold futures/ETF trading service, which closes out all trades by 5pm each day. High net worth individuals around the world follow Stewart on a daily basis. Website: www.gracelandupdates.com.


