
Gold Stocks Surge & Utilities Crash
 share
share
 share
share
 share
share
 share
share
 share
share
Dow Shadows Of Death Chart

• Volume on this chart is very bearish. Distribution days are starting to dominate. This is likely “dumb money” entering the market, and smart money making a hasty retreat.
• Note the “shadow of death” candlesticks, which are classic technical indication of a market top. The Dow is trying to go higher, but losing the battle by often closing the day’s trading with an overhead shadow on the chart.
• Market tops take time to form, and a big one appears to be taking shape now.
XLU (Utilities ETF) Crash Now Chart
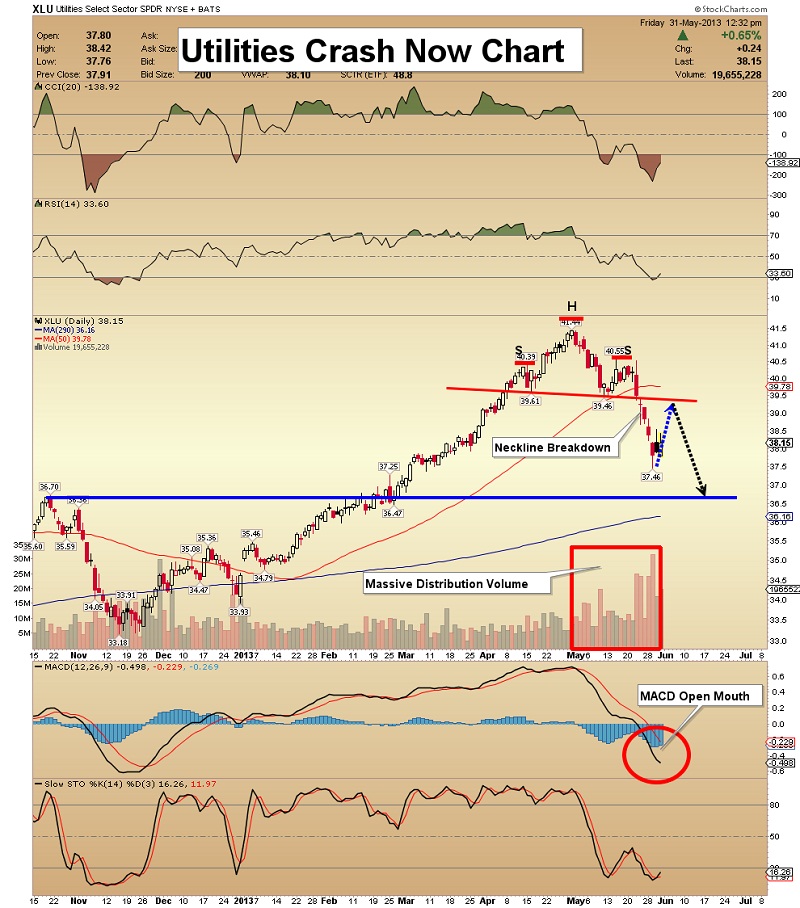
• It’s unusual to see the utilities sector dramatically underperforming, compared to the Dow, but that is happening now.
• Note the head & shoulders top on this chart. I am projecting that a similar pattern will form on the Dow,with a full break of the neckline.
• There is massive distribution volume in the utilities sector, and the crash there may indicate serious institutional concern about interest rates, and the bond market.
• All my indicators suggest this is not just a normal bull market correction, but the beginning of a very serious decline.
• My recommendation: Get out of the stock market now.
Gold COT Chart

• In the last several weeks, the COT data has become even more bullish, with the “smart money” commercial traders holding their smallest net short position since 2008.
• I’m projecting that gold will reach $1500 in the short term. If that target is reached, I’ll re-evaluate the technical condition of the market. If gold does break lower, my target is $1260.
GDX Bull Gap Chart

• In the short term, it would be ideal to see GDX move to $37.10, which is a key Fibonacci retracement area.
• Volume patterns suggest higher prices are coming.
• Note the potential inverse h&s bottom on the chart. Yesterday’s gap higher created a rare island reversal pattern, which can mark primary trend bottoms.
• Some gaps are filled, but not all of them. If the island pattern holds, the gap will not be filled, and that would be good news for gold stock investors.
• Note the “runaway” action of the RSI oscillator. The move above 50 should attract technicians who focus on momentum.
• At last, some technical lights on the gold stock highway are turning green!
GDXJ Trendline Breakout Chart
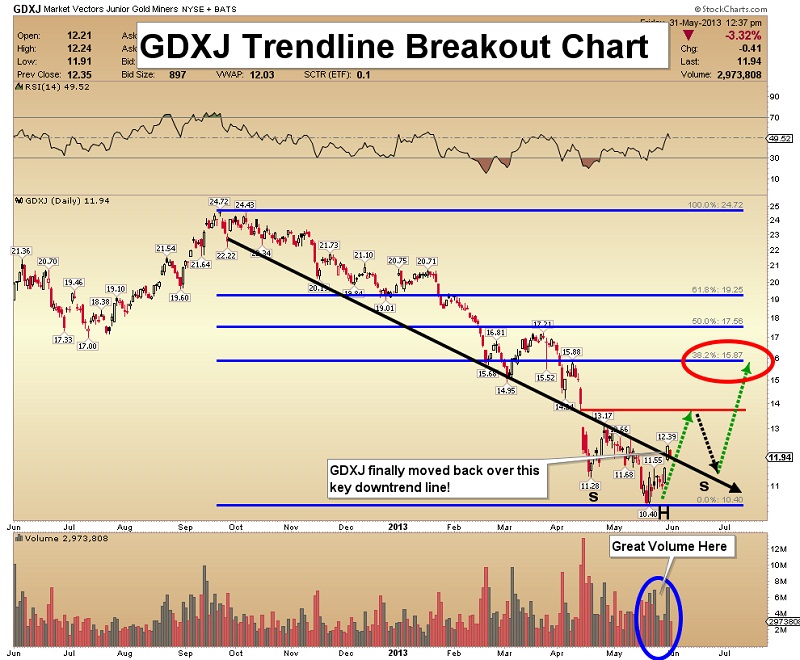
• On Thursday, GDXJ recaptured a key downtrend resistance line, and that’s very good news for junior gold stock fans.
• Note the excellent volume in play now.
• The Fibonacci retracement line at $15.87 is probably a realistic short term target price for GDXJ.
Silver Support Zone Chart
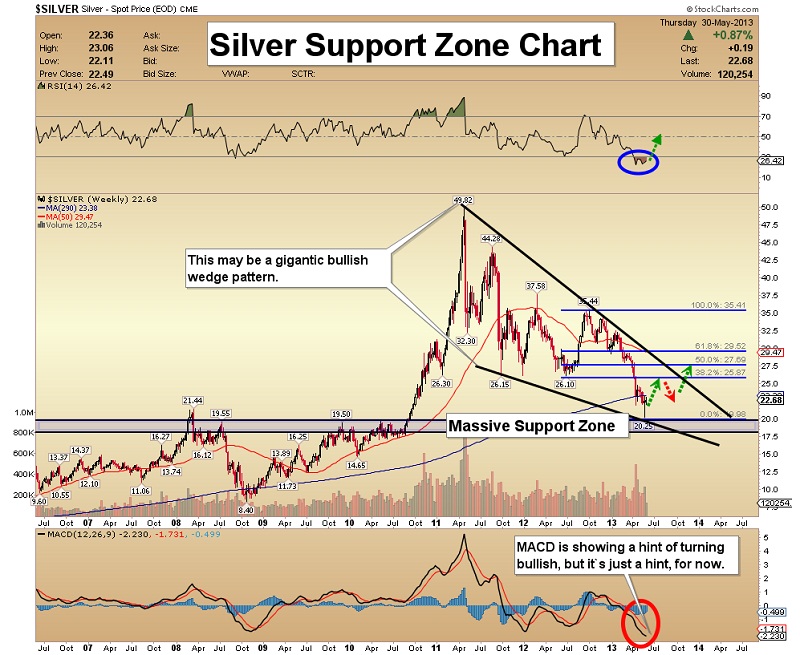
• My short term target for silver is $25.87, based on the Fibonacci retracement line in that area.
• The RSI oscillator has yet to stage a breakout over 30, which would attract momentum traders, but I think that could happen next week.
• A truly gargantuan bullish wedge pattern may be forming on this weekly chart. Note the two thick black trend lines that define this potential bullish pattern. The entire precious metals complex is performing pretty well this week, while the stock market swoons!
![]()
Unique Introduction For Gold-Eagle Readers: Send me an email to [email protected] and I'll send you 3 of my next Super Force Surge Signals, as I send them to paid subscribers, to you for free. Thank-you!
Stay alert for our Super Force alerts, sent by email to subscribers, for both the daily charts on Super Force Signals at www.superforcesignals.com and for the 60 minute charts at www.superforce60.com
About Super Force Signals:
Our Super Force signals are created thru our proprietary blend of the highest quality technical analysis and many years of successful business building. We are two business owners with excellent synergy. We understand risk and reward. Our subscribers are generally successful business owners, people like yourself with speculative funds, looking for serious management of your risk and reward in the market.
Frank Johnson: Executive Editor, Macro Risk Manager.
Morris Hubbartt: Chief Market Analyst, Trading Risk Specialist.
Super Force Signals
422 Richards Street
Vancouver, BC V6B 2Z4
Canada
share
share
share
share
share


