
Gold Technicals Suggest Dovish Tapering
 share
share
 share
share
 share
share
 share
share
 share
share
A number of bank analysts have suggested that gold could decline to $1000 in 2014. If economic reports continue to suggest growth is accelerating, the Fed might taper quite aggressively, and that could hurt gold prices.
Indian gold imports have fallen dramatically, and the government there has asked the citizens to reduce their gold purchases, for about a year.
The Indian government hasn’t just “asked” their citizens to reduce their gold imports; highly restrictive regulations have been put in place. August gold imports were only about 3 tons, which is horrific.
Over the next 12 months or so, increased demand for gold coming from China is unlikely to make up for the “bearish trilight” of reduced Indian buying, a Fed “taper caper”, and hedge fund selling.
The last economic peak was in 2007, and the Fed uses a rough eight year timeframe for the business cycle.
That suggests that even if 2014 is a good year for the economy, the current economic cycle is much closer to an end than a beginning.
Is the Fed acting a bit irresponsibly, by highlighting the slight increase in growth numbers now, while downplaying how late this growth comes in the business cycle? I think so.
It’s quite possible that 2014 goes down in history as the year gold stocks surge and gold bullion slips. Merrill Lynch is one major firm that may agree with at least the first part of my scenario. They recently issued a major buy signal for gold stocks.
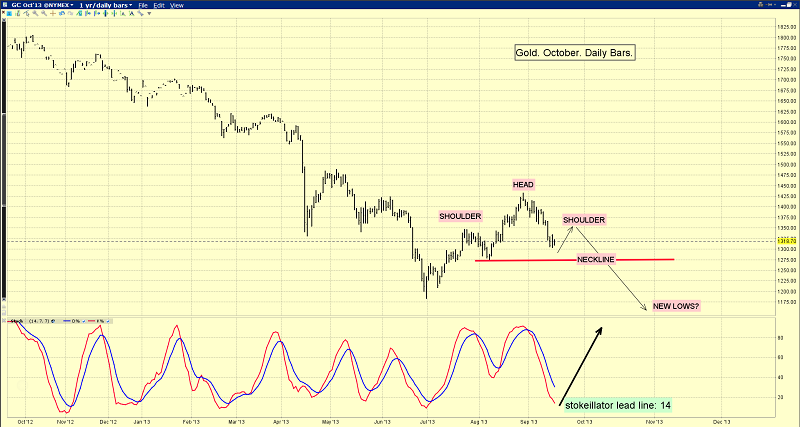
You are looking at the daily gold chart, and I’ve highlighted a bearish head & shoulders top formation.
It’s really only a potential chart pattern at this point in time, but a rally to the $1350 area from “around here” would probably get the attention of a lot of bears. If the top pattern did fully form, the lower price targets of many bank analysts in the $1000 - $1100 zone are plausible.
I’m not really a gold bull or a gold bear. Instead, I like investors to embrace gold as a key asset. Gold is wealth itself. Whether you are bullish or bearish, there are still key price areas on the “grid” that should be bought and sold.

That’s another look at the gold chart, and it’s the only one that really interests me, from the perspective of investing in gold. The price zones of $1266 and $1200 are key buy-side HSR (horizontal support & resistance) areas. Bank “algo” (algorithm) traders are highly likely to buy gold aggressively in those areas, and I think investors in the gold community should be prepared to buy a bit there too.
The price areas of $1350 and $1425 are now areas where the same bank traders (aka the “banksters”) are likely to sell gold very aggressively. The gold community should probably prepare to engage in some selling there too.
Note the position of my stokeillator (14,7,7 Stochastics series) at the bottom of that chart. The lead line is at 14, which is where many significant rallies have started from. Regardless of the outlook for 2014, gold looks good now, from a short term technical perspective.
Some analysts believe there is a correlation between full moons and changes in the short term price action of gold. The next full moon is September 19, 2013, and that’s just one day after the upcoming FOMC meeting.
If the economy improves (or is perceived to improve) in 2014, institutional investors could begin to focus on metals like platinum and palladium, due to their use in industry.
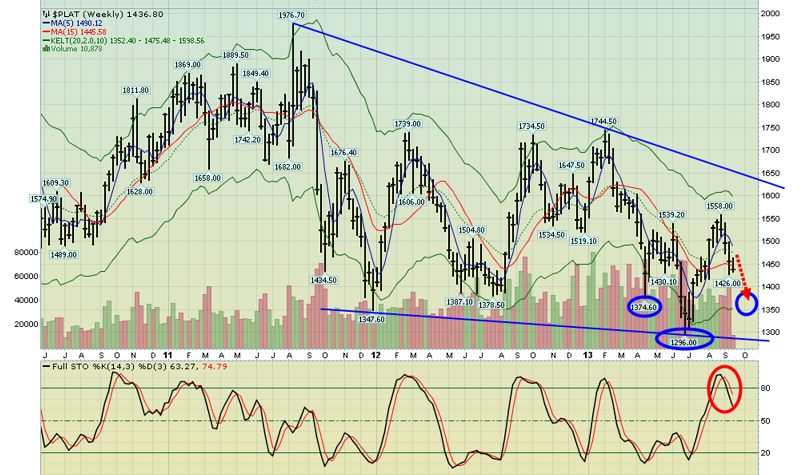
That’s the weekly chart for platinum, and I’ve highlighted an inverse head & shoulders bottom pattern that’s in play now.

You are now looking at the daily chart, and the head and shoulders pattern is very clear. Uncertainty surrounding Wednesday’s FOMC announcement could create substantial volatility in the price of platinum, perhaps taking it down to the $1375 area. My stokeillator is in the “buy zone”, and that’s good news for platinum fans!
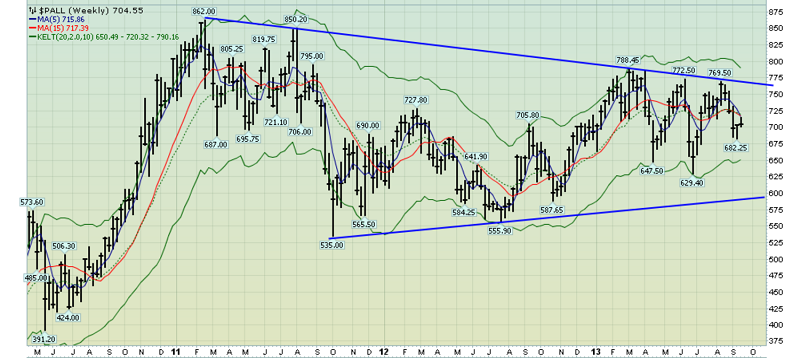
This weekly palladium chart looks very good. There’s an enormous triangle pattern in play, and an upside breakout above $800 targets the $1100 area.
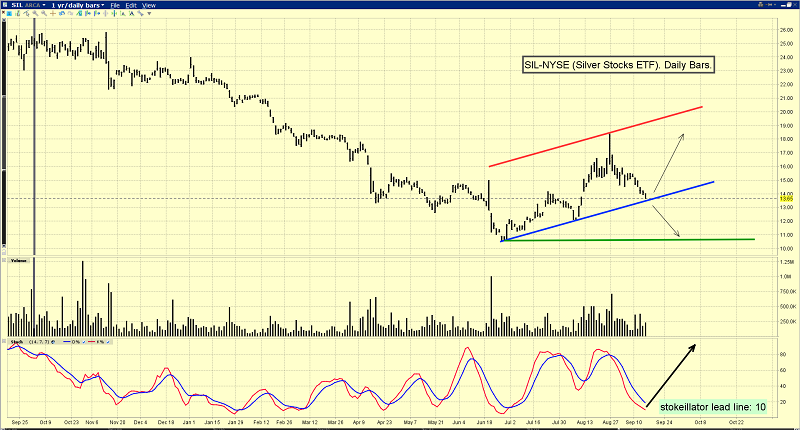
I’m a fairly aggressive buyer of silver stocks in this price area. You are looking at the daily chart for SIL, a silver stock ETF. SIL is arguably the silver community’s equivalent of GDX in the gold community. Note the blue uptrend line, and the position of the stokeillator. It’s possible that a bearish FOMC announcement drives SIL down to the green HSR line in the $10.50 area.
Regardless, I’m placing risk capital based on a scenario where the Fed announces a dovish taper, and then gold & silver stocks begin a strong rally.
The top analysts at Goldman Sachs may have the same view I do. ‘“Our U.S. economists’ expectations for a ‘dovish’ taper and gold’s recent decline will likely limit the downside to gold prices,” Goldman analysts Damien Courvalin and Jeffrey Currie said in a report dated yesterday.’ – Bloomberg News, September 17, 2013.
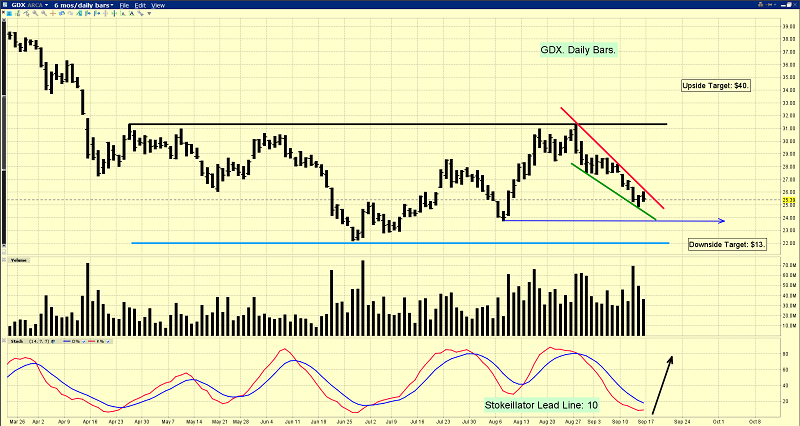
That’s my “chart of the month”. You are looking at the GDX daily chart, and the technical set-up is excellent. There’s a bullish wedge forming. Watch for a breakout above the red downtrend line, accompanied by a crossover buy signal on my stokeillator. Bullish action in gold stocks seems very near, and almost here!
********
Special Offer For Gold-Eagle readers: Send me an Email to [email protected] and I’ll send you my free “Four On The Floor” report. If I could only own 2 senior gold stocks and 2 junior gold stocks, I’ll show you my top picks, and the tactics I’d use for each of them!
Note: We are privacy oriented. We accept cheques. And credit cards thru PayPal only on our website. For your protection. We don’t see your credit card information. Only PayPal does. They pay us. Minus their fee. PayPal is a highly reputable company. Owned by Ebay. With about 160 million accounts worldwide.
Email: [email protected]
To pay by cheque, make cheque payable to “Stewart Thomson”
Mail to:
Stewart Thomson / 1276 Lakeview Drive / Oakville, Ontario L6H 2M8 Canada
Risks, Disclaimers, Legal
Stewart Thomson is no longer an investment advisor. The information provided by Stewart and Graceland Updates is for general information purposes only. Before taking any action on any investment, it is imperative that you consult with multiple properly licensed, experienced and qualifed investment advisors and get numerous opinions before taking any action. Your minimum risk on any investment in the world is: 100% loss of all your money. You may be taking or preparing to take leveraged positions in investments and not know it, exposing yourself to unlimited risks. This is highly concerning if you are an investor in any derivatives products. There is an approx $700 trillion OTC Derivatives Iceberg with a tiny portion written off officially. The bottom line:
Are You Prepared?
share
share
share
share
share
 Stewart Thomson is president of Graceland Investment Management (Cayman) Ltd. Stewart was a very good English literature student, which helped him develop a unique way of communicating his investment ideas. He developed the “PGEN”, which is a unique capital allocation program. It is designed to allow investors of any size to mimic the action of the banks. Stewart owns GU Trader, which is a unique gold futures/ETF trading service, which closes out all trades by 5pm each day. High net worth individuals around the world follow Stewart on a daily basis. Website: www.gracelandupdates.com.


