Gold's Choppy Price Action - U.S. Stocks Topping
 share
share
 share
share
 share
share
 share
share
 share
share

Last week's trading saw gold forming its low in Monday's session, here doing so with the tag of the 1800.80 figure. From there, a sharp rally was seen into later in the week, with the metal running all the way up to a Thursday peak of 1874.60 - before backing off the same into Friday.
Gold's Choppy Action
For the coming months, gold is likely to continue with the overall choppy action, due to the configuration of the 154 and 310-day cycles that we track. That is, the 154-day wave is deemed to have bottomed back in late-November - and with that is seen as heading higher off the same:
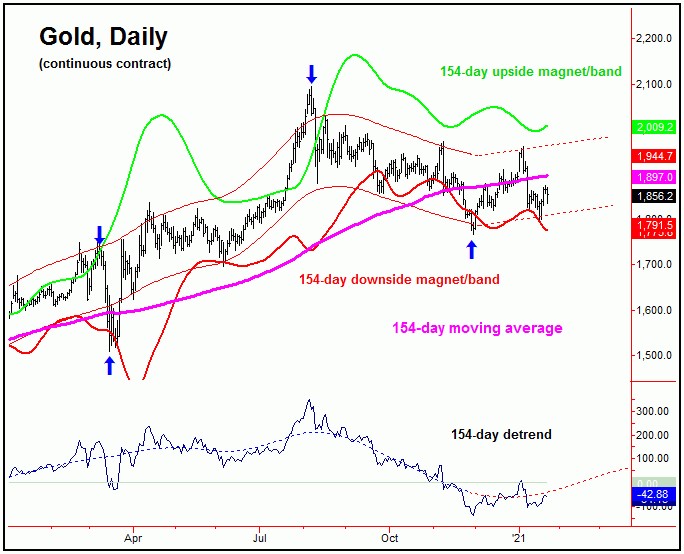
On the chart above, of key note is that our 154-day cycle channel (shown in dashed red) is shown as flattening to slightly higher. In terms of price, our ideal path is looking for a push up to the upper 154-day cycle band into February/March - which is shown in bright green. This is simply due to the fact that this band will act as a magnet to approximately 90% of the upward phases of this particular wave.
On the flip side to the above, holding back the expected upside into February is the larger 310-day wave, which is seen as pointing south into April:

In terms of price, since a cycle will revert back to a moving average of the same length better than 85% of the time, the 310-day moving average will likely act as the eventual downside price magnet as this wave next bottoms. On the chart above, we can see this moving average is currently at the 1777 figure - but which is also rising daily.
In terms of time, as mentioned, the next projected trough for the 310-day wave is due around early April, but with a decent plus or minus variance in either direction - due to the size of this cycle. Thus, with the 154-day cycle pushing higher into February - but with the larger 310-day wave pushing lower into April - this will make for continued choppy action going forward, at least until the low for the larger 310-day wave is complete.
For the bigger picture, once the 310-day wave does bottom out, we expect to see the largest percentage rally of 2021 playing out in the months to follow, with the upper 310-day cycle band acting as the magnet. Going further, as mentioned in past months, we also have an open upside target with a larger four-year cycle that we track, which is to the 2212.00 - 2340.56 region for gold - which we expect to be met at some point going forward, likely on the next upward phase of this same 310-day component.
U.S. Stocks Topping Out
As mentioned last weekend, the U.S. stock market - as measured by the S&P 500 index (or 'SPX') is bracing for the first good correction phase of 2021. With the action seen into last week, the index managed to make a marginal new high in price - which was forecast to occur in our daily Market Turns report.
In terms of time, our last projected low date for the SPX was noted for January 18th, plus or minus a day in either direction - with that low coming in on January 15th, and doing so with the tag of the 3749.62 figure. We mentioned that the patterns favored that decline to end up as a countertrend affair, to be followed by higher highs on the next swing up into later in the month - some of which was obviously seen with the action into last week.
With the above said and noted, the higher highs that are now being seen look to be running on borrowed time, primarily due to the configuration of the 90-day cycle that we track, and which is shown on the chart below:

In terms of time, this 90-day wave is next projected to trough around the late-February timeframe, but with a decent plus or minus variance in either direction. Since this is only about a month away, the SPX is bracing for what should be a fairly sharp correction in the coming weeks, though that decline has yet to be confirmed in force - with the exact downside reversal levels noted in our Market Turns report.
As for the expected downside, since - as mentioned earlier - a cycle will revert back to a moving average of the same length, the 70-day moving average is our ideal price magnet. Noted that I am using the 70-day average as the magnet here, due to the fact that this 90-day component has been averaging closer to 72-74 trading days from trough-to-trough, in more recent rotations.
Having said the above, I do see the decent potential for additional follow-through below our 70-day moving average, due to other technical factors, such as our diverging Mid-Term Breadth index, which is shown again on the chart below:
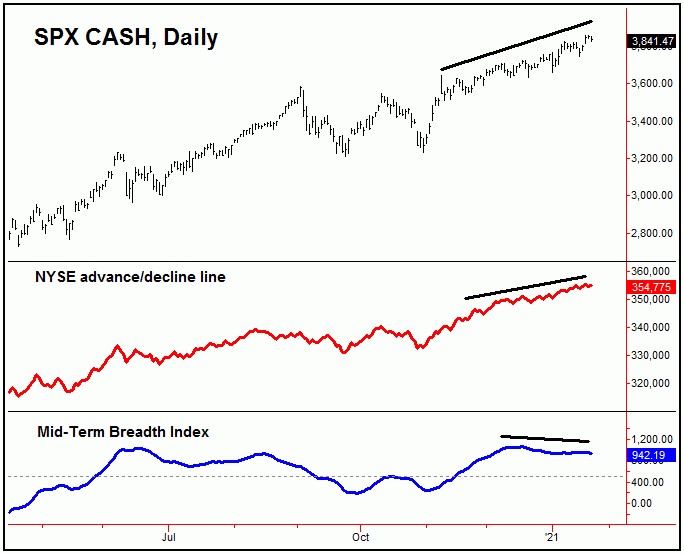
The chart above shows our Mid-Term Breadth index in the lowest panel (in blue), which has been diverging from price action in recent weeks - which is a pattern we might expect to see as a cycle such as the 90-day wave is topping out.
Having said the above, the net positive take-away for the longer-term view is that the NYSE advance/decline line - shown in the upper-pane in red - has yet to form any major divergence, and with that is continuing to confirm the larger uptrend. With that, this tells us to expect the next downward phase of the 90-day cycle - once in force - to end up as a countertrend affair, to be followed by higher highs on the next upward phase into what we see as late-Spring of this year. Stay tuned.
Jim Curry
The Gold Wave Trader
http://goldwavetrader.com/
http://cyclewave.homestead.com/
share
share
share
share
share
More from Gold-Eagle


