
Has Gold Bottomed Or Will 2015 Be The Year?
 share
share
 share
share
 share
share
 share
share
 share
share
NEWS- We have the non-farm payroll numbers this Friday, it appears the Fed may push back raising interest rates for now. We could see volatility in all markets depending on Fed comments. I expect gold to finish its correction this week and begin another move up.
---
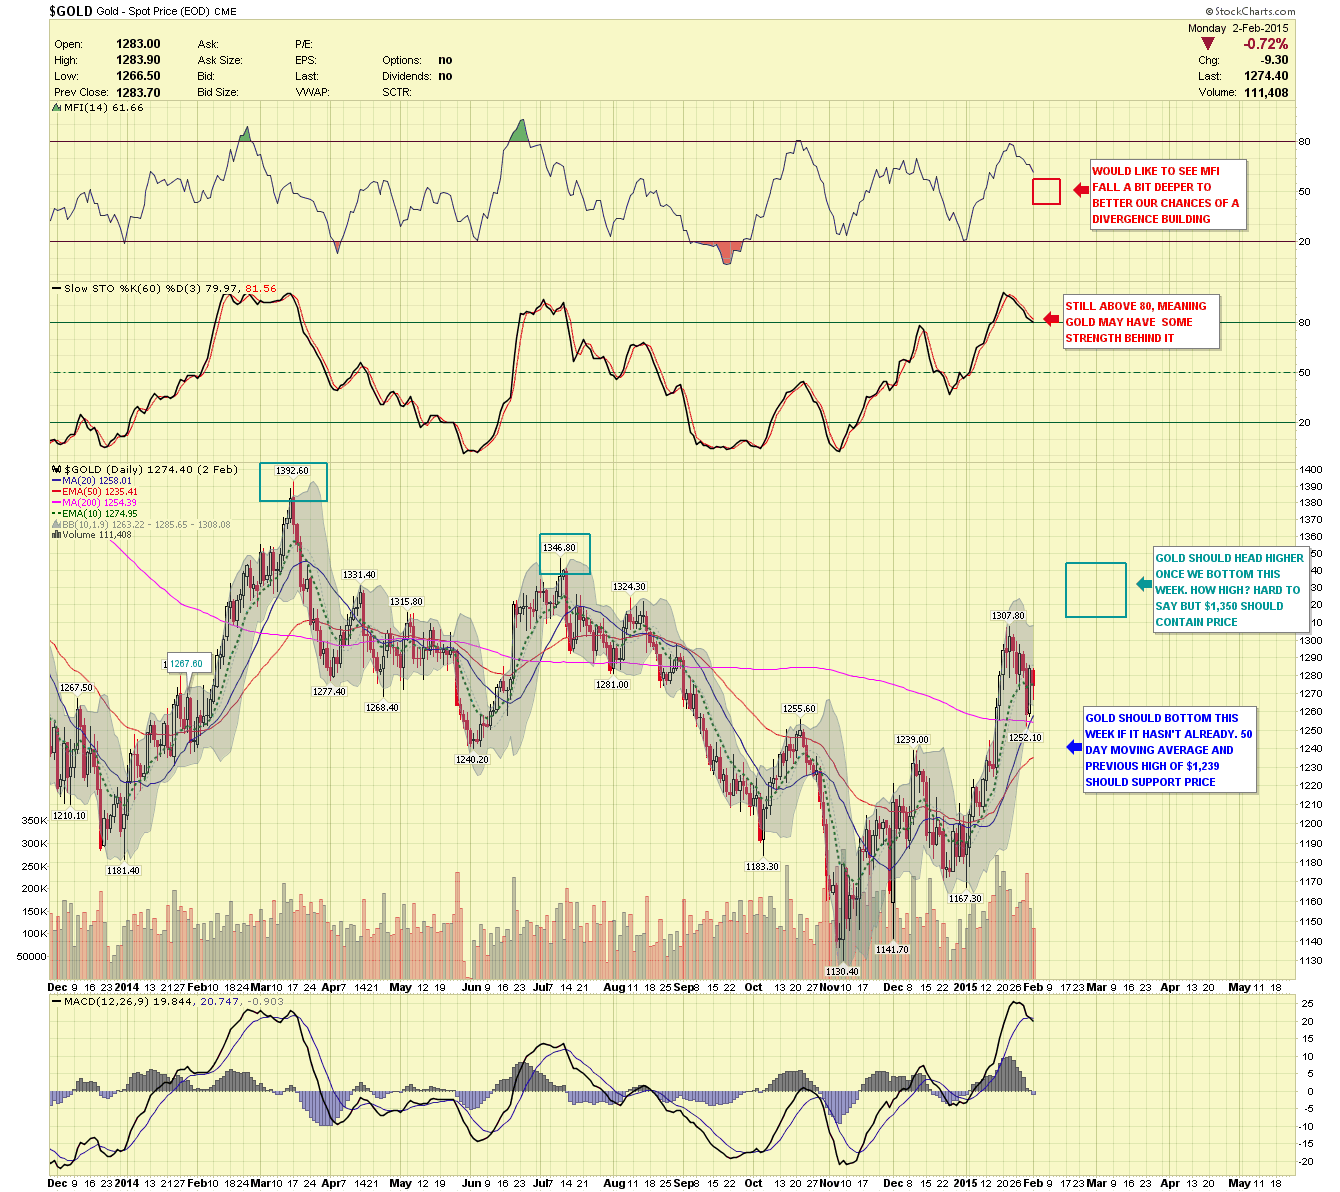
GOLD DAILY- As the below chart describes we should end the gold correction this week. Good support around the $1,240 level. Once we start heading higher, I will start looking for signs of a top. No divergences to note in the indicators at the moment.
GOLD WEEKLY- The weekly chart still hasn't changed. If I'm correct, we should have a significant top in the next month or two. I believe there will be one more washout phase before this correction that began in 2011 will be over. Remember, gold was up every year, for 12 years in a row, to correct that long of a move may take a while.
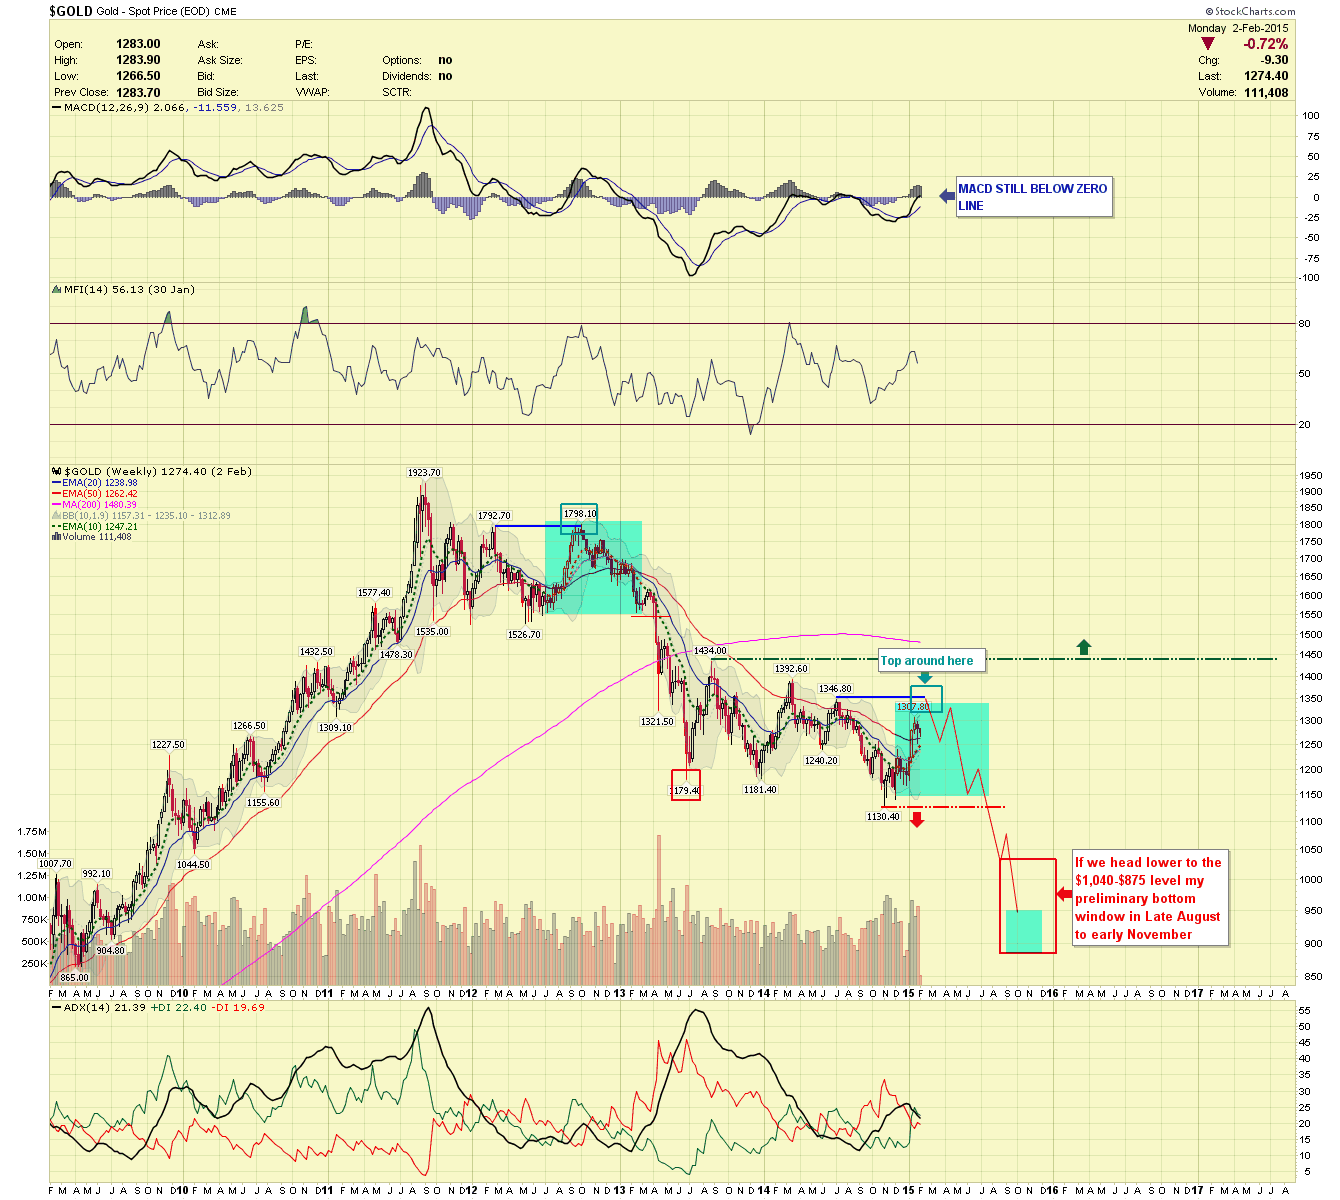
Note: The 1970's gold bull market had a long correction from December 1974 through September 1976. That correction lasted 1/3 of the preceding move up that started in 1970. If we apply the same time parameters to this gold market, we should have a bottom in Late August to early November 2015, which would be 1/3 of the 12 year move that started in 1999.
SILVER MONTHLY- Silver was unable to close January above the blue line. I still have a target around $12-$10 for silver, at those prices silver would be remarkably cheap in my opinion.

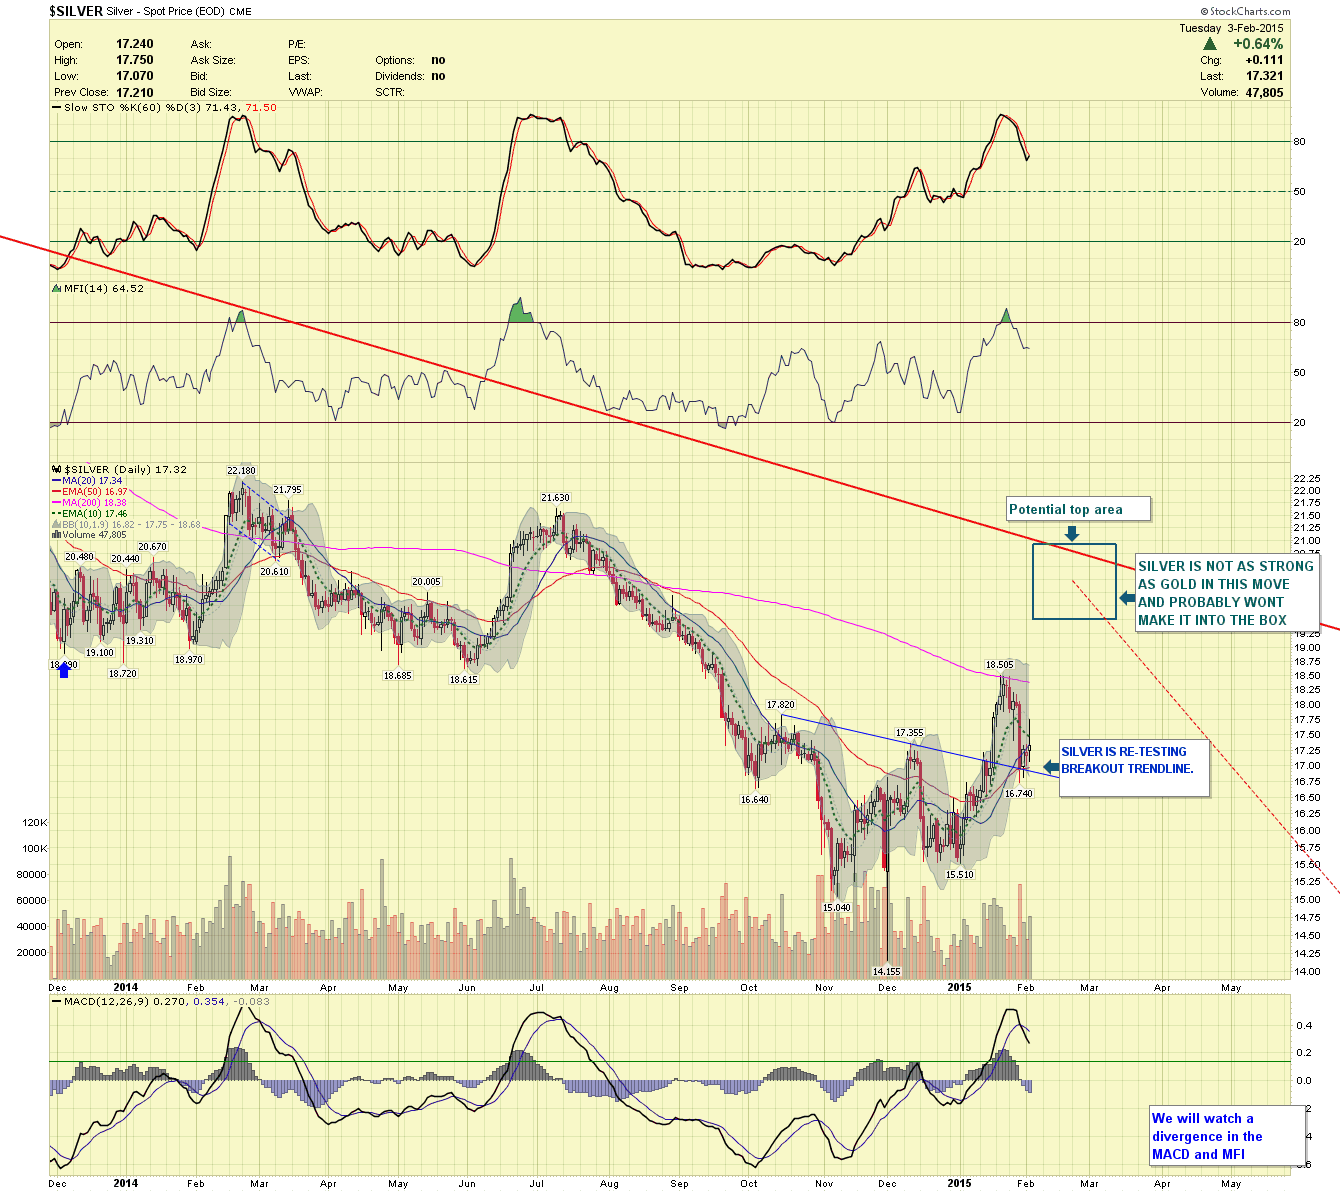
SILVER DAILY- Silver currently is finding support at the 20/50 moving averages and the trend line from which it recently broke through. To me it appears to be weaker than gold and May not make it up into the green box. Regardless, we patiently wait for signs of a top.
GDX DAILY- GDX is showing resilience during this correction as it hasn't corrected very deep at all, this is a sign of underlying strength I'll need to monitor. If price takes one more dip this week, it should hold the $20.50-$20.00 level. Remember, this is non-farm payroll week and things can get a little silly in the markets.

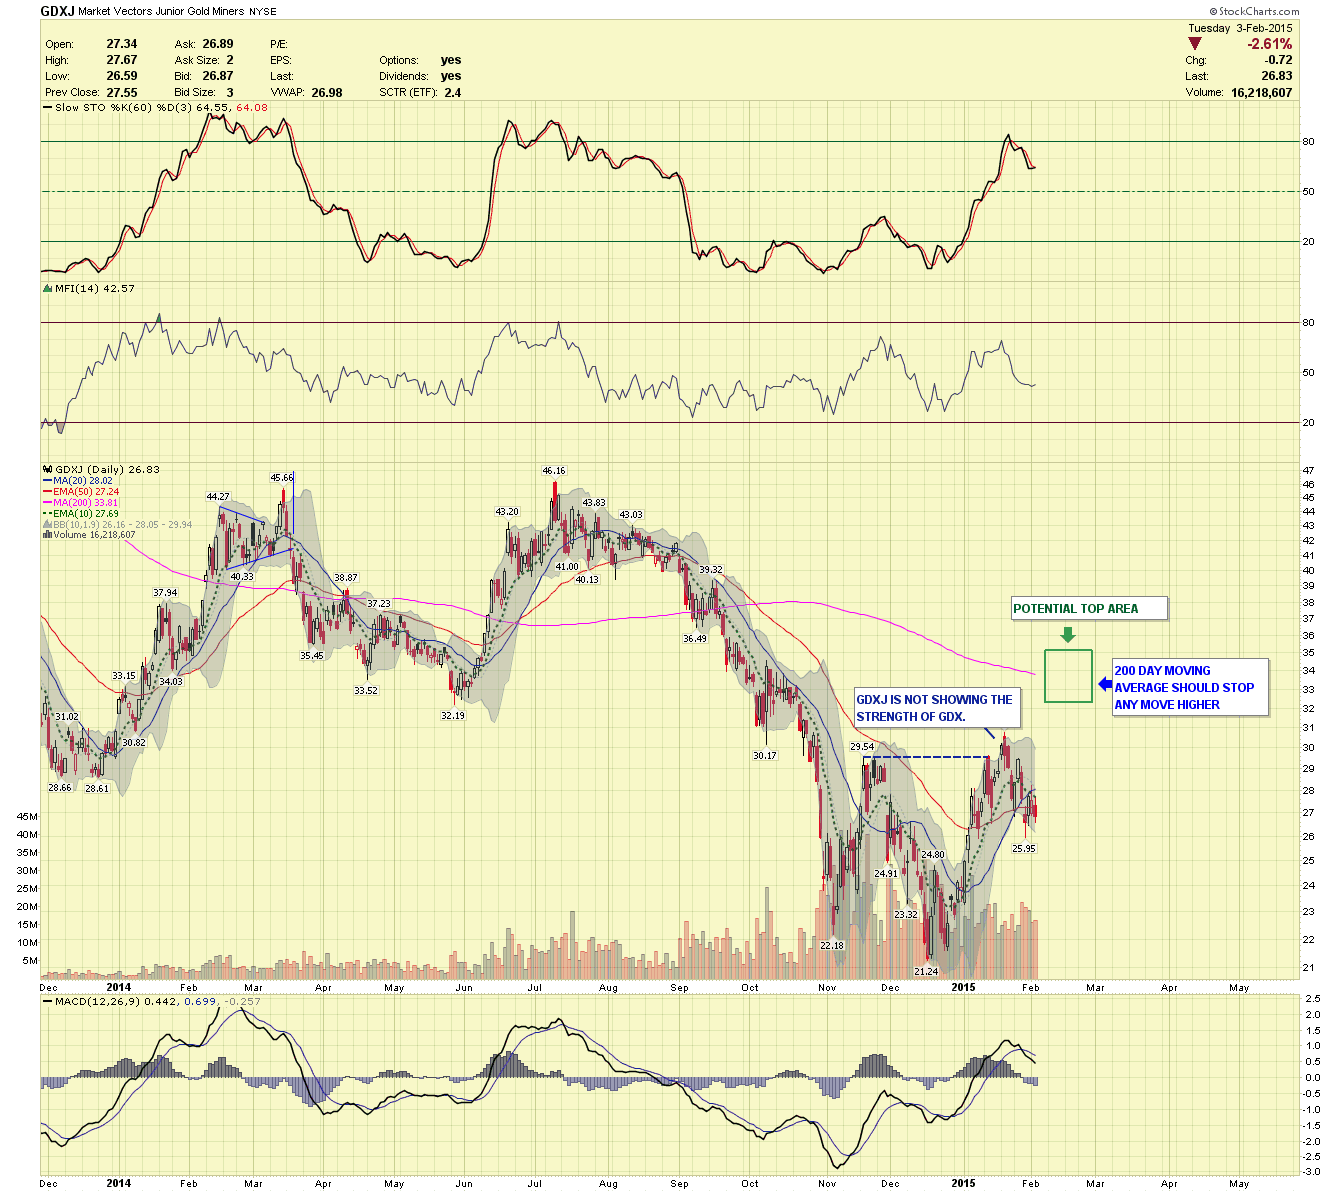
GDXJ- GDXJ is not showing the strength I would like to see. Usually miners lead gold and GDXJ leads GDX. Its relative weakness is why I'm leaning towards this whole move that started in December as just a correction, meaning the temporary bear market may continue. Now, if GDXJ explodes higher and outperforms both GOLD and GDX then I will change my mind but until then I will look lower.
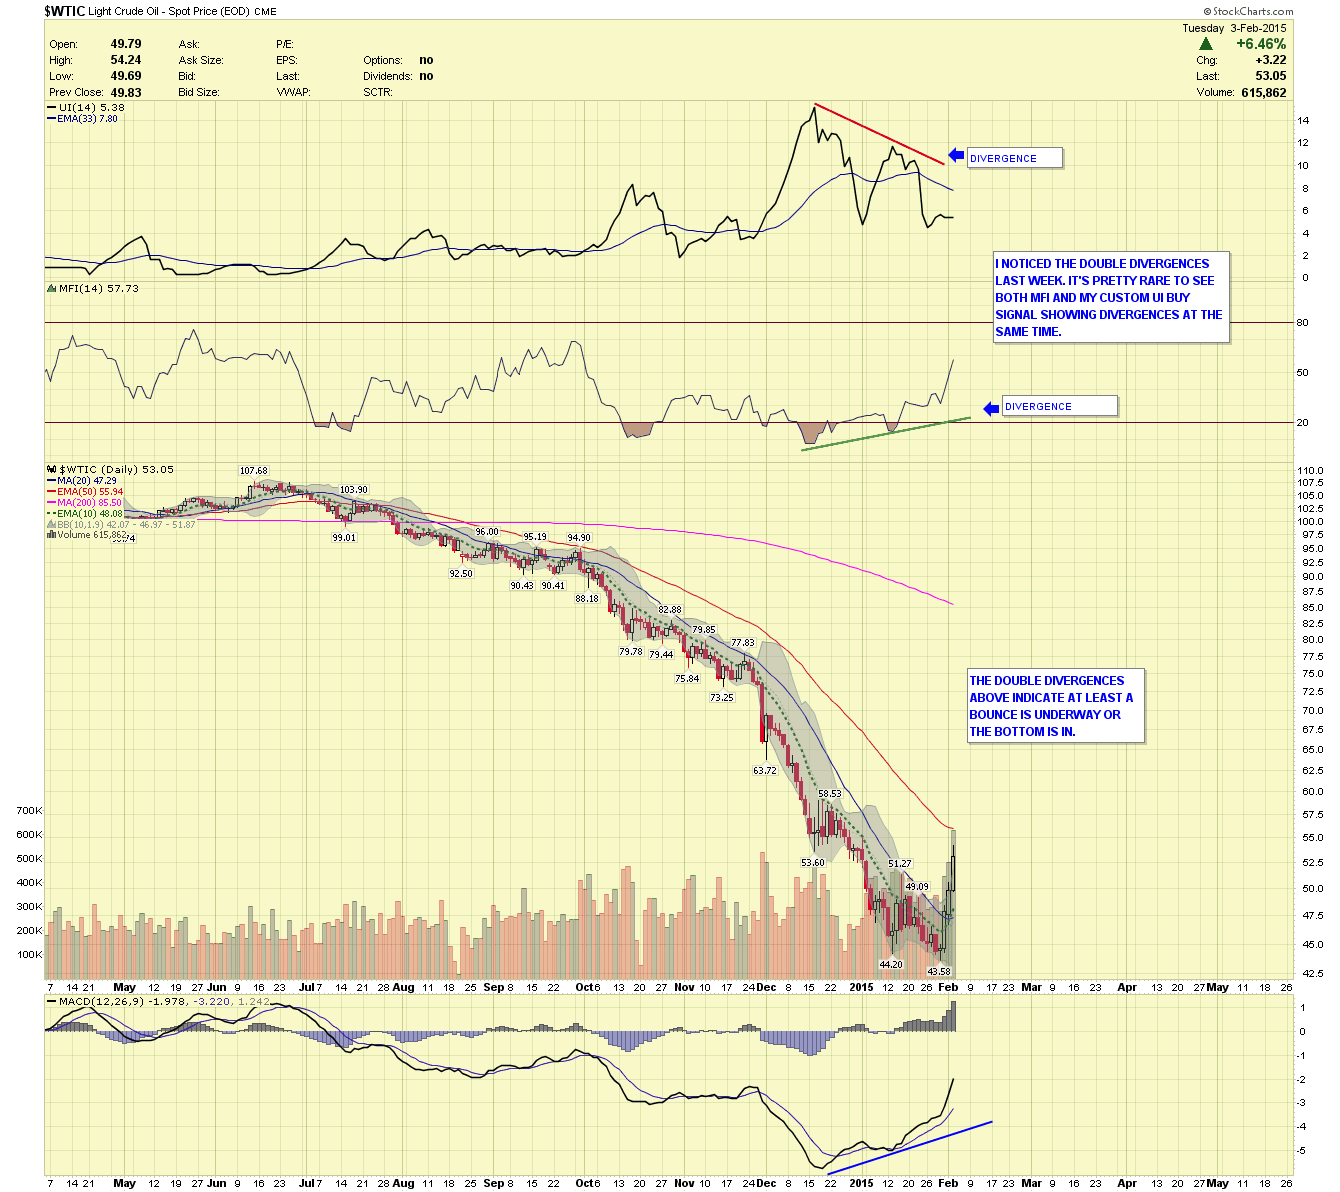
OIL- I wanted to show the WTIC chart with two divergences at the top. Divergences indicates underlying weakness in a particular move and that a bounce, bottom or top in nearing. I made a custom indicator that when combined with the common MFI shows a potential trend change. Even though I noticed the divergences, between the strength of the move down and the political manipulation, I chose not to take a position.
Now we wait, it's hard doing nothing at times but it feels better than being on the wrong side of the trade.
********
Courtesy of http://www.chartseek.com/
share
share
share
share
share


