
Long-Term Precious Metals Charts
 share
share
 share
share
 share
share
 share
share
 share
share
Stocks suffered a very choppy weak as we enter the seasonally 6-8 week weak stretch.
I’m expecting lots of volatility with a few trades. Moreover, I’ll also be looking for dip buys when they come. However, we may not see a nice trend higher until November or later.
We’ve had a great summer trading - and we should have another nice run into years end. The metals are showing weakness but shouldn’t fall too far. I show long-term charts to give the long view. Let’s kick it off with the 20 years monthly gold chart.
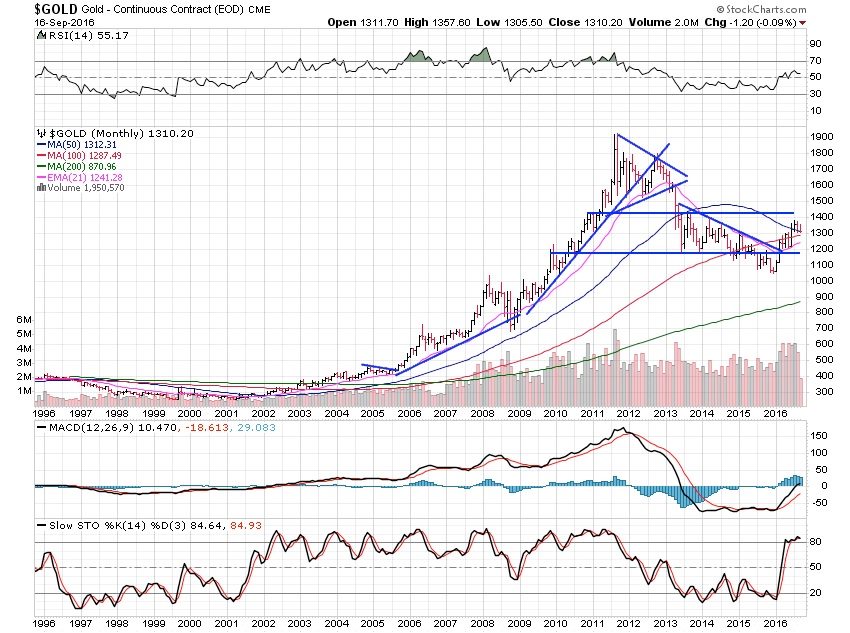
The 20 year monthly chart of gold clearly shows this new bull market/uptrend has begun.
After the large triangle broke at $1,600 back in 2012, we’ve been in a weak market. I sold most of my gold at the $1,680 area at the time – however, I should have done much better.
The $1,180 pivot area has now drawn gold back above it. Consequently, we’re slowly heading higher and higher for at least the next three years.
The day to day gyrations can be fun to play, but the dominant trend is up.
This is really quite a pretty chart for what looks like will end up being a near 20 year secular bull market with a nice four or so years in consolidation.
Now we’re setting up the right side of this pattern - and that can take a couple years before we see the major breakout into new highs. Patience and buy the dips with the long view in mind is what this chart is telling me to do.
I don’t really care about GATA, manipulation claims, or any other type of news. I care about the chart…and it tells me we’ve got lots more upside.
Years ago, I’d spend hours a day reading news and theories about gold and companies…and it just clouded my view. Now, I have lots of time to peruse charts, find leading stocks and sectors, live life and spend more time away from the computer.
Being able to interpret charts is the best way I’ve found to find to make hay in the markets.

Silver is also turning up off major support at the $15 area - and is now setting up to break $20 and make the slow move up to $27.50 where major resistance sits. This chart pattern is going to be one for the record books when it’s setup to break into new highs above $50. This is a long view trade as well.
There will always be times to trade around core holdings in the metals, but the trend is up and should be for years to come.
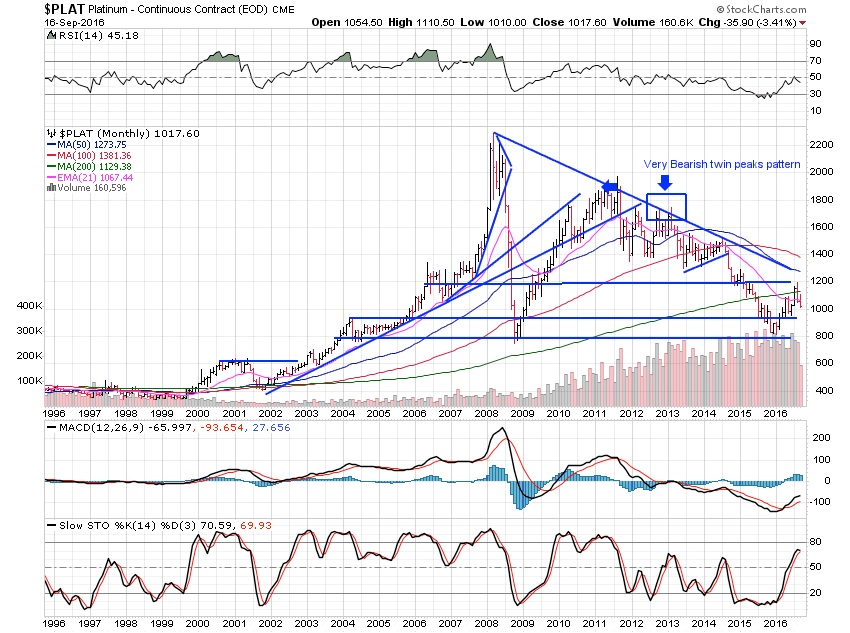
The long-term platinum chart doesn’t scream major trend change to up yet…but it always follows gold and silver so it should be fine. I’d have to see it get back above the major downtrend line and 50 month moving average at $1,275 and we should see that relatively early in 2017. Notice the very bearish twin peaks pattern after a major high area.
You don’t see those too often and this may be the first time I’ve noticed that in this chart…but I’ve always got an eye out for it, as well as many other patterns, day counts, Fibonacci retracement sometimes as well, moving averages and a few other things.

Palladium held the $500 area well -- and has turned up and formed a nice “U” pattern here, which should be good for a move to $850 where we will need consolidation.
Once we setup and break above $850, we should really begin to see this metal accelerate higher.
********
Thank you very much for reading and you can find out more about what I do for members as we focus on leading stocks for the most part at http://wizzentrading.com
In my free, nearly weekly newsletter I include many links and charts which cannot always be viewed through sites which publish my work. If you are having difficulties viewing them please sign up in the right margin for free at www.wizzentrading.com or send an email to [email protected] with “subscribe” as the subject and receive the newsletter directly in your inbox, links and all. If you would like to subscribe and see what my portfolio consists of please see here.
If you found this information useful, or informative please pass it on to your friends or family.
Free Service
The free weekly newsletter “Wizzen Trading” does not purport to be a financial recommendation service, nor do we profess to be a professional advisement service. Any action taken as a result of reading “Wizzen Trading” is solely the responsibility of the reader. We recommend seeking professional financial advice and performing your own due diligence before acting on any information received through “Wizzen Trading.”
share
share
share
share
share


