
Many Fingers In The Pie
 share
share
 share
share
 share
share
 share
share
 share
share
There now can be no doubt that there are activities going on that are not normal market behaviour. However, attempts to slant various market prices in a direction that could influence the voting in the coming election. Two of the most glaring examples of this behaviour is on Wall Street and with respect to gold and silver – the latter in particular. Wall Street is not allowed to turn even slightly bearish, while silver gets whacked very hard whenever it begins to grow horns. While the intervention is no longer a matter of ‘If’, only ‘How Much’, the question whether the manipulation of these and other markets can last long enough to continue into early November has no easy answer. Without some breaking news that, for example, would show Trump is right – the US economy is in trouble, even shrinking – while the official view that all is well and growth is just a little slow is empty spin, at best, the odds favour the deep pockets supporting of the intervention.
The only sign that just perhaps something could happen to remove the blinkers off the eyes of all Americans, revealing what is really happening in the economy, is the recent weakness in the US dollar. A strong dollar is one of the pillars in a campaign to present such a glowing picture of the US that voters would favour the status quo that would have another Clinton in a Democratic White House. As political infighting becomes even more intense in the final stretch to November, official and unofficial tactics on both sides become more blatantly dirty – and the battle more uneven.
Clinton has the might, influence and funds of the large financial institutions behind her as well as the mass media these forces control. In addition, there are influential factions within the GOP who are scared of Trump and are working to undermine the support he could expect to receive from the party. Very powerful support. However, on the other hand, a large number of voters know first hand they live in ever worse poverty despite the supposedly improving economy and that they are powerless to change their situation. Trump’s successes in gaining their support is proof that they are beginning to realise it is no fault of their own that they are excluded from the benefits of the ‘improving economy’. These are not all Republican supporters, but many Democrats may well vote for Trump out of their increasing desperation.
There is little to say about gold and silver. Perhaps they will resume their respective bull markets once the dollar sinks low enough. Apparently, Russia and China have started moves to reduce or even eliminate restrictions from the dollar-friendly IMF and World Bank. If so, they are to be free of various links to dollar that determine aspects of their domestic monetary policies. The result should be less demand for dollars, which would have knock-on effects on US markets. That, in combination with more bullish influences on the precious metals out of Shanghai, may hamper attempts to influence the coming election in favour of the status quo.
The rivers of politics – national and international – run deep; there are dangerous under-currents with no ripples appearing on the surface. Be prepared for surprises.
Euro-Dollar
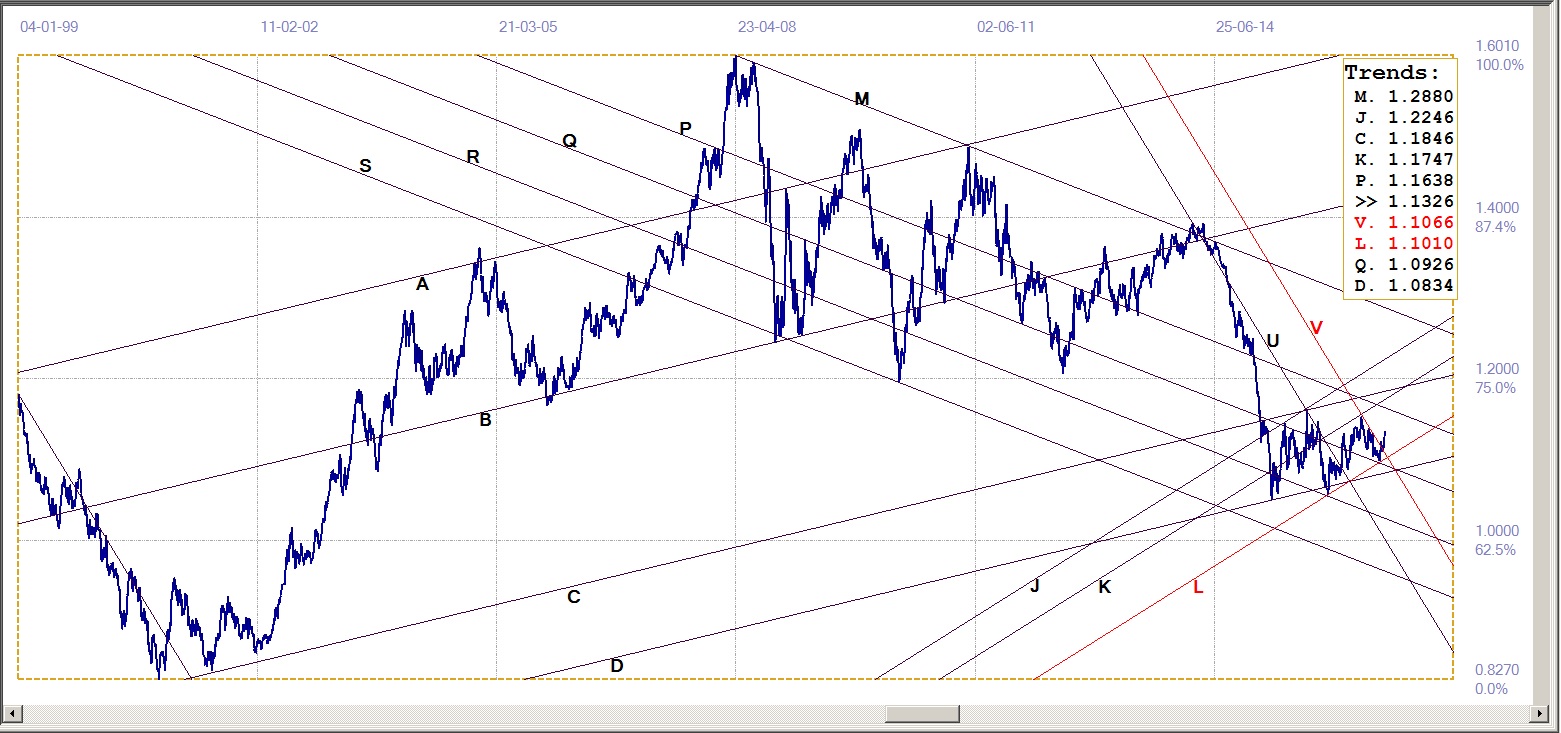
Euro-Dollar, last = $1.1326 (www.investing.com )
The rebound higher off support, at line L ($1.1010) broke clear above bear channel UV ($1.1066) to give a bullish signal. The new trend higher has to extend higher, to perhaps test resistance at line P ($1.1638), to confirm the trend.
DJIA
The monthly chart of the DJIA and the long term daily chart of the SP500 recently reached major chart resistance. In both cases the chart patterns had their origins at a very early time – before 1929 for the DJIA and in the early 1950s for the SP500. It has been amply illustrated over a period of study that exceeds three decades that an unexpected or abnormal break from a major chart pattern either results from an event that could qualify as a (small) black swan or is the result of intervention by a force from other than the players who are committed to the market.
In early 1996 such a bearish break from the gold chart, when a triangle had started on leg 5 of the triangle preparatory to breaking higher, could be ascribed to a new practice by central banks to lease gold at 0.5% (then a VERY low rate!!) to bullion banks so they could sell the gold and invest the proceeds at 7% (which at that time was the yield on the US 30 year treasury bonds!).
This time around, the extended breaks above 17900 at month end for the DJIA and above 2175 for the SP500 offer technical proof that the new rallies are not normal market action, but a result of intervention – to last while channel KL (18379) holds.
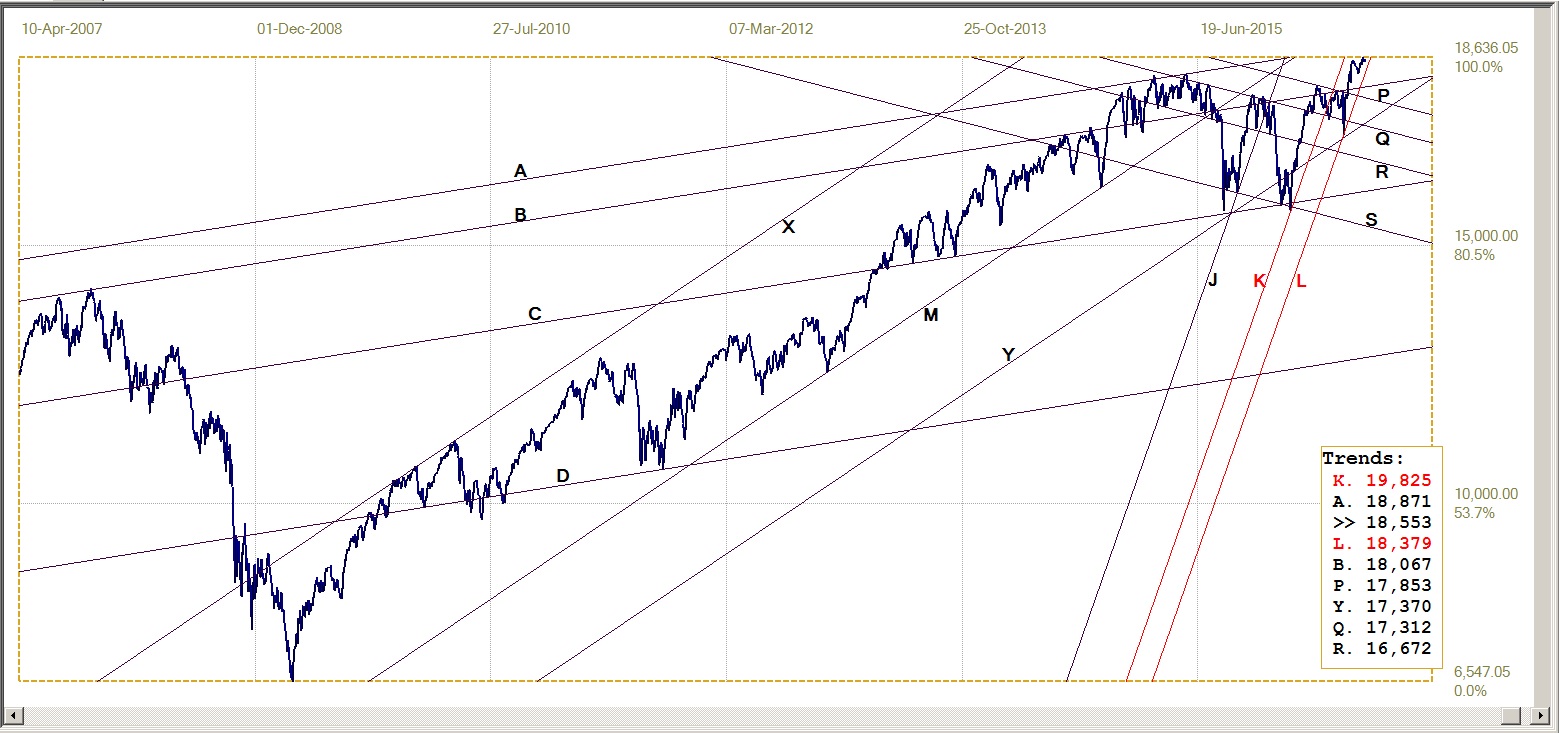
DJIA, last = 18576.47 (money.cnn.com)
Gold PM Fix - Dollars
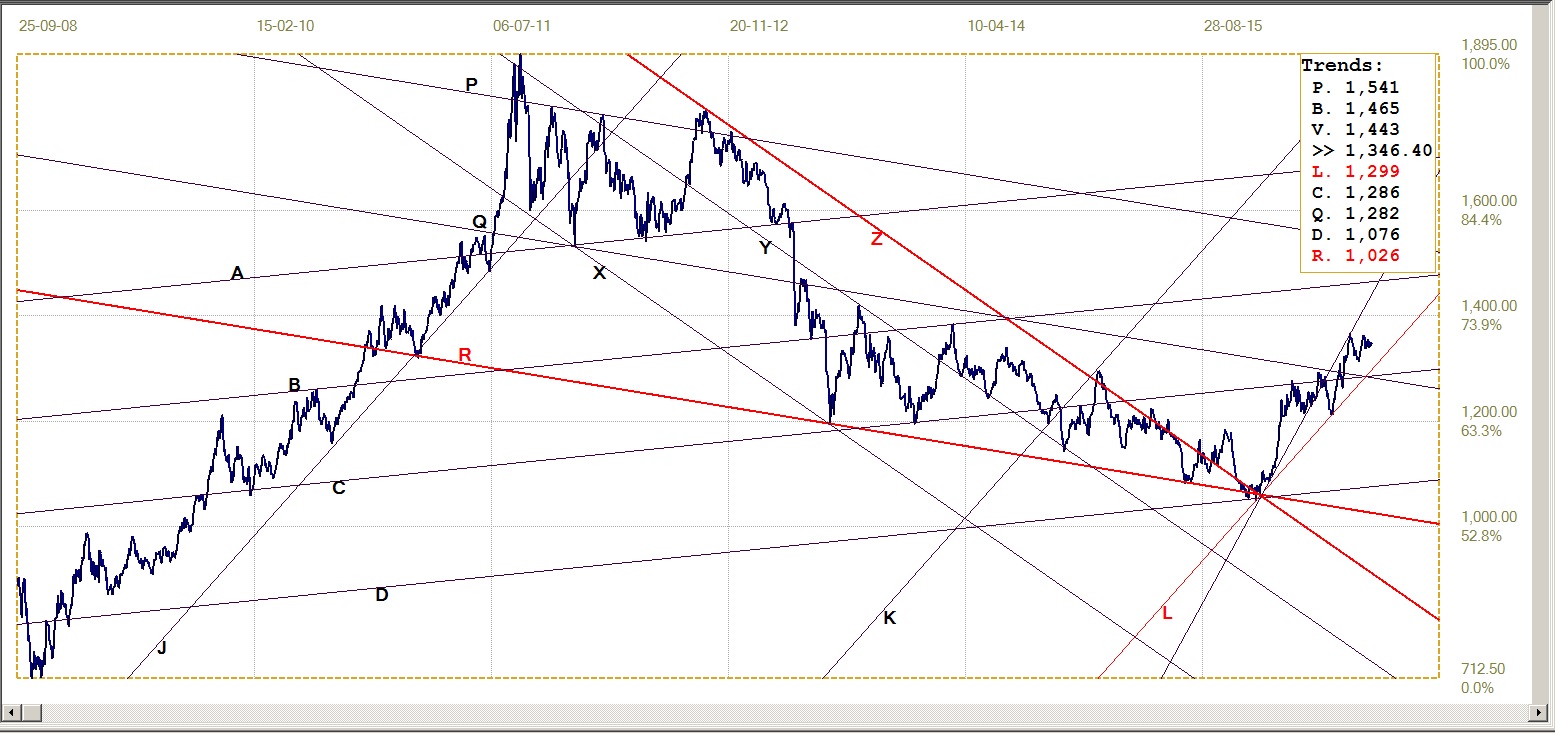
Gold price – London PM Fix, last = $1346.40 (www.kitco.com )
The gold rally off support at line L ($1299) managed to break above resistance at lines C ($1286) and Q ($1282), but then failed to break back above line V ($1443), lower boundary of the previous and steeper bull channel. That was when strong selling halted the gold rally and has it going mostly sideways after a brief dip. This is good news under the circumstances, as the frequent waterfall events show that a sustained effort is under way to depress the price of gold or – at least – prevent it from making new recent highs.
While a recovery back above resistance at line V would be good news to gold bulls, it is still a good performance while the support at line L holds – even if it means the slower trend will require more time to reach resistance at line B ($1465). All long term gold bulls developed a capacity for patience, else they would be long gone!
Gold PM Fix – Euro-Gold
Following the sharp if brief break above line R (€1207), the dollar price of gold and the value of the euro maintained good enough balance to keep the euro gold price near to that support line. Until last week, when the stronger euro and steady gold price had the euro price of gold breaking below line R.
This has a bearish bias now, but there is support at line W (€1180) and specifically line L (€1145), which have to be penetrated before the bear can take over. It all now depends on the gold price to resume its trend higher.

Euro Gold Price – PM Fix in Euro, last = €1189.4 (www.kitco.com)
Silver Daily Fix Chart
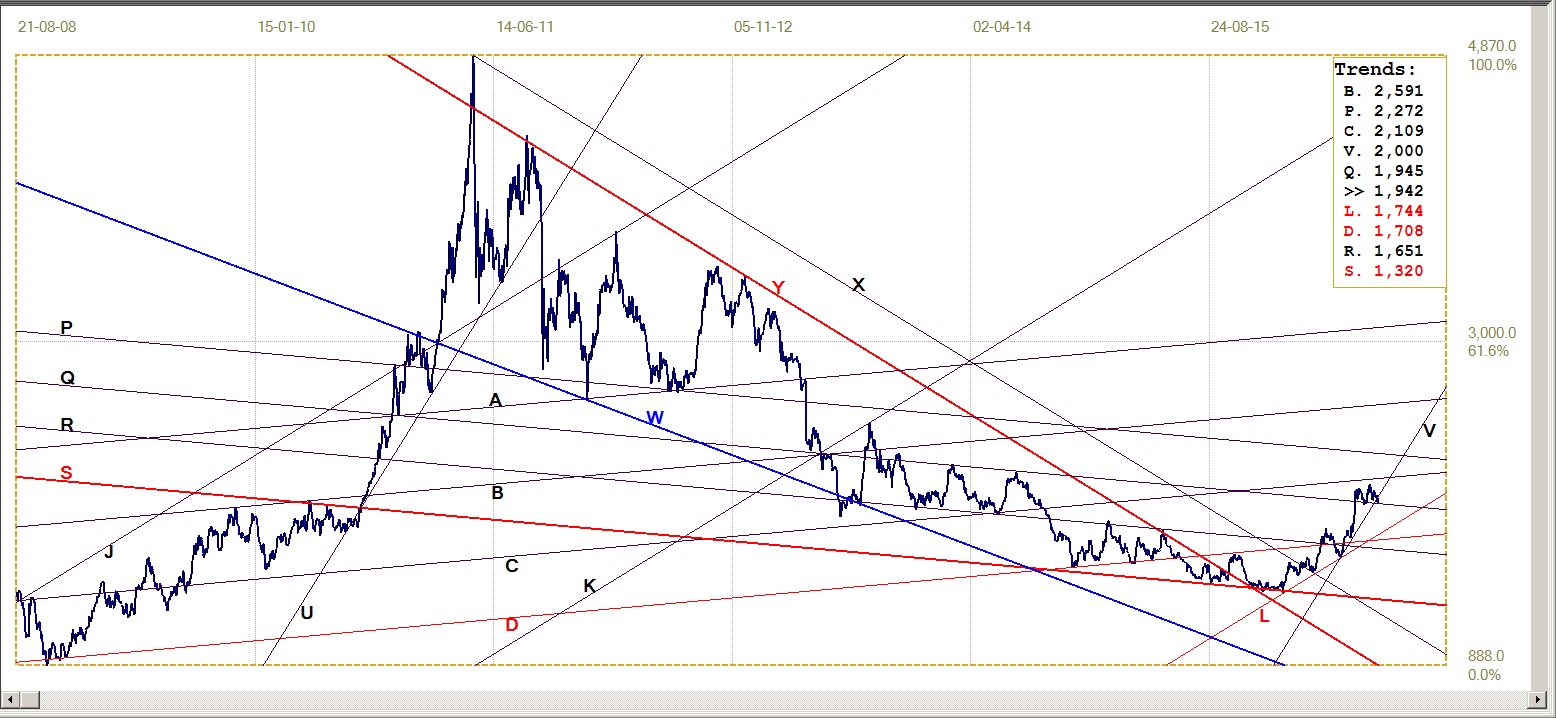
Silver Daily Fix, last = $19.415 (www.kitco.com )
When the strong psychological support at the $20/oz price (in terms of the daily London fix), gave way under the relentless selling pressure last week, the price at the London fix tumbled lower to be fixed at just above $19.40 on Friday.
This was sufficient to take the price lower at line V ($20.00) to rest just on support at line Q ($19.45). Limited and very brief breaks though significant trend lines often occur, but when they do it is to confirm by a touch that there is another preferred gradient close by. In this instance, the break below line V could be happening for a goodbye kiss on line Q, before the bull trend resumes.
For that to be so, would of course require that the price of silver rebounds from the support at line Q within a day or two, to break back above line V. Else the break to below the old bull channel, of which line V is the lower boundary, would imply that silver is also settling into a shallower trend, as represented by channel KL ($17.44)
US 10-Year Treasury Note
The yield on the US 10-year Treasury note is still in a volatile consolidation phase, as mentioned last week. It has held marginally below the lower boundary of steep bear channel KL (1.589%), and also failed to break back below resistance at line Q (1.521%). This presents a mix of bullish and bearish signals and the market has to prove which of the two signals happen to be correct. The trend has been bearish for some time now, but TPTB can be expected to prefer a more bullish performance form the Treasuries, more so in view of the recent weaker dollar.
Weak performances by both the dollar and the Treasuries – given the nervousness in most markets – could easily trigger sales of US Treasuries in foreign countries, should owners of Treasuries see trouble ahead. That would place further pressure on the dollar and the bond market, and trigger concerns among US investors that might include increased selling of equities. Too many markets are just too finely balanced for them to hold steady to firmer in the face of such bearish signals.
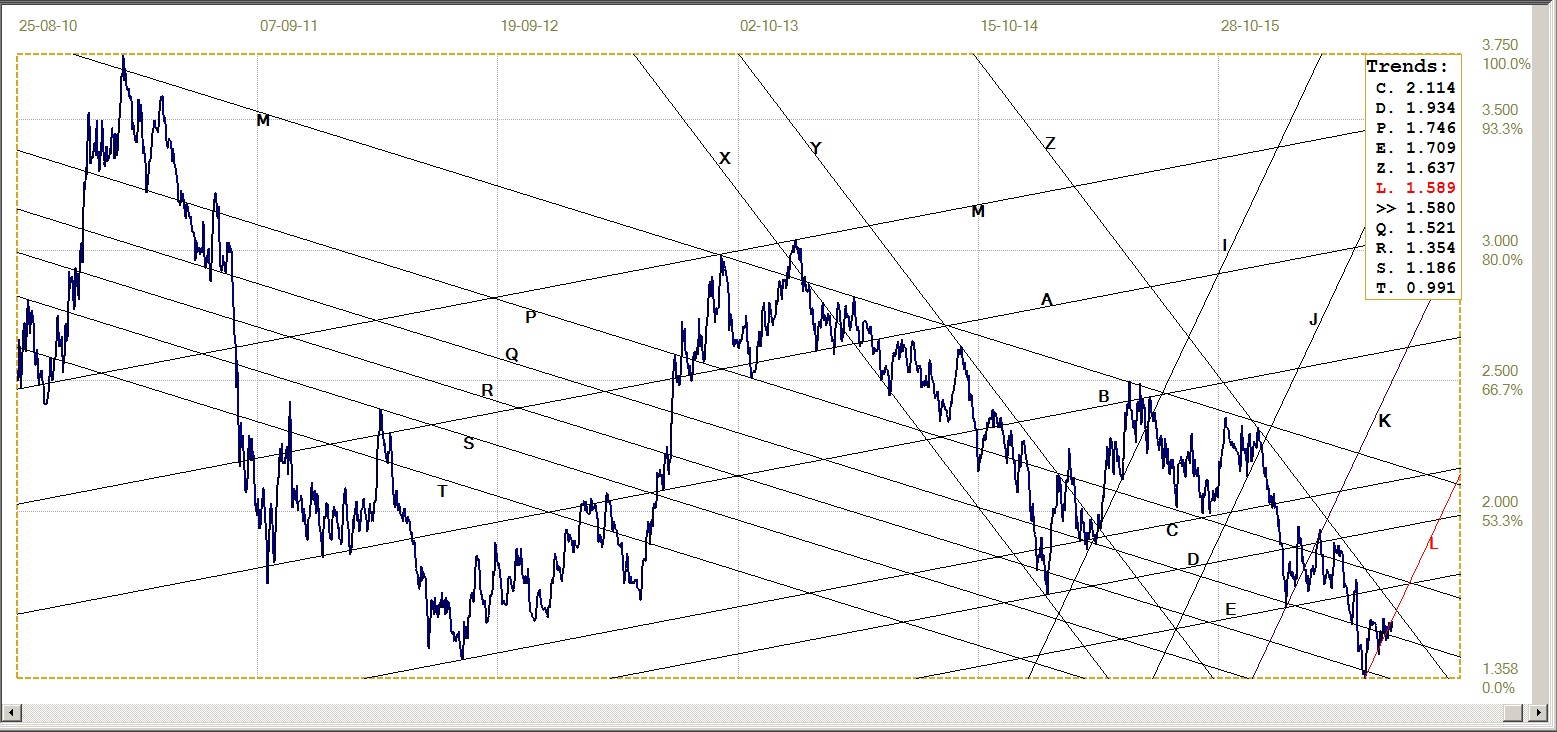
U.S. 10-Year Treasury Note, last = 1.580% (www.investing.com )
West Texas Intermediate Crude. Daily close
There was a time not too long ago – when the very low price of crude caused much concern about the financial viability of the over indebted shale operators – when it was evident that Wall Street fluctuated in step with the price of crude. As the price of crude started to improve, and when the DJIA target of 18 000 assumed greater importance, this link was no longer as strong.
Now that it has become so politically important to prove Trump’s pessimism about the US economy wrong, it seems the price of crude is reacting more to the political reality than to the balance between supply and demand. Or can it be that the price of crude is now reacting to a stronger Wall Street? That kind of link seems much more tenuous than the converse – that the price of crude is perceived as another justification that the sentiment on Wall Street is realistically bullish.
A break above the key $50/bbl resistance as well as above line X ($52.09) would of course help to consolidate bullish sentiment in both markets.
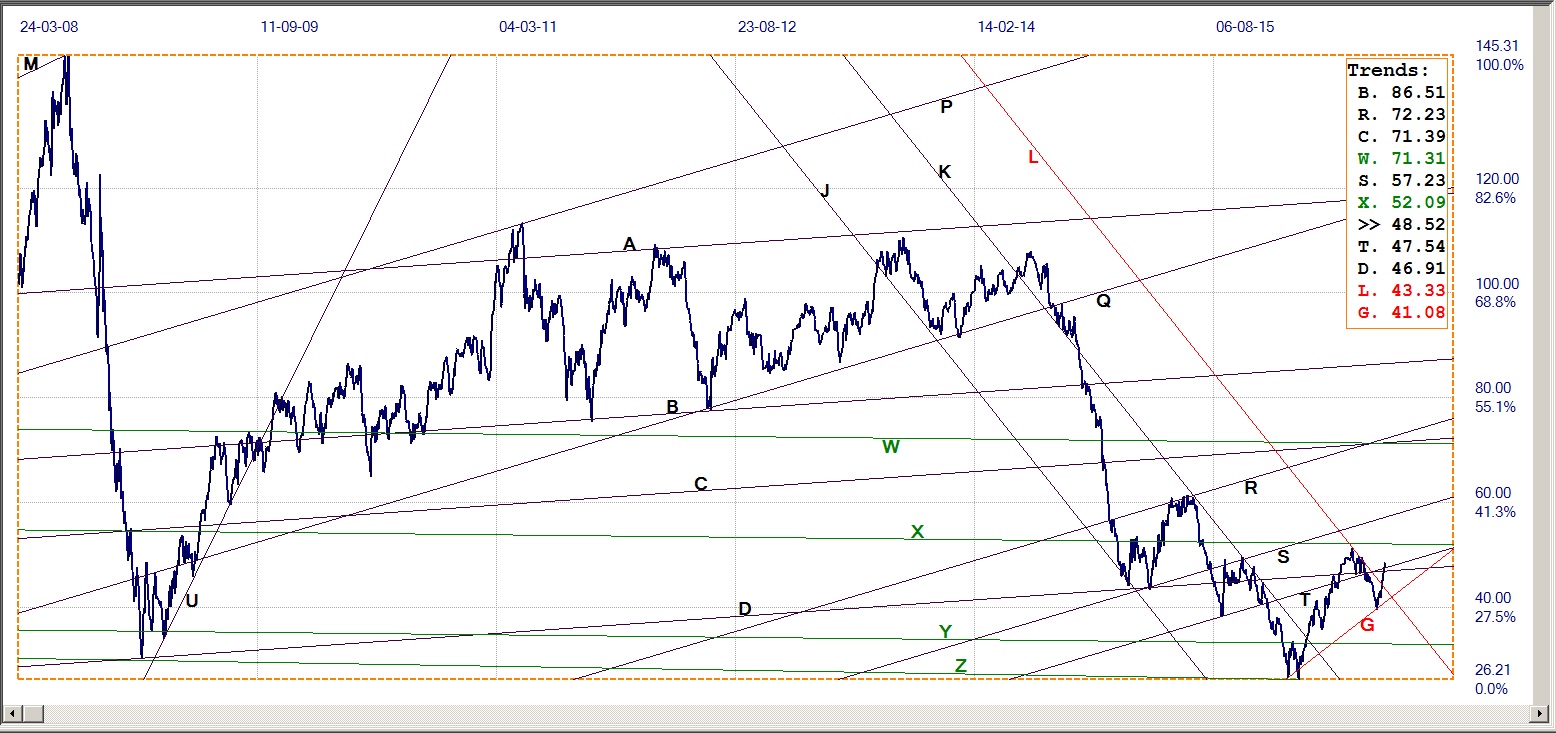
WTI Crude – Daily close, last = $48.52 (www.investing.com )
©2016 daan joubert, Rights Reserved
chartsym (at) gmail(dot)com
share
share
share
share
share


