
Market Pressure At The Red Line
 share
share
 share
share
 share
share
 share
share
 share
share
A long time ago a friend need help cleaning a kitchen after a pressure cooker had exploded. Apart from a large hole in the ceiling and some broken things all over, it was necessary to clean practically every square inch of every surface, walls and the ceiling included. When a safety valve is stuck so that pressure builds up to where it blows, it becomes a real disaster. Markets and economies have their safety valves too. The media can play an important role to warn investors when markets become over-cooked; even better is when cautious investors begin to seek out safe havens, with the precious metals prominent among these. Then a final warning comes when markets begin to tumble so that even the perma-bulls begin to run for cover, most of them already with deep wounds. Not this time around; the usual valves are not stuck, but are being screwed tight. The explosion will be magnificent and result in a lot more than holes in ceilings and sticky walls. The kitchen will be gone!
The screwing down of safety valves is a concerted effort, in full blown force since at least 2011. The mass media have been recruited if not conscripted to still support spin that the economy is in good health, even if the recovery is taking time; Wall Street is not allowed to turn bear – with statistics being ‘adjusted’ not to reveal that the safety valves are groaning and GAAP being ‘tuned’ so that corporations are able to report glowing results! – the dollar has to remain strong, so there can be a ready excuse why both precious metals are in the dumps. Those people who try to issue a warning of problems ahead are labelled as being deluded and conspiracy nuts. The oh so crazy foil hat brigade.
A major tactic in the effort to keep the eyes of the world off developing problems in the US economy was to point fingers at problems elsewhere. Triggering a financial crisis in Cyprus, junking Greek bonds these were not the worst in the world by far, but Greece was a convenient target; headlines screaming the Chinese economy is in deep trouble, when growth declined from an unsustainable 10% to a still massive 7% in the world’s second largest economy; and now also rating Brazil’s debt down to junk level, perhaps to hobble the BRICs. Repeatedly playing a message of, “We are so fine, but the rest of the world is doing us harm!”, and the media laps it up.
The historian Barbara Tuchman in her book, “The March of Folly”, wrote about the way that unfettered authorities implement a policy that soon proves to be counter-productive. Despite all known evidence to substantiate this fact, they blindly refuse to change until the safety valve goes and it all blows up, often literally so! The way the US colonies were treated by British royals was an example. If they had avoided the consequences of their policies and laws by changing these in time, all of North America today would probably be a major part of a still functioning British Empire.
If US leaders realised 3-4 decades ago that there were policies and strategies being implemented that would have severe consequences on the economic wealth of the country, and changed, there would have been no need to screw down safety valves. If politicians did not seek favours from “Big Business” in return for giving them a free hand, but sought to do their best for all Americans, America would still enjoy a healthy manufacturing sector today and nearly 50 million Americans would not be on food stamps, or a third of the population needing some form of state assistance.
Now, I believe, it is already far too late. The pressure is getting ready to explode.
Euro-Dollar Chart
olding above line N should reHH
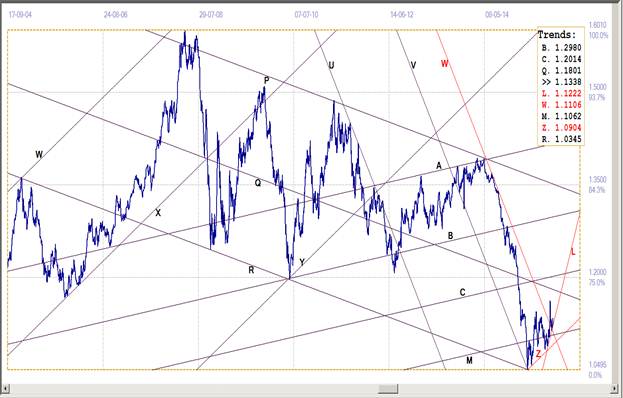
Euro-dollar, last = $1.1338 (www.investing.com)
The equity sell-off in China had the euro briefly spiking higher, breaking clear above the steep bear channel, VW ($1.1106), but as the markets steadied, a new reversal steeply lower to end and hold at the top of bear channel VW and at steep support of line L. The consolidation taking place in a tight range is not a goodbye kiss, but the extended testing of new support – with the support holding firmly, but without the ability to break free and rally higher. This could be a prelude to a new rising trend, once the euro manages to break free – except if it is overwhelmed by the bearish forces keeping it range bound.
Dow Jones Industrial Average (DJIA)
During the gradual and mildly volatile part of the move lower, the DJIA held above support along trend line L (16895); then, suddenly the DJIA fell steeply to break clean through the support at line L, spiking lower far below lines B (16582) and R (16415). The spike was an over-reaction – or perhaps there was a vested interest in halting the slide and sending a positive signal to the economy! – so that the DJIA reversed as suddenly and steeply. It settled in a tight range around line B and just below R, making wild swings while waiting for new direction – likely to be bearish
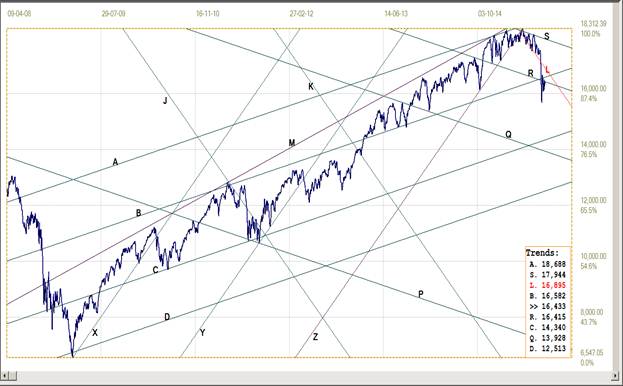
Dow Jones Industrial Index, last = 16433 (money.cnn.com)
Gold PM fix - Dollars
The promising jump in the price of gold when the wheels fell off the Chinese stock market was not allowed to be anything more than a promise. Heavy selling, often of the waterfall variety, had the price close to the psychologically important $1100 level and briefly even dipped just below.
The master line for this analysis lies way back at the time of the 1981 high in gold. Line Z ($1072) has acted as accurate support for the price on three widely spaced occasions – which raises hopes that the most recent reversal, on 24 July at a fix of $1080 at the end of leg 4 of pennant RZ ($1125) – should lead into a break higher from that pennant, as had happened but then failed to hold under waterfall attacks in the wee hours of the morning. Even the minor break above line B ($1160) failed to support the price once the determined selling started again.
The signs of desperation in the PM and other markets indicates that we could soon learn the real reason for the attack on gold and silver; will it be the scarcity of the metals in the face of mounting demand or the fact that there is a terrible position in silver that threatens survival of one or more major institutions; or is the dollar now getting so precarious that it no longer reacts to support? Or a combination of these?
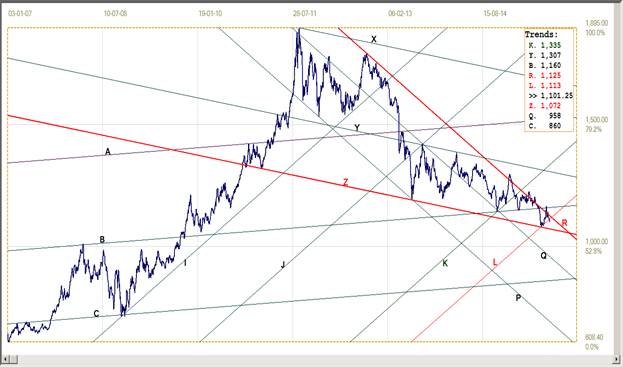
Gold price – London PM fix, last = $1101.25 (www.kitco.com)
Gold PM fix - Euro

Euro gold price – PM fix in Euro, last = €974.2 (www.kitco.com)
The euro price of gold has now dipped marginally below the bottom of triangle AS (€983) for the third time in the history of the chart. It remains to be seen whether the price will react again as it had done on the previous two occasions, by reversing higher to immediately break back into the triangle. With the euro having improved late last week and gold slipping lower again, the minor break below line S is due to a combination of the two prices. A recovery back into the triangle requires either a steep jump in the price of gold, new weakness for the euro or perhaps again some combination of these changes. Should the euro remain firm, a substantial increase in the gold price will be required to rescue the euro price of gold.
After leg 3 of the triangle had completed at line A and the price then rebounded off line X for a new challenge on line A, it was thought that the break from triangle AS could happen while the price was still on leg 4. Such a premature break would have been very bullish. The guess was wrong, as it turned out that the markets stuck to the normal development of a triangle by compelling the euro price of gold lower so that leg 4 could complete by reaching and testing support at line S.
Now it remains to be seen whether the support at lines S and Y(€980) can recover to send the price off on leg 5 of the triangle – to break higher from it into a strong new bull market. The odds from the statistics on the normal development of such chart patterns favour this bullish future which requires a very strong gold price if the euro is to rally as well.
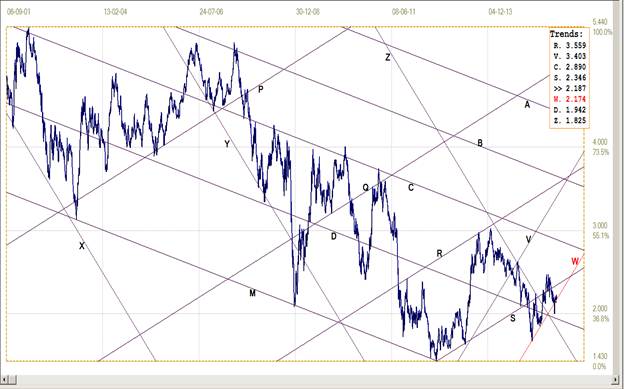
Silver Daily Fix Chart
Similar to the euro price of gold, the main chart pattern for the price of silver – the large pennant FZ ( F: $14.75, Z: $14.40) – shows a clear, non-ambiguous count for the different legs within the pattern. Leg 1 briefly spiked much higher above the top of the pennant, but later confirmed the top boundary by testing it twice on the way lower during leg 2.
The chart pattern had really started as triangle FA – the second test of line F within leg 2 of the large pennant being the end of leg 3 of the triangle. When leg 4 ended at line A in April 2013, the prices of both precious metals were hammered by one of the largest attacks since 2011 and rather than rebound into the bullish leg 5 of the triangle, the price plummeted to form the extended second leg of a pennant, all the way lower to M ($10.16).
Leg 3 of pennant FM drifted sideways and lower, showing no sign of what should be the usually bullish bounce of the third leg of such a pattern. It did finally complete at a lower price than the end of leg 2, but only after finding good support at line D ($15.98) – which has now failed to hold after the most recent assault on the price.
This leaves silver in a precarious position. The break below line D has opened a way lower within pennant FM. A definite break above the pennant is now needed soon to provide a bullish signal – there is very little room for the price to remain between the support and resistance before a break is forced.
If the supply-demand situation is as out of balance as is widely discussed on the web, logic dictates that the break should be to the upside into a rising trend. But as we know – in particular from post 2011 history – logic has not been a major driving force in the PM market during the past 4 years. Perhaps that is now due to change.

Silver daily fix, last = $14.58 (www.kitco.com)
U.S. 10-year Treasury Note
The spike break below channel VW (2.174%) at the time of the panic after events in China was brief and a complete over reaction – but thus also a sign of how tense and stressed the markets have become. This sudden flight to safety in bonds is also mirrored in the gold price, but less so in silver (silver being more closely watched?). Once the panic was over, the yield rebounded to above the 2% level, which is still thought to be where much profit taking kicks in to limit the gains in this market.
Not too long ago, the battle lines between bulls and bears were drawn up north of the market resistance along line S, with the yield oscillating within a defined range for some time. Now that nervousness in the markets has increased some more, there are new battle lines just within bear channel VW, closer to the 2% floor where the sellers step up. For the time being the outlook is bearish, while channel VW holds.
U.S. 10-year Treasury note, last = 2.187% (www.investing.com)
West Texas Intermediate crude. Daily close
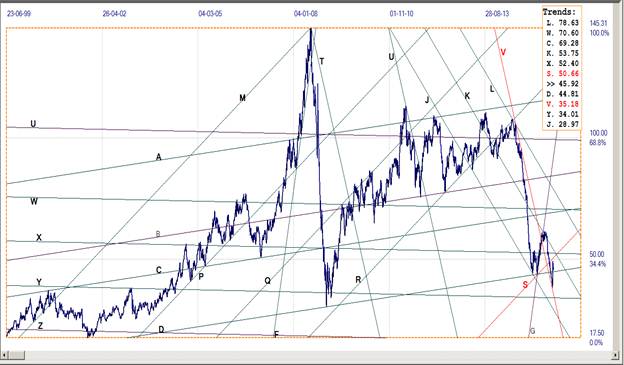
West Texas Intermediate – Daily close, last = $45.92 (8 September)
The latest official EIA price from Cushing is for 8 September. After breaking below the previous firm support at line D ($44.81), the steep decline extended, spiking lower to test the top of the very steep bear channel, UV ($35.18) at $38.50. There, the price reversed just as steeply to break higher clear above line D, but still well short of the next resistance at line S ($50.66).
The outlook remains bullish as long as support at line D holds. However a definite return to bull channel RS and a break above line X ($52.40) are needed to signal that the bull has really returned. Until then a generally sideways and volatile trend is expected.
©2015 daan joubert, Rights Reserved
chartsym (at) gmail(dot)com
share
share
share
share
share
More from Gold-Eagle


