Maund On Gold
 share
share
 share
share
 share
share
 share
share
 share
share
Although gold remains on the defensive following its latest breakdown, the longer-term outlook remains very good. We can see why on the 2 long-term charts shown below.
On the 14-year log chart the retreat from the 2011 highs still looks like a correction within an ongoing major uptrend – which is not an unreasonable interpretation given that they have not stopped printing money. Gold looks like it has been basing over the past year above its long-term uptrend line, and at this point it looks like the support level at last year’s lows at about $1180 will hold, although there are reasons why we could see near-term weakness towards this support that we will consider shortly.

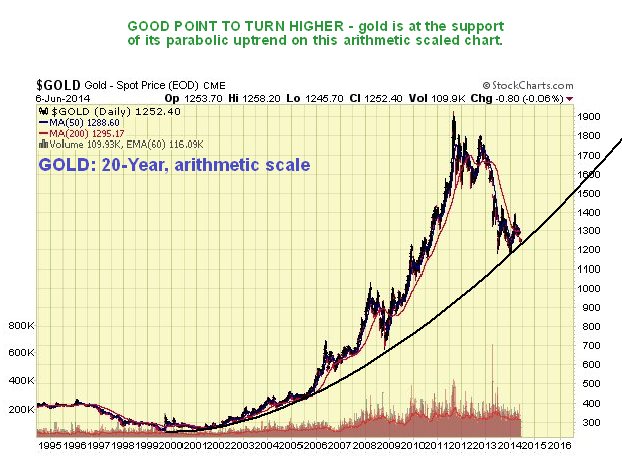
On its 20-year arithmetic chart we can see that gold is at a good point to turn up almost immediately, because it is at the support of its long-term parabolic uptrend – and it could happen given that silver now looks so bullish.
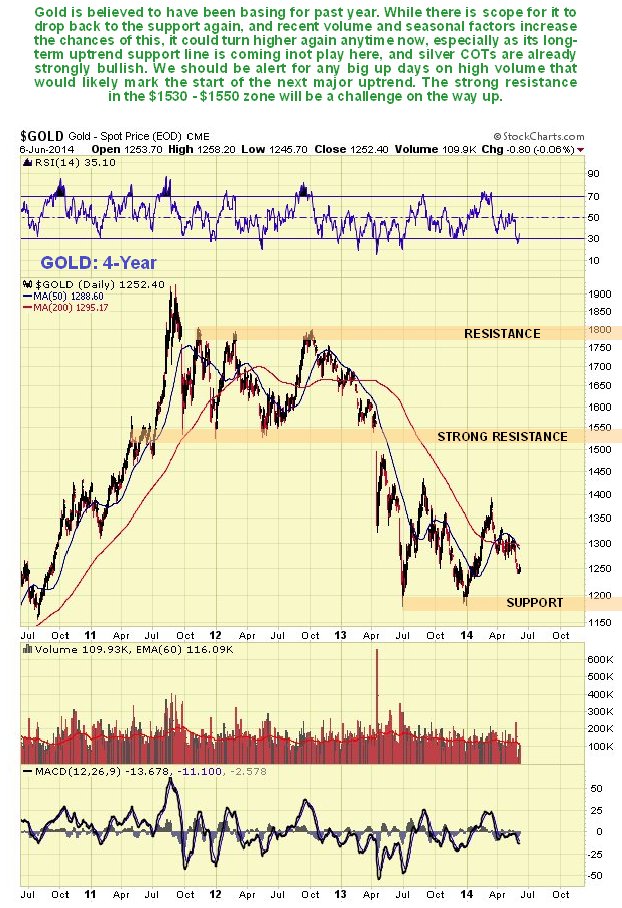
The 4-year chart is useful as it puts the basing action of the last year in context relative to the decline from the highs that preceded it. Here we can see the importance of the resistance in the $1530 - $1550 zone, because this level had functioned as support before the dramatic breakdown in April last year on very heavy volume. We can therefore expect this to function as heavy resistance on the way up, and initially we will look to scale back positions on any approach to this zone.
On its 1-year chart we can see how gold broke down from a small Triangle over a week ago, which triggered a sharp drop on heavy volume. This break confirms that the downtrend from the March highs remains in force, although the downtrend could morph into a bullish Falling Wedge, which is made more likely by the proximity of the long-term uptrend line (see 14-year chart). However, recent upside volume has been weak, and seasonal factors are unhelpful until we get to August, so what we could see is either some further downside towards the support, or choppy sideways action develop. It should then turn higher.

As the 2 long-term charts shown above make clear, a major uptrend should develop if gold can succeed in rising away from its respective long-term uptrend lines on both charts.
Gold’s latest COT charts show a very substantial improvement in its COT structure over the past 2 weeks, although there is still considerable room for improvement, which is why there is a fair chance that gold will drop back to the support at last year’s lows over the short to medium-term.

Gold’s long-term COT chart likewise shows an increasingly favorable situation with Commercial short positions being scaled back, while the Large Specs get increasingly despondent and reduce their long positions. Here again though, there is considerable room for improvement – readings are not yet extreme, although they are getting there.
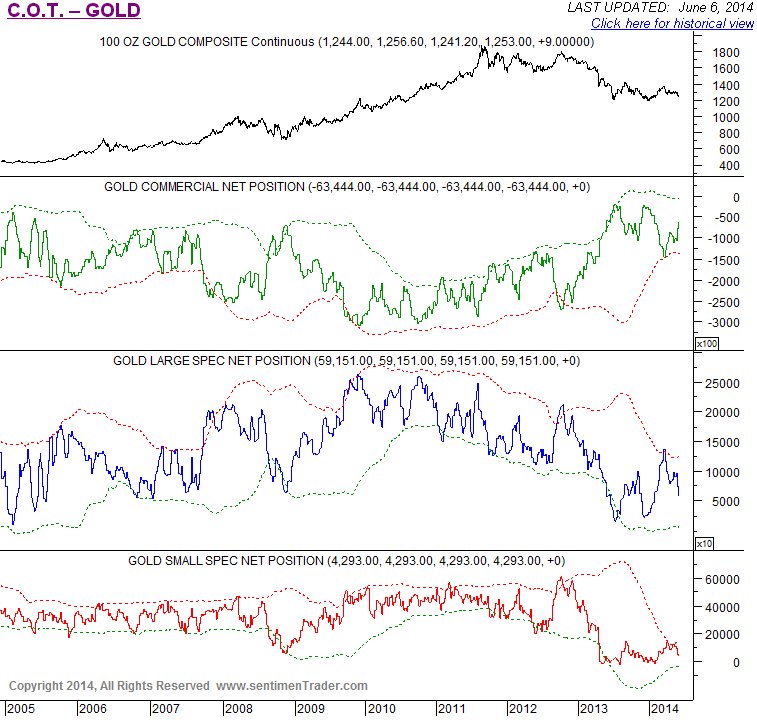
Chart courtesy of www.sentimentrader.com
Public opinion on gold has nosedived over the past 2 weeks, which is another positive sign as the public at large are always gloomy at market bottoms. This indicator is already arriving at a bullish extreme.

Chart courtesy of www.sentimentrader.com
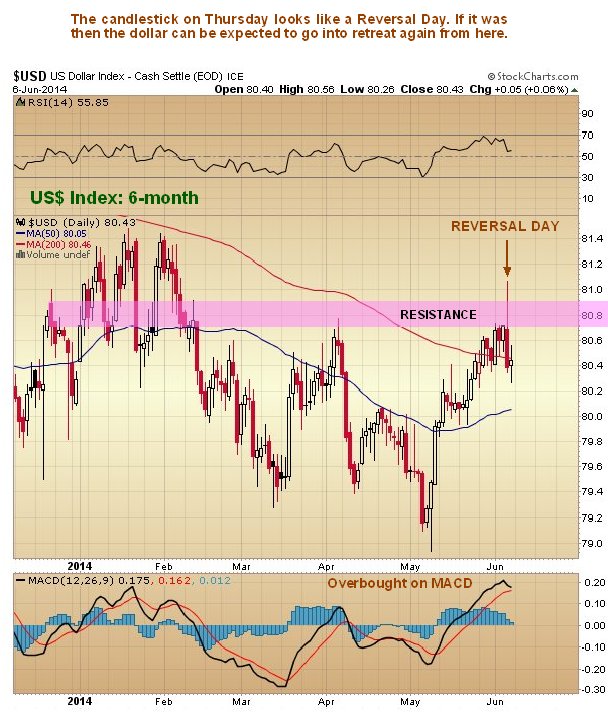
There was a quite pronounced “Reversal Day” on the dollar index chart on Thursday at a resistance level, as we can see on its 6-month chart below, so it looks like the dollar may be rolling over here after its recent run-up.
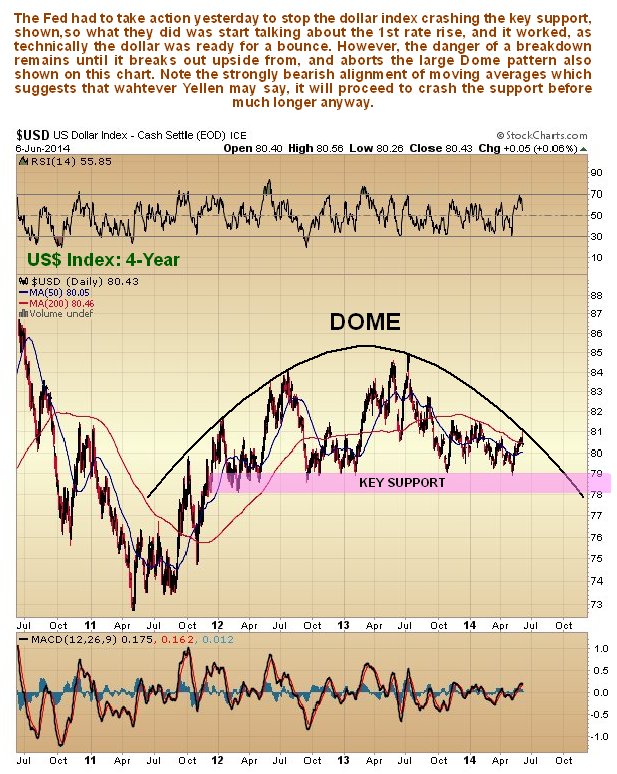
The dollar looks like it is still under the influence of the Dome pattern shown on its 4-year chart below. These Dome boundaries can be hard to define precisely, and the boundary of this one has been adjusted from earlier reports so that it is now more accommodating. If it is correct and accurate, then it could now force the dollar index lower so that it crashes the important support in the 78 – 79 area, which would likely usher in a drop into the low 70’s – needless to say this would likely be the trigger for a substantial rally in gold and silver. Dollar COTs are modestly bullish at this point but not enough to rule out a drop.
So all in all, although there is scope for further short-term weakness, the longer-term picture for gold looks bright. Ideally gold will churn around current levels in coming weeks and perhaps retreat a little more, allowing the Commercials time to clear out most of their remaining shorts, thus setting gold up for a powerful rally during its seasonally strong time in August and September. However, it might not wait that long, given the already strongly bullish setup in silver.
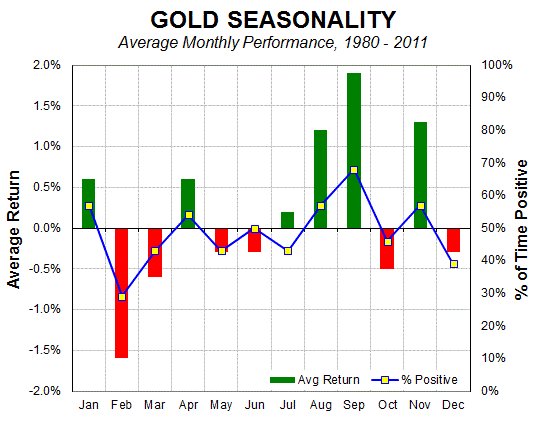
The seasonal chart shows that June is a not usually a positive month for gold, but once this month is out, on average things start to improve…
A tragic irony of the past few years is that Precious Metal sector investors thought that they were protecting themselves from the consequences of the reckless extravagance of the political and ruling class, but have been made to look stupid, as not only has the sector suffered huge losses over the past 3 years, but mainstream investments have risen relentlessly. This has had the effect of “rubbing salt into the wound”. What has happened is that PM sector investors have underestimated the survival instincts of the ruling class, who will stop at nothing to preserve their position, up to and including mortgaging the future of everyone (except themselves) to keep the party going today, and they have even used the unusual conditions as an excuse to plunder the accounts of savers via eliminated interest payments and funnel their wealth into their pockets. It’s the equivalent of a guy who borrows from his family and friends and everyone he knows to go on a wild gambling spree in Las Vegas – one day he is going to have to come home and “face the music”. The excesses of 2008 have not been addressed or corrected at all – instead they have been compounded, and that guarantees a worse collapse later, which is now looming.
Courtesy of www.clivemaund.com
share
share
share
share
share

Clive P. Maund’s interest in markets started when, as an aimless youth searching for direction in his mid-20’s, he inherited some money. Unfortunately it was not enough to live a utopian lifestyle as a playboy or retire very young. Therefore on the advice of his brother, he bought a load of British Petroleum stock, which promptly went up 20% in the space of a few weeks. Clive sold them at the top…which really fired his imagination. The prospect of being able to buy securities and sell them later at a higher price, and make money for doing little or no work was most attractive – and so the quest began, especially as he had been further stoked up by watching from the sidelines with a mixture of fascination and envy as fortunes were made in the roaring gold and silver bull market of the late 70’s.
Clive furthered his education in Technical Analysis or charting by ordering various good books from the US and by applying what he learned at work on an everyday basis. He also obtained the UK Society of Technical Analysts’ Diploma.
The years following 2005 saw the boom phase of the Gold and Silver bull market, until they peaked in late 2011. While there is ongoing debate about whether that was the final high, it is not believed to be because of the continuing global debasement of fiat currency. The bear market since 2011 is viewed as being very similar to the 2-year reaction in the mid-70’s, which was preceded by a powerful advance and was followed by a gigantic parabolic price ramp. Moreover, Precious Metals should come back into their own when the various asset bubbles elsewhere burst, which looks set to happen anytime soon.
Visit Clive at his website: CliveMaund.com