
Oil Stock Index and Its Relationship with the Stock Market
 share
share
 share
share
 share
share
 share
share
 share
share
In our previous commentary (https://www.gold-eagle.com/article/what-can-we-infer-oil-oil-stocks-ratio ), we took a look at the situation in crude oil from the long- and the short-term perspectives to check whether they confirm the indications from the medium-term picture or not. As we wrote in the summary:
(…) light crude reached the declining long-term support line, which may trigger a bigger pullback. Additionally, it bounced off the lower border of the declining trend channel in terms of daily closing prices, which may result in further growth in the coming days (similarly to what we saw in the previous month).
Since that essay was published, crude oil has remained in the narrow range, but yesterday it climbed above $95. What’s interesting, at the same time the XOI increased slightly above an important resistance. Although they moved in the same direction after weeks of negative correlation, this positive correlation might be just another temporary phenomenon – especially when we factor in the weekly outlook.
Taking the above into account, we’ve decided to examine another interesting relationship to see if there's something else on the horizon that could drive oil stocks higher or lower in the near future. It seems there is. In today’s essay we’ll focus on the connection between oil stocks and the general stock market. Let’s start with the weekly chart (charts courtesy by http://stockcharts.com).

Looking at the above chart, we clearly see that the XOI and the S&P 500 have moved roughly in the same direction in the recent years. However, there were periods of time when the S&P 500 Index was stronger than the oil stock index. Such price action was clearly visible in September 2012. Back then, stocks managed to break above the previous 2012 top, but oil stocks only erased 90% of earlier losses. This divergence triggered a decline in both indices, but after the correction they continued their rally in the following weeks. We saw another similar situation in July 2013. Nevertheless, in spite of these cases, we can conclude that there is a strong positive correlation between the XOI and the S&P 500 Index.
Taking this fact into account, let’s examine the short-term picture.
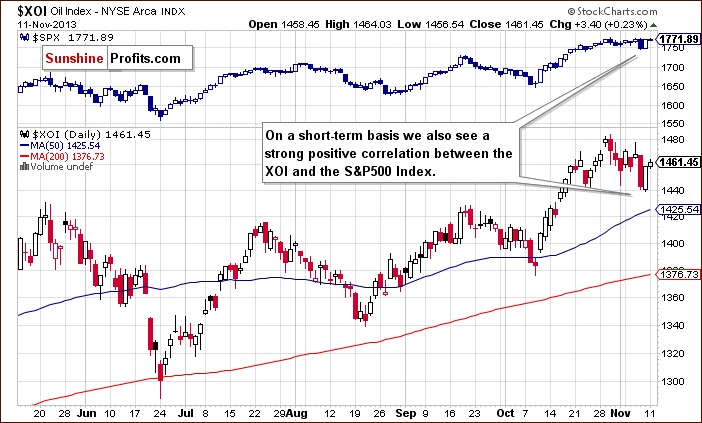
On the above chart, we see that a strong positive correlation remains in place also on a short-term basis. After October’s rally, we saw a correction which pushed both indices slightly below the bottom of the previous corrective move. However, in case of the S&P 500, Friday’s pullback was visibly stronger. Although yesterday we saw further improvement in both indices, the XOI remains weaker in relation to the S&P500 index. Is it possible that this negative divergence between them will trigger another corrective move in both indices – similarly to what we’ve seen in the past on the weekly chart?
Taking into account the relationship described above, it seems important to discuss the current situation in the general stock market. The weekly chart of the S&P 500 index was featured in our latest Premium Update and you will find it below, along with a quote from today’s Market Alert:

The general stock market moved higher - above the previous highs but the breakout formed on low volume in both key stock market ETFs: DIA and SPY. Consequently, we remain skeptical about the strength of the stock market, especially that the True Seasonal patterns suggest a short-term decline any day now.
If stocks invalidate their breakout (which seems quite likely), we will have a very bearish sign for the short term – something that could easily ignite a 2-week pullback (rough estimate).
If stocks decline and the XOI-stocks link remains in place, then we can expect oil mining stocks to slide as well.
Summing up, since the general stock market is quite likely to invalidate its breakout and the oil-stocks-oil link is quite strong, we might see some weakness in oil stocks in the following days or weeks.
Nadia Simmons
Sunshine Profits‘ Crude Oil Expert
* * * * *
Disclaimer
All essays, research and information found above represent analyses and opinions of Nadia Simmons and Sunshine Profits' associates only. As such, it may prove wrong and be a subject to change without notice. Opinions and analyses were based on data available to authors of respective essays at the time of writing. Although the information provided above is based on careful research and sources that are believed to be accurate, Nadia Simmons and his associates do not guarantee the accuracy or thoroughness of the data or information reported. The opinions published above are neither an offer nor a recommendation to purchase or sell any securities. Nadia Simmons is not a Registered Securities Advisor. By reading Nadia Simmons’ reports you fully agree that he will not be held responsible or liable for any decisions you make regarding any information provided in these reports. Investing, trading and speculation in any financial markets may involve high risk of loss. Nadia Simmons, Sunshine Profits' employees and affiliates as well as members of their families may have a short or long position in any securities, including those mentioned in any of the reports or essays, and may make additional purchases and/or sales of those securities without notice.
share
share
share
share
share


