
Oil Stocks - Change Of Trend Or Just A Correction?
 share
share
 share
share
 share
share
 share
share
 share
share
In our last essay (https://www.gold-eagle.com/article/charts-suggest-decline-crude-oil-may-be-over ) on oil stocks from December 2, we checked the oil-stocks-to-oil ratio to find out what impact it could have on future oil stocks’ moves. Back then, we emphasized the strong positive correlation between the ratio and the oil stock index in recent months. As we wrote in the summary:
(…) connecting the long-, medium- and the short-term pictures, we clearly see that the ratio reached a strong resistance zone created by the long-, medium- and short-term lines. Although we saw breakouts above them, they all were invalidated. This is a strong negative signal for oil stocks holders, which suggests that further declines are just around the corner.
Since that essay was published, we have seen a downward move which took the ratio below the lower line of the gap between the April 2009 low and May 2009 high, which is not supportive for further growth. What impact did this event have on the oil stock index? Let's jump straight into the world of charts and take a look at the XOI in different time horizons. Let’s start with a look at the monthly chart (charts courtesy by http://stockcharts.com).
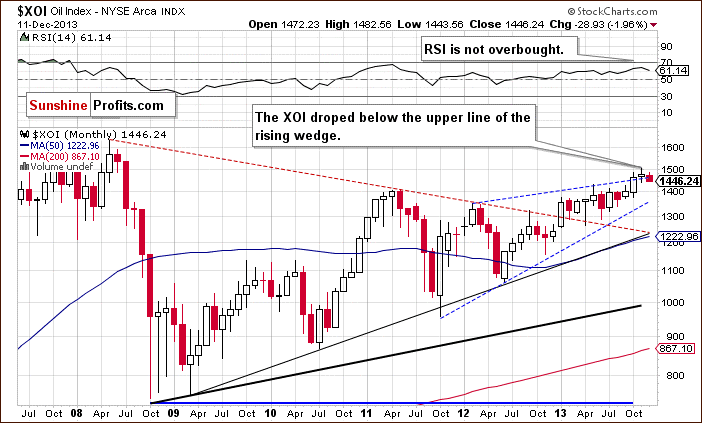
On the above chart, we see that the situation has deteriorated and the XOI dropped below the upper line of the rising wedge. In this way, the breakout above this line was invalidated, which is a bearish signal. Despite this fact, the long-term uptrend remains in place at the moment.
To see the current situation more clearly, let’s zoom in on our picture and move on to the weekly chart.

As you can see on the above chart, at the end of November the breakout above the upper line of the smaller rising wedge was invalidated, which was a bearish sign by itself. This negative event triggered further declines in the following weeks and took the XOI to its first medium-term support - the upper line of the rising wedge (marked with the red bold line) around 1,463.
Looking at the above chart, we see that the oil stock index extended its decline in the previous week and dropped below the support line. However, this deterioration was only temporary. The XOI rebounded and closed the week above the upper line of the rising wedge, which still serves as support.
Nevertheless, the position of the RSI and the sell signals generated by two other indicators, encouraged sellers to act and triggered further deterioration this week. As you see on the above chart, the upper line of the rising wedge was broken, therefore, the first target for the sellers will be around 1,439, where the bottom of the previous correction is. From this perspective, the next one target will be the May high at 1,430.
From the technical point of view, the medium-term uptrend remains in place at the moment, and the situation is still bullish.
Now, let’s turn to the daily chart.
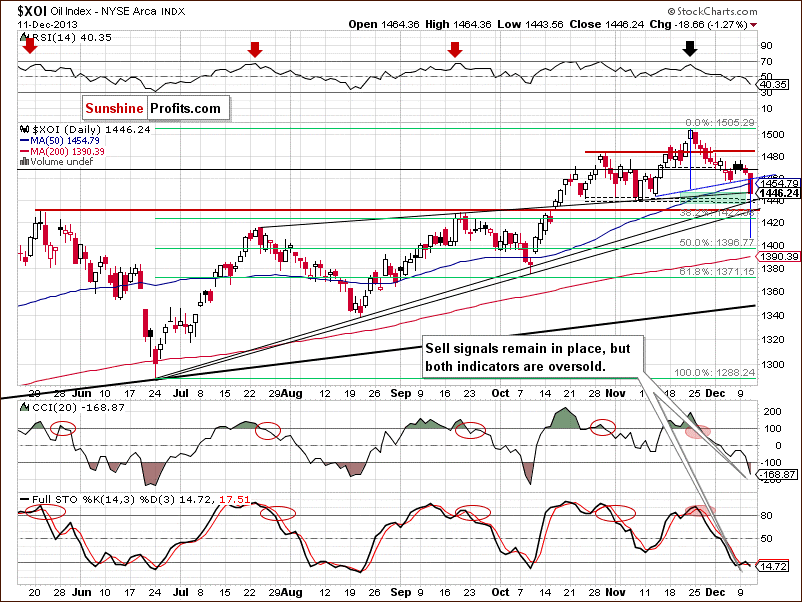
Looking at the above chart, we see that the situation has deteriorated significantly since our previous essay (https://www.gold-eagle.com/article/will-oil-stocks-pause-their-rally ) on oil stocks was published.
Quoting our Oil Trading Alert from Monday:
(…) If the XOI moves above 1,475, we may see further improvement and an attempt to move above 1,483 (the previous 2013 top). On the other hand, if oil stocks drop below 1,457, we will likely see further deterioration. In this case, the first downside target will be the 50-day moving average (currently at 1,453). If it’s broken, we may see a downward move to a support zone created by the upper line of the rising wedge (marked with the thin black line) and the bottom of the correction that we saw at the beginning of November (around 1,440-1,446).
As you can see on the above chart, yesterday the oil stock index dropped below 1,457, which encouraged sellers to act. In the following hours, the XOI declined below its 50-day moving average and reached the upper line of the rising wedge. In this way, oil stocks moved to their support zone, which may encourage buyers to push the buy button. If it happens, we may see an upward corrective move to around 1,475.
However, when we take a closer look at the chart, we can notice a head and shoulders pattern. The yesterday drop pushed the XOI below the neck line (marked in blue), which may trigger further deterioration. According to theory, the price target for this formation will be around 1,410. Nevertheless, before the sellers realize their scenario they will have to push the oil stock index below this support zone.
Summing up, from the long- and medium- term perspectives, the outlook for oil stocks remains bullish and the uptrend is not threatened at the moment. However, taking into account the medium- and short-term sell signals, further deterioration should not surprise us.
Thank you.
Nadia Simmons
Sunshine Profits‘ Crude Oil Expert
* * * * *
Disclaimer
All essays, research and information found above represent analyses and opinions of Nadia Simmons and Sunshine Profits' associates only. As such, it may prove wrong and be a subject to change without notice. Opinions and analyses were based on data available to authors of respective essays at the time of writing. Although the information provided above is based on careful research and sources that are believed to be accurate, Nadia Simmons and his associates do not guarantee the accuracy or thoroughness of the data or information reported. The opinions published above are neither an offer nor a recommendation to purchase or sell any securities. Nadia Simmons is not a Registered Securities Advisor. By reading Nadia Simmons’ reports you fully agree that he will not be held responsible or liable for any decisions you make regarding any information provided in these reports. Investing, trading and speculation in any financial markets may involve high risk of loss. Nadia Simmons, Sunshine Profits' employees and affiliates as well as members of their families may have a short or long position in any securities, including those mentioned in any of the reports or essays, and may make additional purchases and/or sales of those securities without notice.
share
share
share
share
share


