
Politics And Markets
 share
share
 share
share
 share
share
 share
share
 share
share
The Non-farm payroll number on Friday came in well below expectations, which was a disappointment after the good numbers in June and July and anticipation of a rate increase at September’s FOMC meeting if the non-farm number had been better. It would have been such a pleasant change from previous presidential election years to find the Fed raising rates two months before the big date, “as the fundamentals made it necessary” and despite any phone calls from the White House. Could it be new employment in August was so bad the BLS could not employ their accustomed magic to give the Administration a boost by conjuring up an impressive number? Or is it that this time round a majority decision perhaps was passed to the BLS that the previously favoured candidate no longer warrants a boost? If this should be so, will Wall Street now also lose some of its very visible support of recent weeks?
Politics as a rule is quite murky. This year though, it has become even murkier than usual. It might be the candidates in the running for the White House deviate just a little too much from the standard template that history has determined suitable for an occupant of that address than what has been acceptable in the recent past. The election may just deliver more stay away by undecided voters than before and also a greater fraction of party desertions to vote for the opposition candidate.
Much will depend on the degree of success of the forces who are working so hard to put a positive spin on the state of the economy, because that factor always favours the candidate of the White House party. Of primary importance in this respect is the performance of Wall Street and specifically the DJAI, which could be why there has been so much pressure to achieve and then break clear of the 18 000 level. So far, this effort is having good results; better and longer than the opinion expressed in these reports – a sign that spin beats rationality perhaps? For how long still?
On the international scene, it might be that the vilification in the media of Russia’s behaviour regarding the break-away faction in the Ukraine and more so in Syria, is another means to sweep up support for the Democratic candidate. She has a record that speaks of a tough line against foreign powers. That Russia and China both pose significant threats for the US – also for each other – is a truth of post globalisation life. But does Russia and/or China intend direct threat of war?
It would make more sense instead if Russia or China would attempt to strangle the fragile US economy and vulnerable financial system through the use of trade and/or the financial markets rather than outright confrontation. Doing so could achieve the desired result without being considered an explicit act of war.
Euro-Dollar
This week begins the post-summer season when markets tend to return to normal. The euro soon has to show whether it will break above channel UV ($1.1311) or to below support at line L ($1.1034), with the former seeming the more likely.
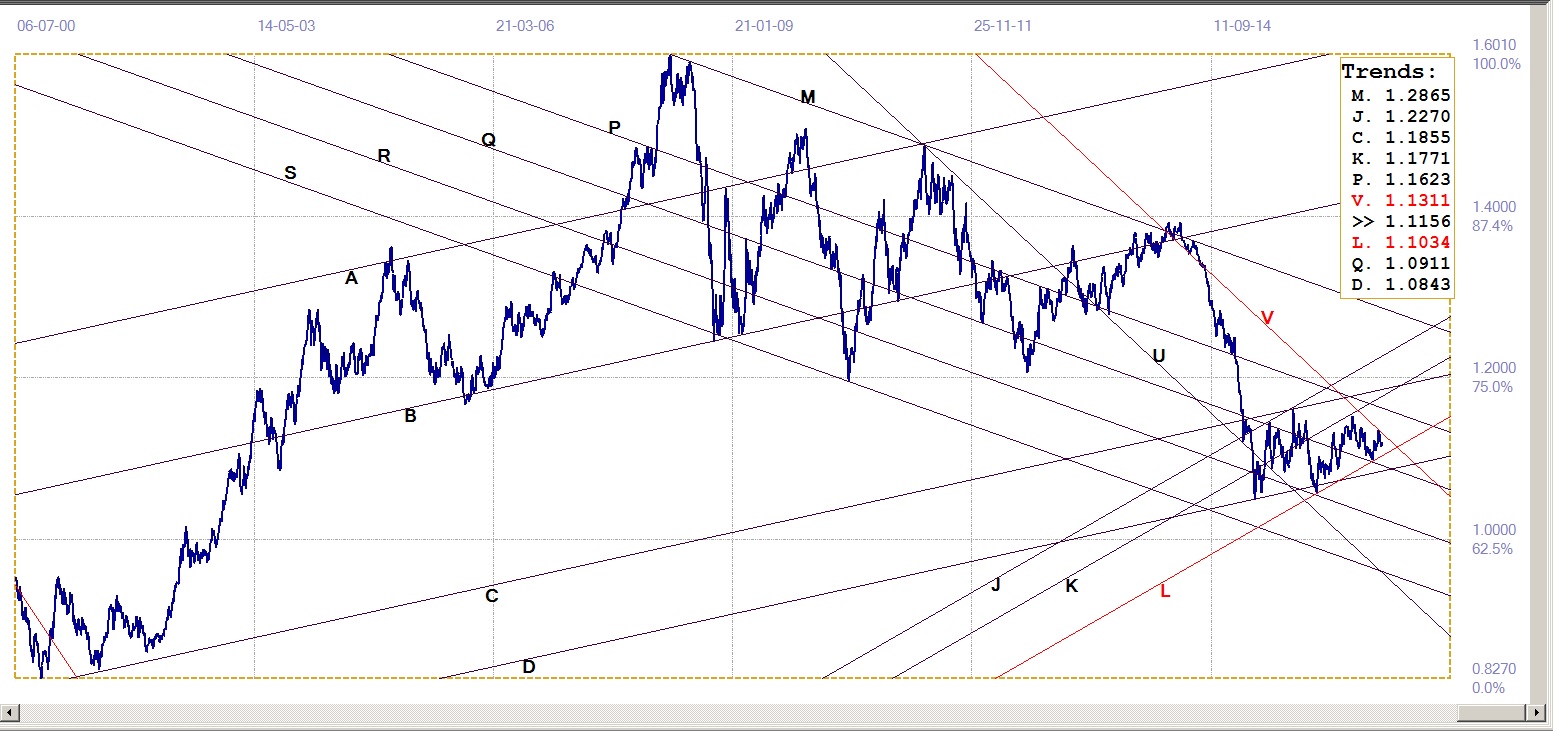
Euro-dollar, last = $1.1156 (www.investing.com )
DJIA
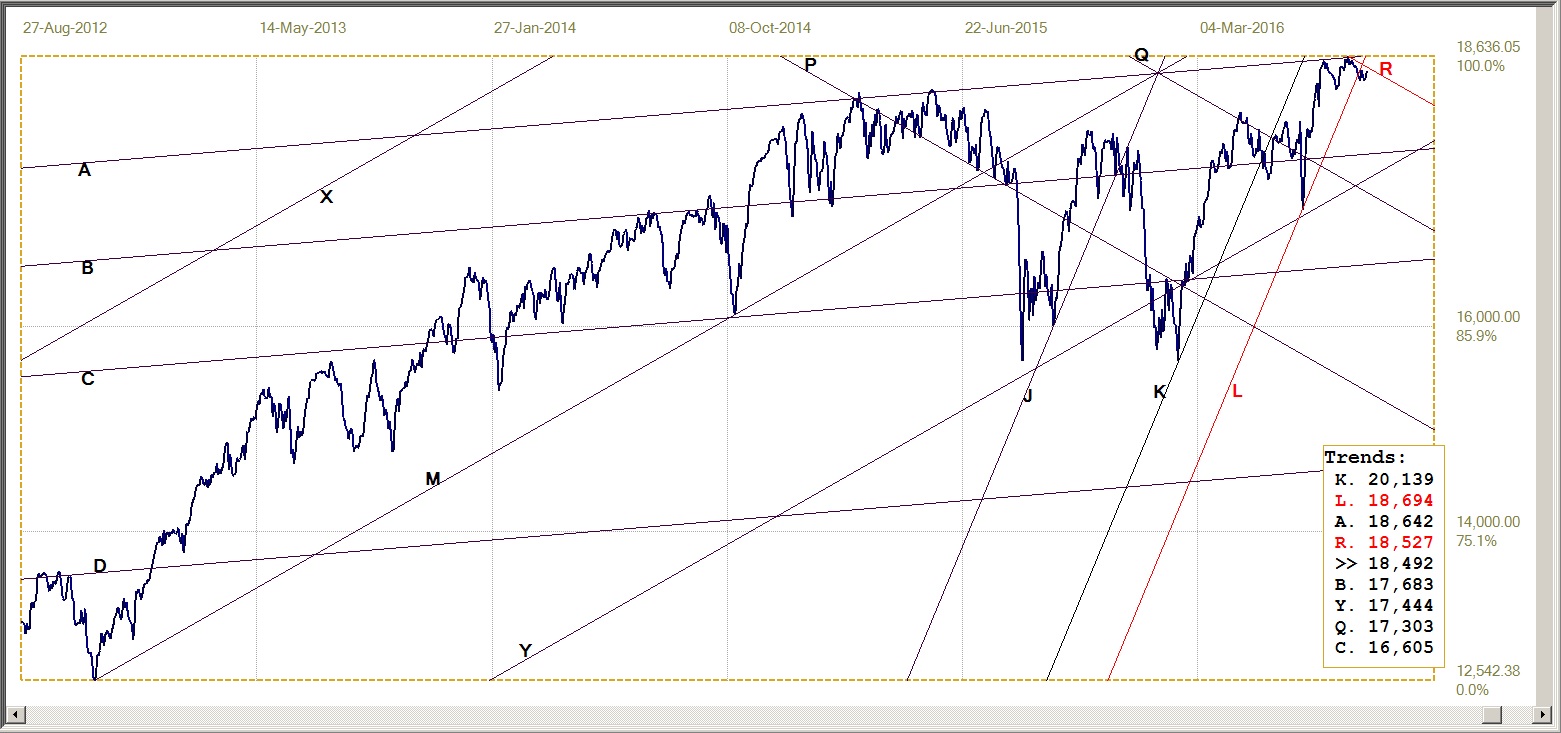
DJIA, last = 18491.96 (money.cnn.com)
The DJIA recently completed a close double top along line A (18 642). Previously it had also made major tops against the same trend line, implying that these two tops could also be major reversals. The break below steep bull channel KL (18694) hints that this might be so. To prove this suspicion wrong would first of all require that it breaks above resistance at line R (18 527), which could begin a new rally.
Gold PM Fix - Dollars
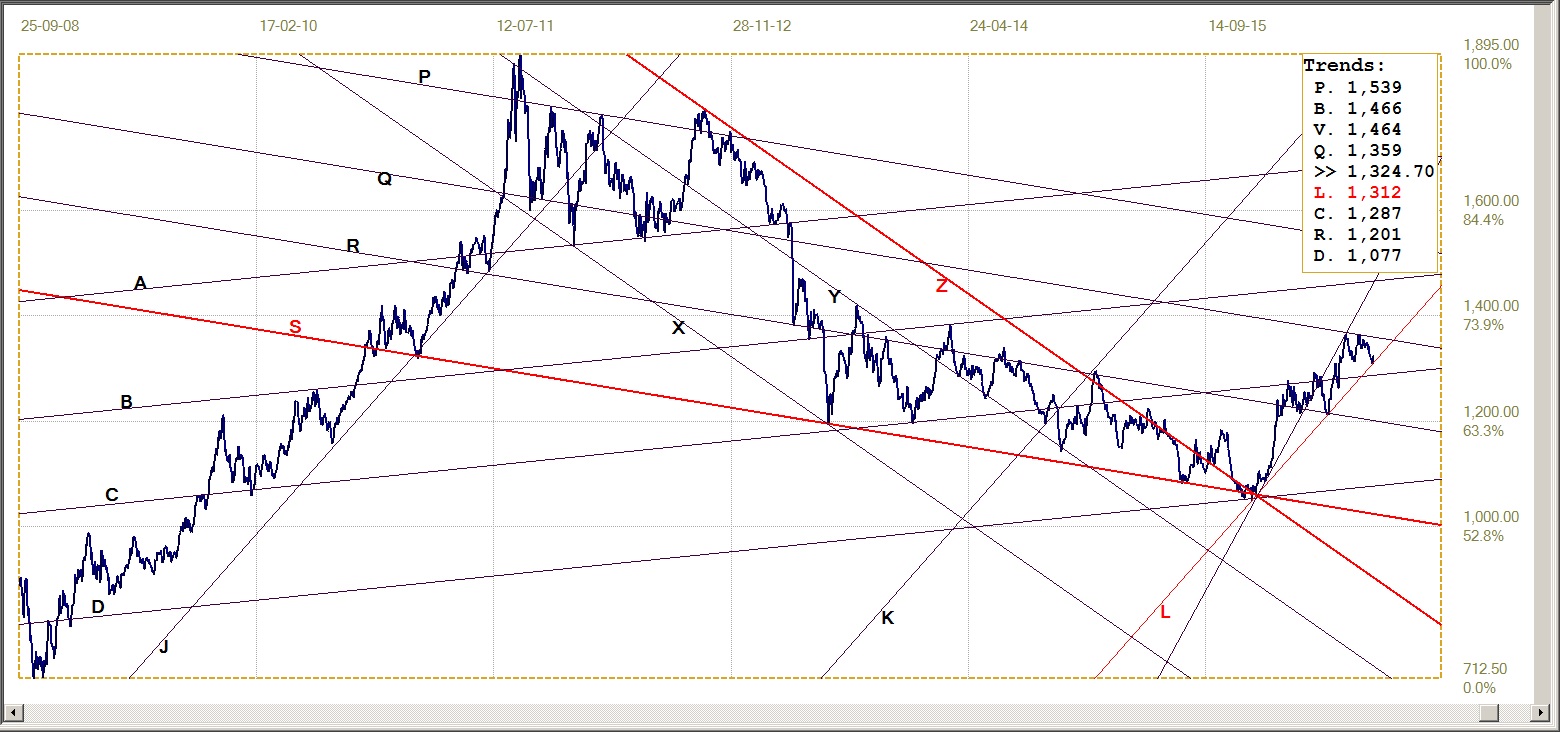
Gold price – London PM fix, last = $1324.70 (www.kitco.com )
It is well known that option expiration and FND, followed by Nonfarm payrolls, are a period of deep privation for gold and silver. As the situation apparently turns more desperate for the shorts, the extend and duration of the pressure have increased, yet mostly with reduced effect on the prices of the metals.
This phase of the monthly cycle is now history and the price of gold technically held up well, holding to support at line L ($1312), with a small bounce on Friday. Now it also is September, which traditionally is a strong month for gold. Are we soon going to see a clean break above the resistance at line Q ($1358)?
Gold PM Fix – Euro-Gold
From the analysis of the euro there is no clear technical evidence for whatever the new direction will be as the euro is being squeezed between support and resistance until there is a break. A stronger euro, which is the expected direction, will put the euro price of gold under more pressure unless the price of gold can outperform the euro against the US dollar.
After failing to hold above its recently achieved support at line R (€1210), euro-gold settled at and held around support of line W (€1180). This steadiness meant that it did not challenge key sport at the bottom of bull channel KL (€1155) – which can be interpreted as a sign of bullish potential, as long as line L remains untested. This positive outlook has to be confirmed with a break above the resistance at line R.
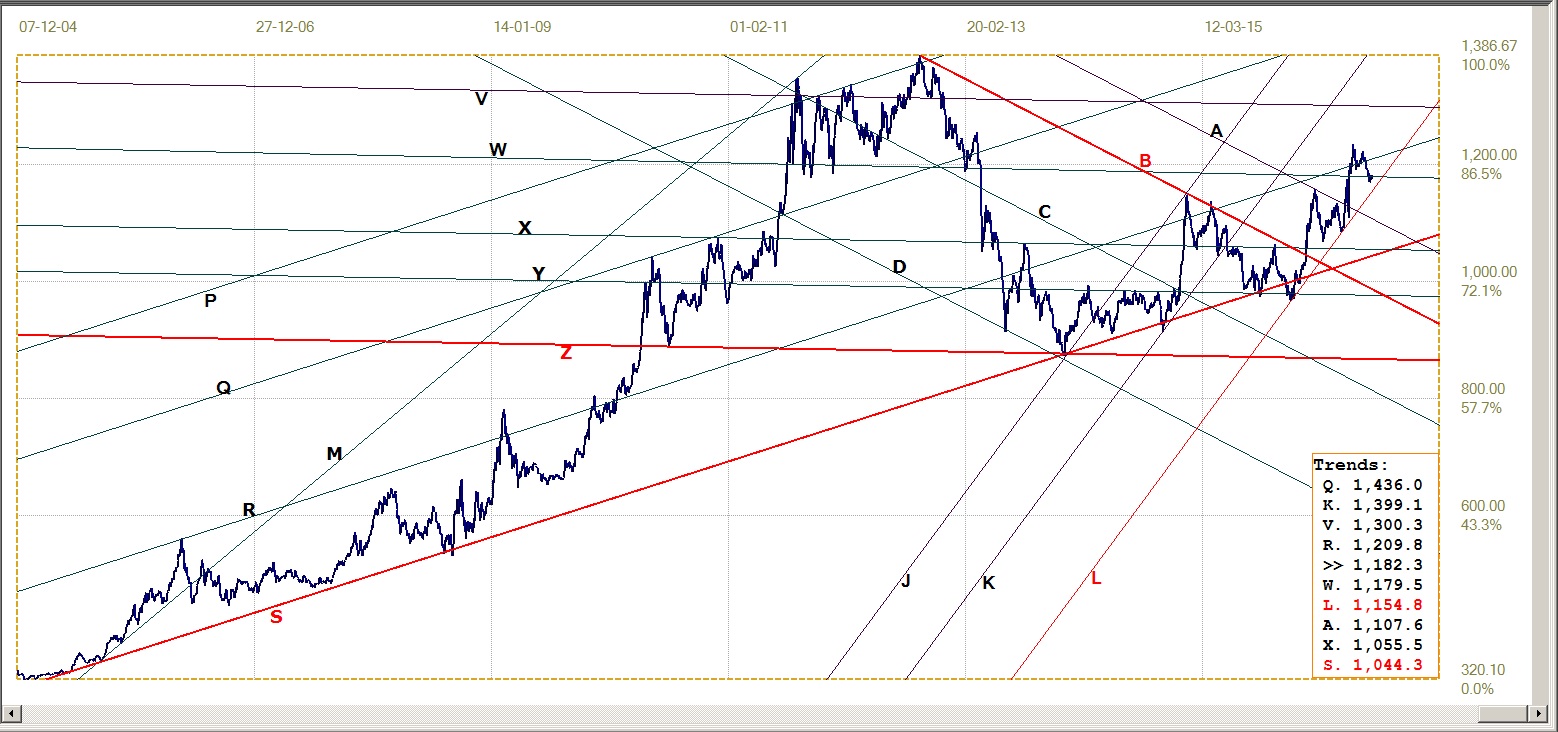
Euro gold price – PM fix in Euro, last = €1182.3 (www.kitco.com)
Silver Daily Fix Chart
Silver is still holding clear its key support at the lower boundary of its bull channel at line L ($17.69), similar to what the euro price of gold is doing. Silver still seems to be weaker and more vulnerable than gold, but is nevertheless still the better of the two in terms of its performance since the beginning of the year, having gained
33.9% relative to gold’s 22.4%.
Technically, a double top should be perceived a reversal pattern of some duration, not a small dip that turns bullish again off the first support that is found. That will be the normal reaction in a normal market. With silver being subjected to extreme manipulation, one should be careful not to accept all traditionally valuable technical signals as valid signposts to the future. This applies to gold and others as well.
The chart patterns generally appear to hold up as could be expected, but there is as always a probability of a break from the current dominant pattern, which then often develops into a new extension to the existing pattern. Nothing is ever certain in the markets! In this instance, the break below channel UV ($20.63) was significant and bearish. Channel JKL is also an old and prominent channel, which has taken over as the current main bull channel and with support at line L almost certain to be tested in the future – unless the price of silver can rally enough to recover back into steep bull channel UV!
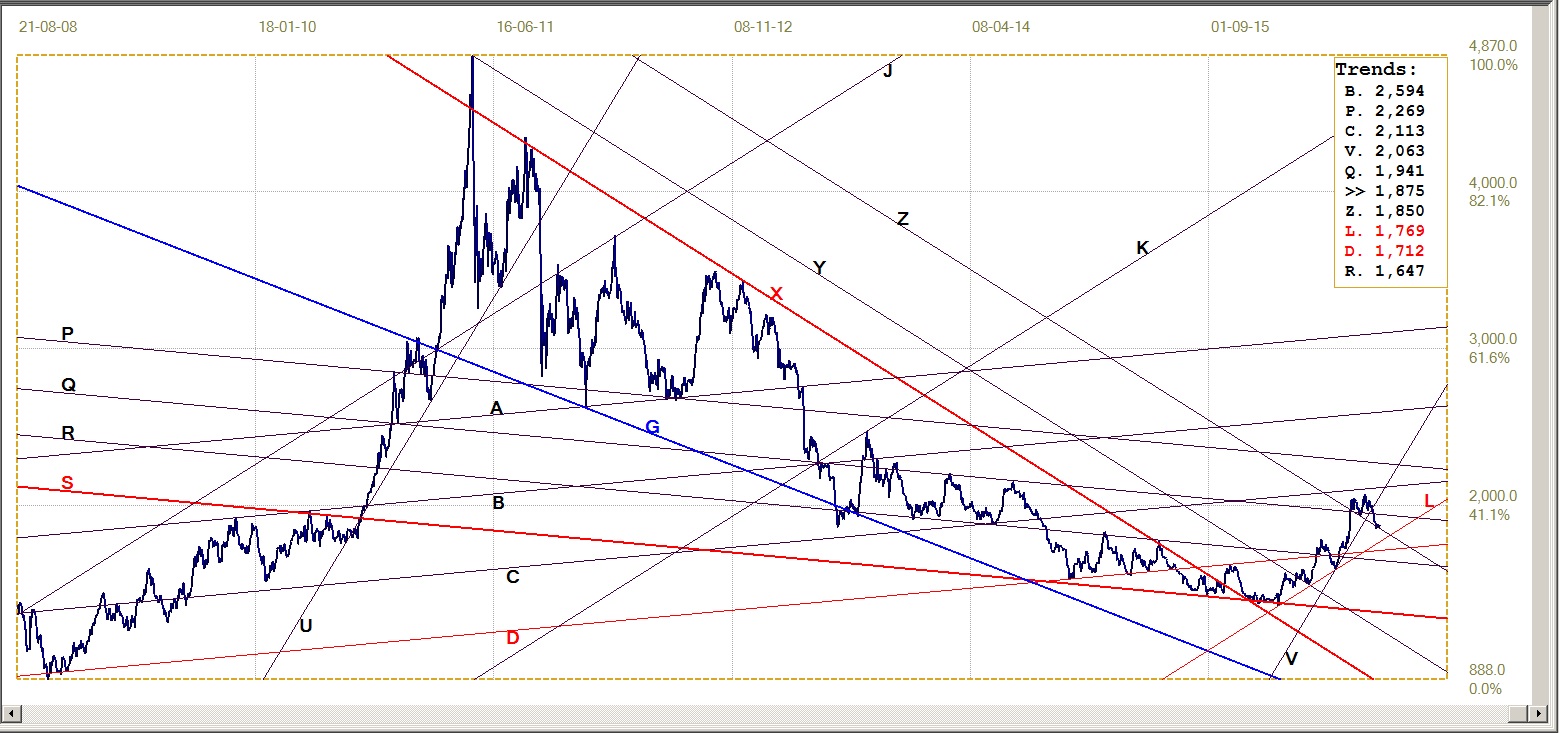
Silver daily fix, last = $18.75 (www.kitco.com )
US 10-Year Treasury Note
The yield on the US 10-year Treasury note moved higher out of a previous volatile consolidation phase only to settle in what is becoming another consolidation around the slightly higher level near 1.6%. The hesitant bearishness of the move upwards along steep bear channel KL (1.662%), after the rebound just off market resistance along line R (1.344%), leaves the impression it was reluctant to do so – perhaps a sign that while the market itself had become bearish, some vested interests were trying hard to keep the bear at bay to ensure that mortgage rates did not increase.
These vested interests received technical assistance when the yield reached market support of bull channel YZ (1.592%) and managed to break marginally below bear channel KL, to at least hold sideways if it could not yet turn outright bullish after a break lower from the bear channel. When comparing the intensity of the very tight oscillations along line L with the rest of the chart, it is clear that the bulls and the bears have been in sustained very close combat for quite some time. It is not yet clear who will be the victor, but the break below channel KL favours the bulls.

US 10-year Treasury note, last = 1.608% (www.investing.com )
West Texas Intermediate Crude. Daily close
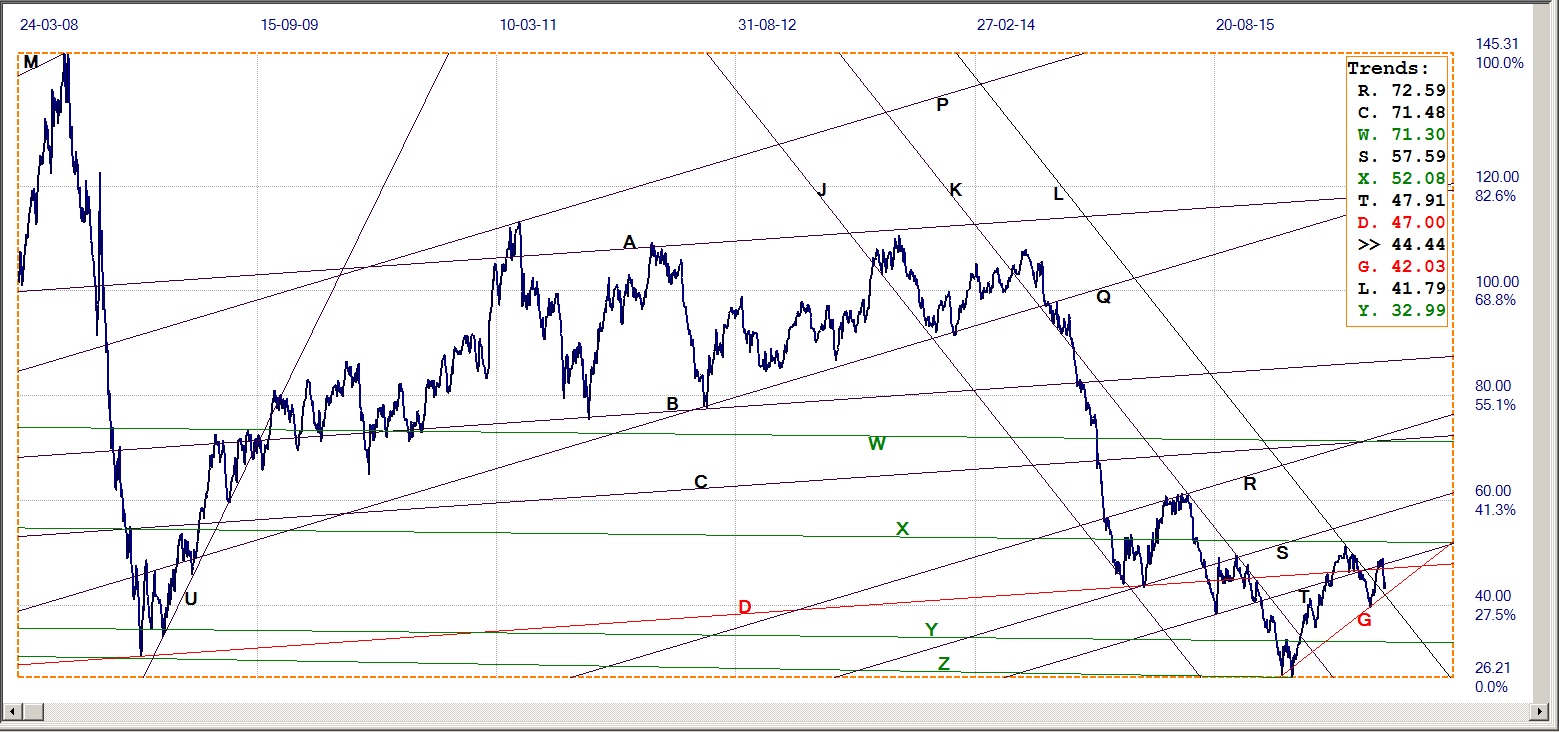
WTI
Crude – Daily close, last = $44.44 (www.investing.com )
After spending the week before trying hard to hold above the new support at line D ($47.00), crude began last week with a new high at $48.98. That attempt at setting off to resume and extend the rally that had started off line G ($42.03), immediately ran out of steam and soon broke back below the support at line T ($47.91) and also at line D, to turn bearish.
It is said that there is still enough uncertainty about the amount of supply, while a softer global economy – and in the US – is reducing demand. This instability in the crude market can be expected to increase as producers wish to pump more hoping to regain revenue, while demand remains lacklustre. Not the best prospect for the banks waiting to see their loans serviced in full and hopefully also being repaid.
©2016 daan joubert, Rights Reserved
chartsym (at) gmail(dot)com
share
share
share
share
share


