Precious Metals Soar From Oversold Levels
 share
share
 share
share
 share
share
 share
share
 share
share
I've been speculating on when the pullback in precious metals and mining stocks would end. I recently highlighted the oversold condition within a confirmed uptrend as a strong indication that a rebound was near.
Sure enough, yesterday the entire precious metals complex surged in a broad relief rally, with gold jumping 2.8% and silver rising 4.5%, erasing a significant portion of the mid-October pullback.
While the move was largely technical in nature, the official explanation being circulated is that it stems from the likely upcoming resolution of the U.S. federal government shutdown. This would allow economic data to be published again, giving the Federal Reserve a clearer picture of the economy and potentially supporting the continuation of its rate cut cycle. Let’s dig in and assess where metals and miners currently stand.
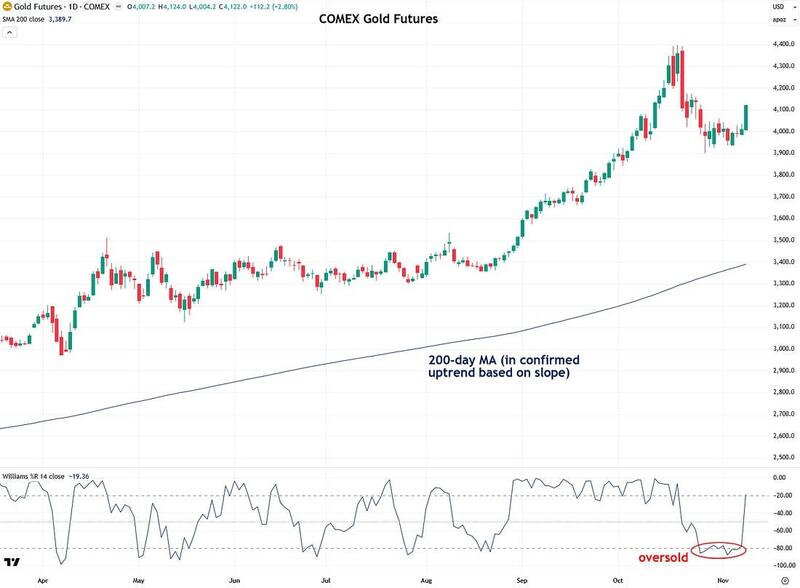
Let’s start with gold. As I’ve been highlighting, gold has been in an oversold condition for two weeks, as shown by the Williams %R indicator below the price chart, while still holding a strong uptrend confirmed by the upward slope of the 200-day moving average. This indicated that the pullback was likely temporary and that a rebound was imminent, and that is exactly what we saw yesterday. This unfolded in a textbook manner and serves as a valuable reminder.
During the pullback, I saw a noticeable number of unsubscribes and received a flood of panicky emails, but my message remained consistent: stay calm. Gold is in a confirmed bull market, and these pullbacks are both normal and healthy.
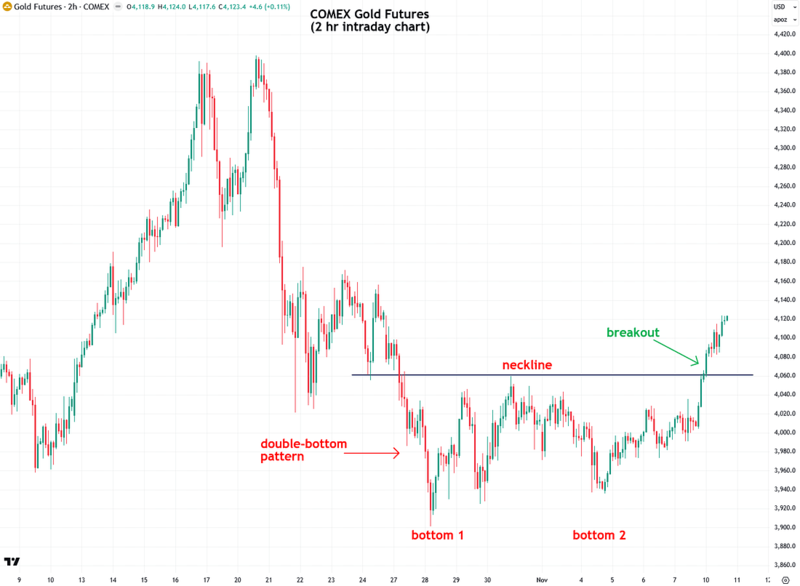
On November 5th, I pointed out what appeared to be a bullish double-bottom pattern forming on gold’s 2-hour intraday chart. I noted that it needed confirmation through a decisive close above the neckline resistance at $4,060 on COMEX gold futures.
That confirmation came yesterday, as gold broke out above that level, validating the pattern and signaling that the pullback is officially over. I love it when a plan comes together!
So, there’s a lesson here for those who are interested in my methodology of using oversold periods in confirmed uptrends to buy dips or dollar-cost average, which is to zoom into the intraday chart, for example, the 2-hour chart, and see what is happening under the hood.
If there is a consolidation or chart pattern that could break either way, first wait to see if it breaks to the upside. That indicates the pullback is likely over and increases your odds of a good entry. It also helps you avoid catching a falling knife if a slightly oversold condition leads to an even more extreme oversold condition before finally bouncing and resuming the uptrend.
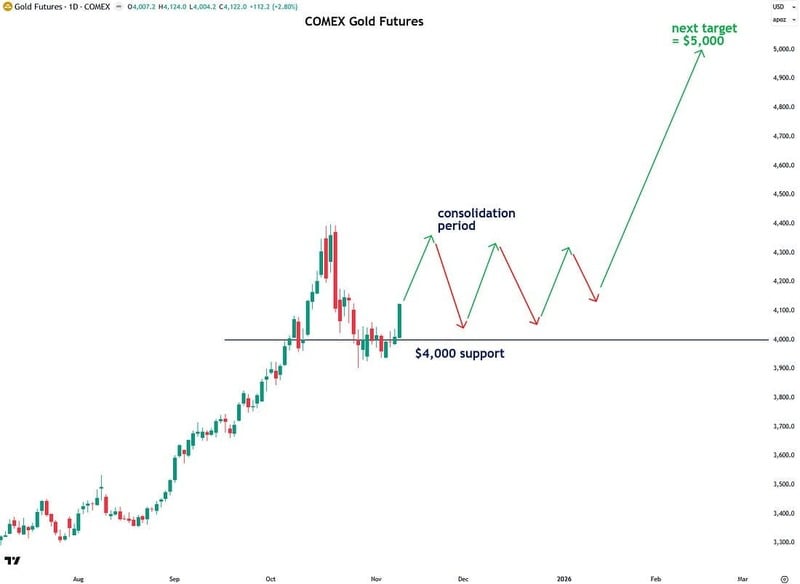
Now that gold’s pullback has run its course, I want to share my projection for what it is likely to do next. Please note that this is my working theory, not a firm prediction. Momentum is currently to the upside in the short term, so there is a good chance it will aim for its mid-October high of $4,400, followed by a slight pullback.
From there, I expect it to bounce around between $4,400 and $4,000, which I believe is now the new floor. Given the strong rally earlier in the fall, I see gold continuing to consolidate for a bit longer in a sideways range as it builds energy for its next move, with a likely target of at least $5,000 in 2026.
That $5,000 target is also shared by major institutions, including Goldman Sachs, Bank of America, HSBC, and Société Générale. In addition, JPMorgan CEO Jamie Dimon, who is not much of a precious metals fan, recently said that gold “could easily go to $5,000 or $10,000 in environments like this.”
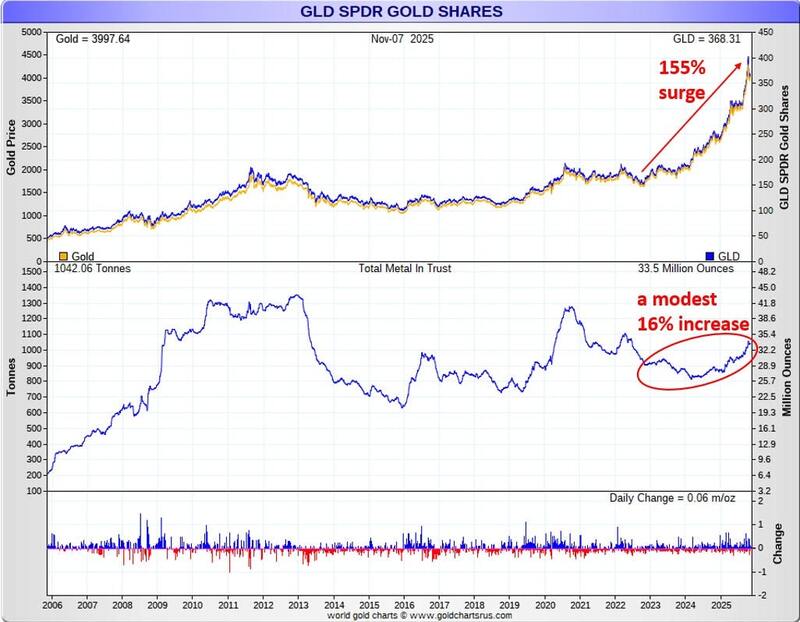
What really supports the bullish case for gold and why this bull market is still in the early stages is that American investors have been slow to participate, even despite the strong price increase. This can clearly be seen in the holdings of the popular GLD ETF, which have increased by only a modest 16% since gold’s bottom in October 2022, while gold has surged 155% over the same period.
I believe that as gold’s bull market matures, it will gain more attention, and American investors will move into it more aggressively. This should be clearly reflected in the holdings of GLD and other proxies of American investor participation and sentiment.
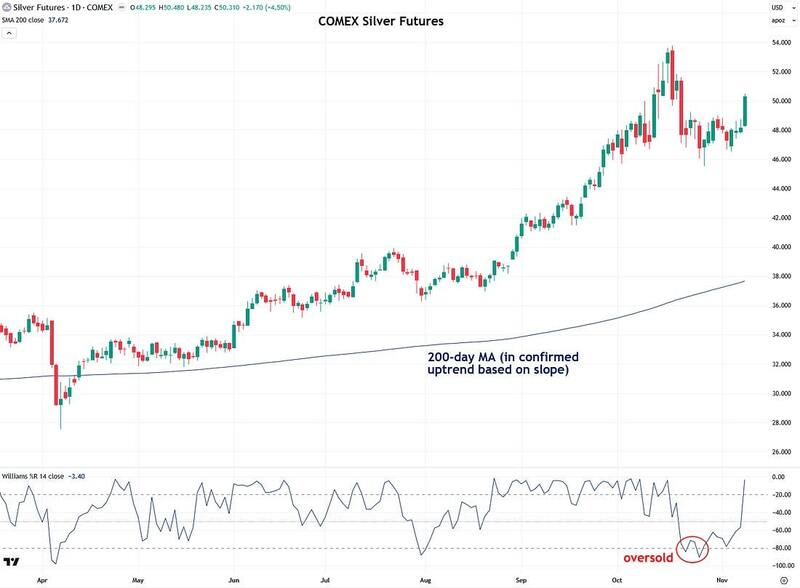
Next, let’s look at silver, which briefly became oversold in late October while still holding a strong confirmed uptrend, as indicated by the upward-sloping 200-day moving average. This was a clear bullish signal. That signal proved correct, as silver jumped an impressive 4.5% yesterday, erasing a good portion of its mid-October pullback.
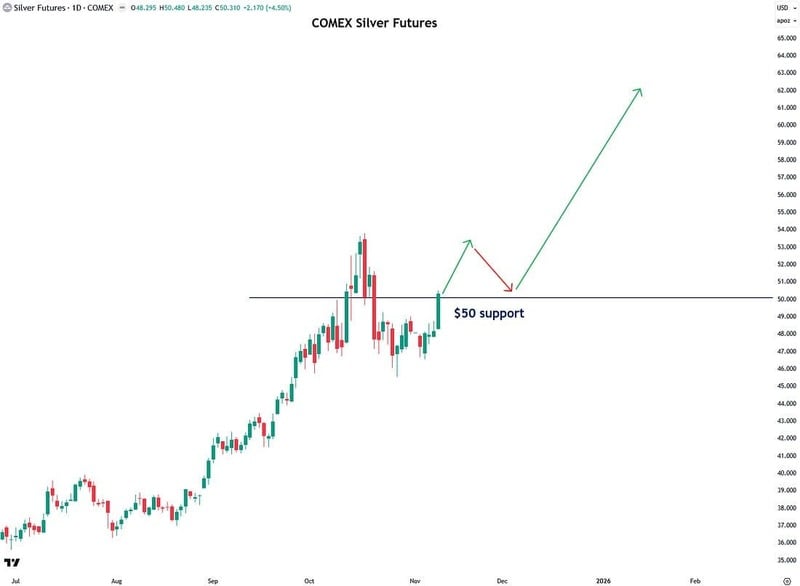
Even better, silver is now trading above its key $50 level. I would like to see silver move further above $50 for added confirmation, but it is looking very strong, and I am confident that we will soon be looking at $50 in the rearview mirror for good.
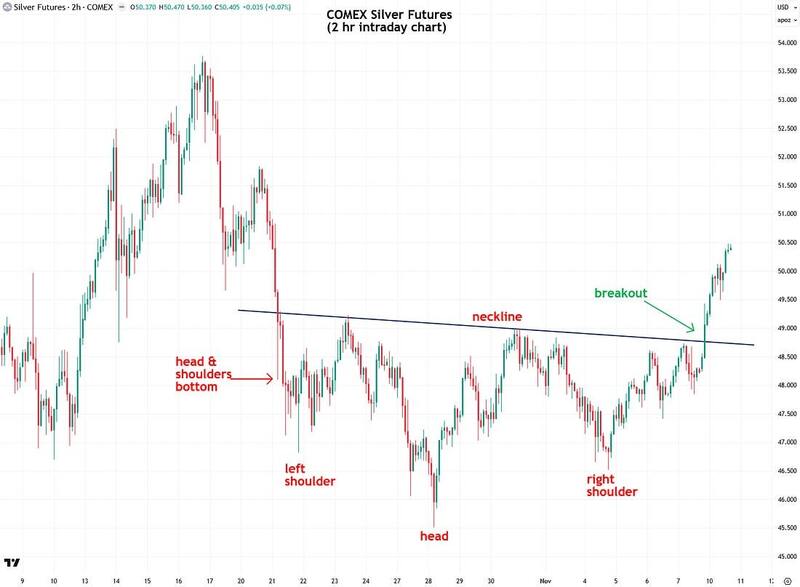
In my last update on November 5th, I pointed out that a bullish inverse head-and-shoulders bottom pattern appeared to be forming on silver’s 2-hour intraday chart, alongside a potential double-bottom pattern in gold.
That pattern has now been confirmed, with yesterday's close above the neckline resistance level signaling that the pullback is officially over. I’m very pleased with how that setup played out!
Now I want to share my current outlook for silver over the next few months. Similar to gold, I expect it to continue consolidating for a bit longer in terms of time, but without another deep pullback like the one we have already experienced and put behind us.
This consolidation is part of building up energy for the next phase of the bull market, which I believe will take silver well above $50 to $60, $70, $80, and eventually far beyond. Despite the recent scare for many investors, silver is in an excellent position both technically and fundamentally, and I remain extremely bullish on it.
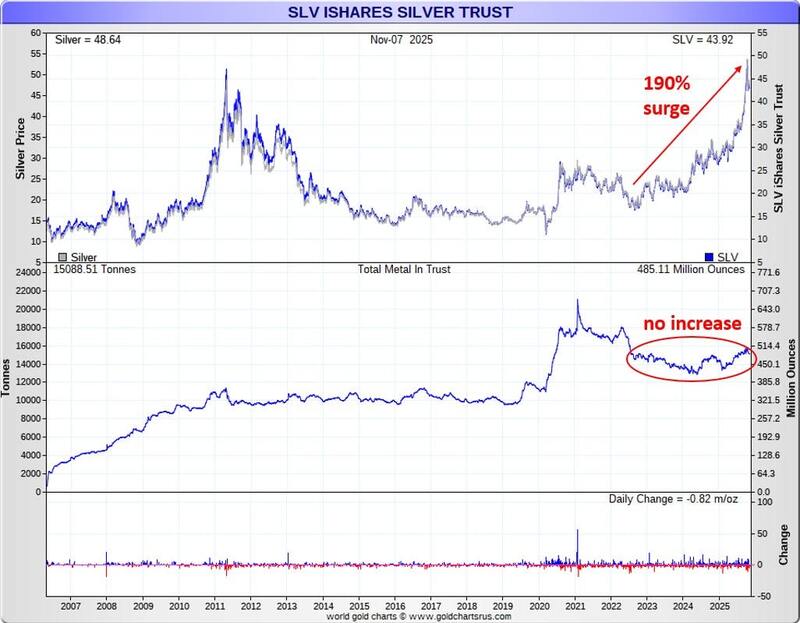
Despite silver’s impressive 190% price gain since its bottom in October 2022, there is still very little participation from American investors, as evidenced by the largely unchanged silver holdings of the popular SLV ETF. This indicates that silver’s bull market is far from being frothy or mature and has many more innings to go as American investors eventually pile in and drive it to much higher levels.
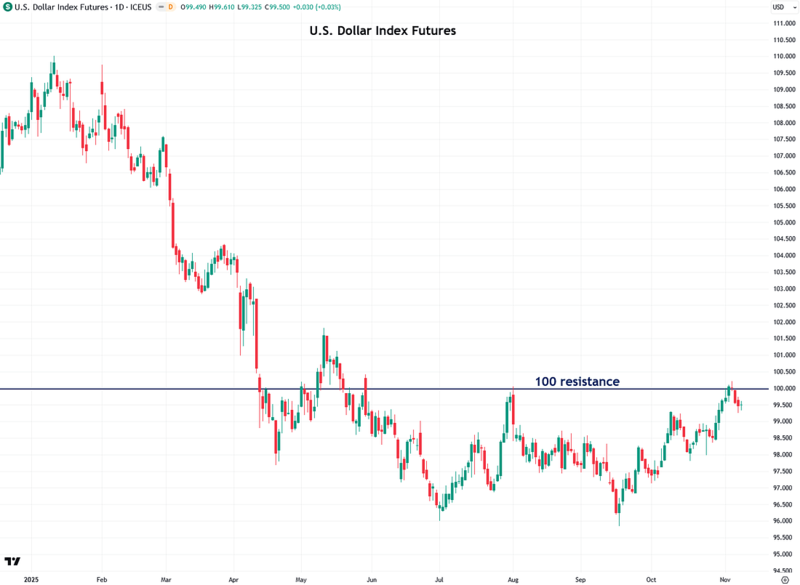
Next, let’s look at the U.S. dollar. I noted recently that the U.S. Dollar Index was approaching its critical 100 resistance level, and that its behavior at that level would be a major factor for precious metals, which trade inversely to the dollar.
I theorized that the index was likely to bump its head on that resistance and pull back, which would support precious metals—and that is exactly what has played out so far.
Now, I am watching to see if the dollar has further room to decline, which is my current bias, given how overvalued it is. If the dollar continues to retreat, that would be bullish for precious metals and mining stocks.
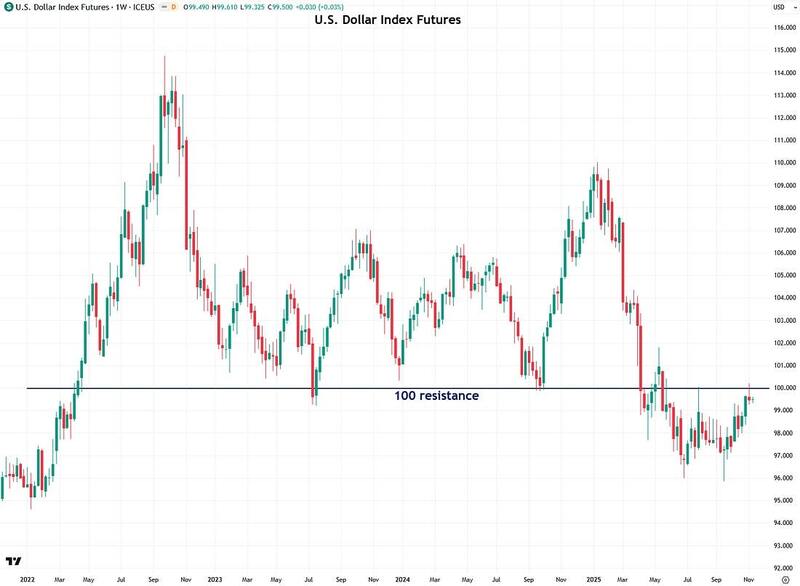
The U.S. Dollar Index’s weekly chart highlights the significance of the 100 level, which now serves as major overhead resistance. This level acted as strong support throughout 2023 and 2024, with several rallies beginning from it.
However, the index broke below it this past spring, signaling a notable change in trend. That breakdown is a key reason why I currently hold a bearish bias on the dollar.
My working theory is that the recent rebound is simply a retest of this former support—now resistance—and that the index is likely to head lower from here. That said, I always aim to stay flexible and remain guided by what the market is showing me.
In conclusion, I’m very pleased to see precious metals and miners rebound as I expected and have been discussing in my recent updates. As a result, I feel confident in saying that the recent pullback is now behind us, and we can begin looking forward again without having to stay on the defensive.
Yesterday's rebound is a textbook example of why I focus on the primary trend and stay unfazed by routine pullbacks that occur within it.
Precious metals are now stabilizing, and I expect volatility to continue receding as a period of sideways consolidation continues for a bit longer. This will allow the metals to build up energy for their next leg higher.
As always, I’ll keep you updated on what I’m seeing.
If you found this report valuable, click here to subscribe to The Bubble Bubble Report for more content like it.
********
share
share
share
share
share