
QE Is Over And Is Not working! Interest Rates Will Continue Higher As Risk Is Coming To The Fore (Part 2)
 share
share
 share
share
 share
share
 share
share
 share
share
The more official (announced) or non-official (non-announced) QE the central banks apply the more “less” valued money is added to “higher” valued, existing money! Your purchasing power is being eroded increasingly with every rescue operation from the government, diluting the amount of money in circulation! The ECB failed with the German bunds and the Swiss National Bank lost $32bn in 1Q2015. Weak retail sales in the US made yields in the US go up, fear and risk are taking hold. The Fed is failing with its policies. This is in my opinion the beginning that central banks are starting to lose their credibility.
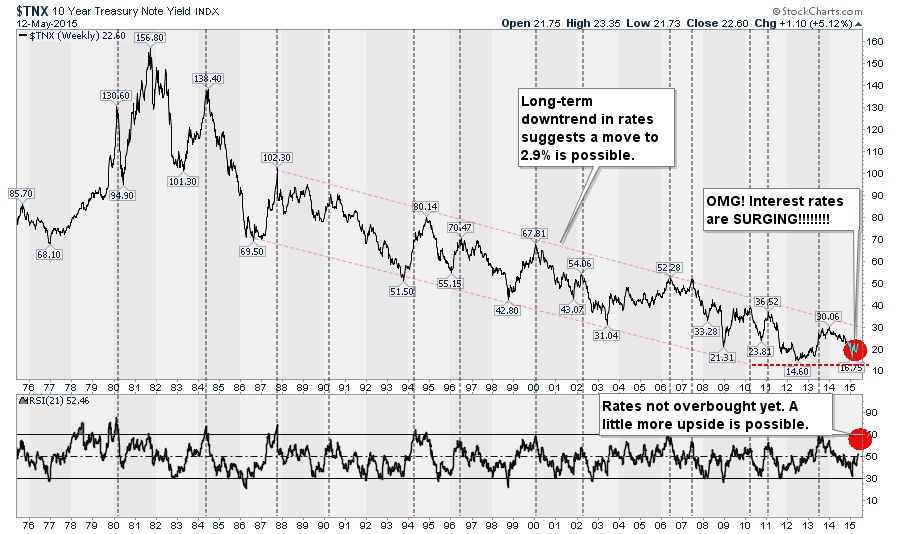
Warren Buffett believes “that bonds are very overvalued“, and a recent survey of fund managers found that 80% of them are convinced that bonds have become “badly overvalued“. The most famous bond expert on the planet, Bill Gross, recently confessed that he has a sense that the 35-year bull market in bonds is “ending” and he admitted that he is feeling “great unrest”. And the 10y treasury yield looks like it is breaking the 2.28%-2.35% level, which would probably propel the yields to the 3% level! Sustained rises above the 2.35% level for the 10-year and 3.10% for the 30-year yields, will signal a major trend change.
As we discussed before the lower interest rates go the more vulnerable they become to sudden spikes as we witnessed last week. And looking at the 10y treasury chart the downside potential for yields is much less than the upside potential. Next to that it feels like a lot of important financial indices in the market “are kept” within a range not to rock the boat too much. I am also still puzzled that we haven’t seen more bankruptcies considering the volatility and the steep moves in the US dollar, oil prices and interest yields and reported bond losses of “only” $450bn as has been reported by some sources. Remember investments are a zero sum game; there is always a loser and a winner.
As mentioned in the first paragraph of Part 1 I believe that finally risk starts to be priced into interest rates and the inability of the ECB, despite its balance sheet, to keep 10y German interest rates ultra-low triggered the awareness that government bonds are not risk-free any longer. Investors are selling their bonds despite the “QE guarantees” of the central banks because they want a premium for the loss of credibility of the central banks who are the biggest losers on their bond portfolios.
The next question is if the central banks will be able to control the bond markets when everybody is going for the gates. Although they will try to do so using all kind of measures such as derivatives (f.e manipulating the call/put ratio) etc. I don’t think they can, the bond markets are just too big. And when investors get scared they get scared and want to get out full stop. As said, in my point of view QE is over, the central banks are losing their credibility! You can only cry wolf so many times.

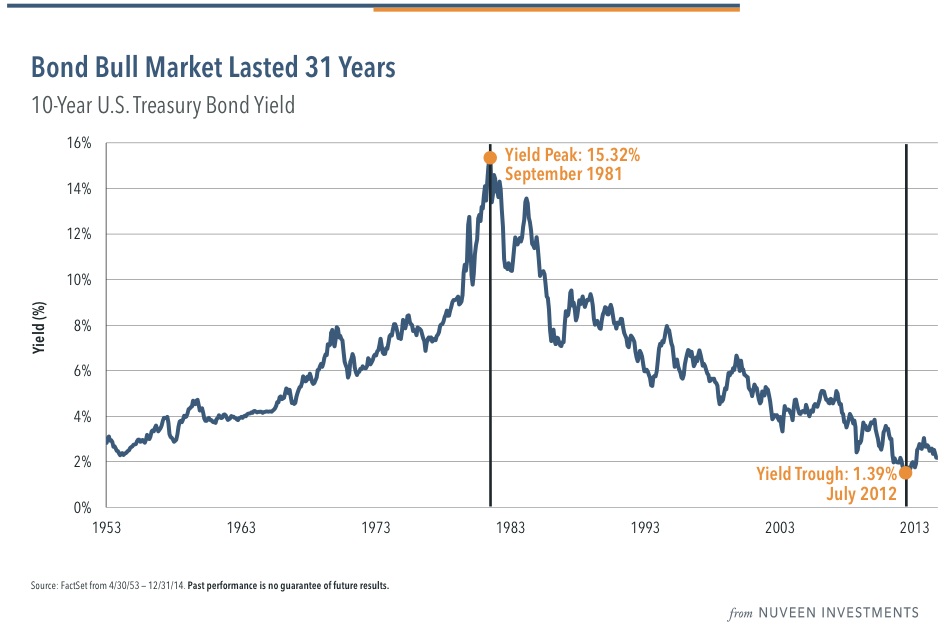
On the long-term chart of the 10y treasury yield the 3% level looks like the crucial level for a breakout of the 31-year downtrend. We all know that when we get a breakout of such a long trend range the reaction will be violent because everybody will go for the exit. It is herd behavior. And there will be no bids for the enormous amounts of bonds being offered hence interest rates will very quickly jump to 4%, 5%, 6%, 8% depending on the severity of the circumstances. It will be a bloodbath, the equity markets will also tank by 40%-80% and people’s pensions will be destroyed a la Enron. And you think the government will come to the rescue? Think again!
The following chart shows very clearly the lower interest rates and inverse correlation with the rising S&P500 since 1981 and thus also what will happen when the time of easy credit is over. And whilst in 2008 the banks were the main culprits I believe this time it will be the central banks that will be the cause of the next crash in the markets. They have been throwing “good money after bad money” not resulting in any sustainable economic improvement thereby eroding the wealth of the middle classes, ripping apart the DNA of the societies we are living in. Why? Because they, the governments, have been taking the easy way out instead of solving the underlying problems that require some courage and straight handling.
The Swiss National Bank suffered a 1Q2015 loss of $32bn! What does this mean for other central banks and their currencies!!
As a result of “supporting” the markets the central banks got a lot of bonds and equities on their books (the Swiss National Bank has $1.2bn of Apple shares on its balance sheet!!) and thus have become very dependent on the performance of the markets. And we are already witnessing the first fallouts of that policy.
Alex Pollock, who is now at the AEI (American Enterprise Institute) and was formerly President of the Federal Home Loan Bank of Chicago, has written an essay that outlines some of the operations of the Swiss National Bank and contrasts it with the Fed. The Swiss National Bank (SNB) has just announced an eye-popping net loss for the first quarter of 2015: Sfr 30 billion, or $32 billion. A participant in its recent shareholders meeting shortly before the announcement told me “the directors looked very stressed.” How does a money-printing central bank lose money? In this case, the SNB had Sfr41 billion in losses on foreign exchange positions, primarily on its investments denominated in Euros. These were bought to try to hold down the appreciation of the Swiss franc against the Euro, which in the end of course didn’t work. The losses were partially offset by Sfr10 billion in price gains on stocks and bonds in its portfolio. These were the dominating factors in the net loss of Sfr30 billion. Interestingly among smaller items, the income of the SNB includes Sfr236 million in negative interest rates paid by depositors for holding deposits with it—a revenue source that American banks can only dream of. The big loss is the result of marking assets to market—that is, using the most current market price, as opposed to “historical cost” accounting, which shows what you paid for an investment when you bought it, not what it is worth today. In its published financial statements, the SNB is required by Swiss law to mark its investments, which include its large securities and gold holdings, to market. The resulting financial statements, the SNB formally declares, “present a true and fair view of the financial position.” No American firm has to come forth with such statements, nor does the Federal Reserve. After booking the Sfr30 billion quarterly loss, the SNB as of March 31 posted a net worth of Sfr56 billion, compared to its Sfr581 billion in total assets. This gives it a 9.7% capital to-assets ratio, after the big hit. In dollars, the SNB’s capital is now $60 billion. This is somewhat larger than the capital of the Federal Reserve, which is $58 billion. The capital supports assets of $622 billion in the case of the SNB, but $4.5 trillion at the Fed, so the Fed’s capital ratio is a mere 1.3%.
The Fed can be looked at as a big-time, unhedged speculator in $2.5 trillion long-term bonds and $1.7 trillion of long-term mortgage securities, whose market values can change a lot, and will significantly depreciate if interest rates go up. The Fed does not report the duration of its investment portfolio. But a not unreasonable guess might be a duration of six years. That means a 1% increase in long-term interest rates would decrease the market value of the Fed’s portfolio by 6%, or about $268 billion. This would be about 4.6 times the Fed’s capital. A 2% increase in rates would approximately double this effect, to $537 billion and nine times the capital. Under changes to Federal Reserve accounting policy adopted in 2011, when it was ramping up its investment portfolio and realized it might experience losses, any realized losses the Fed takes do not reduce its book capital, but are hidden in an intangible asset account. This, by the way, is what the savings and loans did with losses on mortgages in the 1980s thrift crisis. Suppose the Fed had a net loss of $58 billion resulting from the sale of underwater bonds and mortgages. You would think that would wipe out its capital. That would be the accounting result for anybody else. But in this case, the unique Fed would still report capital of $58 billion. If it had realized losses of $100 billion, it would still show capital of $58 billion—with losses of $200 billion, capital still $58 billion. So fine a thing it is to control your own accounting policy. And thus we have to look at the positions of the Fed and make an estimate of its losses and determine the viability and credibility of the Fed which will eventually reflect itself in a severely weakened reserve currency: the US dollar.
As we all know this sugar high can’t be stopped because the markets have become so dependent on a continuous influx of cash “n’importe quai” the fundamentals thereby creating a very precarious situation. They, the central banks and governments, have too much too lose with all their bond and equity positions on their books as we have seen with the Swiss National Bank. It is a vicious circle. The central banks have become a prisoner of their own creation! And what happens when people are forced off their addiction you get “withdrawal” symptoms! And a withdrawal it will be!!

Where do you think the money is going to when the equity, bond and housing markets collapse? Cash? Think again? Banks will do bail-ins. Have gold and silver in your personal possession not in the bank!
Where do you think the money is going to when the equity, bond and housing markets collapse? Cash? Think again the banks will be bankrupt (see Alex Pollock’s note about the SNB and the FED) and they will put bail-ins in place!!! There are basically only a few places where you can preserve your money and then you still have to be worried for confiscation. Because if it is in the “interest of the people” it will be seized! That is why I believe silver would be the better bet because gold could be confiscated to anchor a new monetary system hence why one would invest in the closest proxy to gold: silver. Next to that when the PM market continues its Bull Run silver always tends to outpace gold in terms of performance. The long-term historic gold:silver ratio is around 12x versus 70x on May 14.
Welles Wilder, the famous market technician and founder of the Delta Society International, is forecasting $4700 gold!
The following chart below is taken from Welles Wilder’s work. Wilder is the father of several technical indicators that are now considered to be core indicators in technical analysis software. These include Average True Range, the Relative Strength Index (RSI), Average Directional Index, and the Parabolic SAR. Since this guy is considered one of the gurus in technical analysis it is worthwhile listening to him. The $4,700 gold projection by Delta Society International is a so-called delta long-term #1 target, which is where the biggest moves take place. The chart below also shows that there have been three major turning points so far in gold’s 16-year bull market.
You can see the first buy point that was triggered in the gold market in 2001 at $255. You can also see where the sell point was triggered right near the high of $1,923.70. But now we have a buy signal that has been triggered at $1,141.60. First target for gold according to this chart is between $4,500 – $5,000 or $4,700. Some people would not be surprised to see this target bing achieved in a violent manner that will shock the financial world, meaning that the $4,500 - $5,000 target will be reached in 2016 surprising on the upside. Considering all the excesses we are witnessing in the equity, bond and housing markets following the QEs and the central banks losing their credibility this is definitely not outside the realm of possibilities.
We are witnessing a repeat of the gold and silver price movements of the mid-seventies
As I have mentioned in previous articles we saw the vicious 47% plunge in the gold price to $110 in the period 1974 – 1976, after gold had spiked from $35 to $204 (+482%), in order to climb to $850. Since 2001 prices increased from $255 to $1,923 in 2011, a gain of 654%. Subsequently prices corrected by 41% from $1,923 to $1,130 in Nov 2014. It is merely “reculer pour mieux sauter”, stepping back or consolidating in order the jump further. The 2011-2015 cyclical bear phase has been longer in duration than that of the seventies, following the massive capital injections and manipulations by the central banks. The length of this cyclical downturn in the 20+ year secular bull market for precious metals has worn out most people and only the strong believers and visionaries, the so-called strong hands, the long term investors, remain in the gold market at this point. If one compares the 1976 high of $204 with the $1,923 high of 2011 and subsequently looks at the 1981 high of $850 (4.16 x $204) a high of 4.16 x $1,923 or $8,000 could be achievable and then $4,700 doesn’t sound too unrealistic.
Needless to say that at these price levels for gold at around $1,200/oz there are hardly any gold companies that can produce any positive cash flow with all in sustaining cash cost for the industry at between $1,100-$1,300 an ounce. New exploration and development endeavors have slowed down or cancelled in the light of the unfavorable prices, well at least for the moment. In other words supply is being curtailed whilst Chinese, Russian, Indian and demand from other central banks for physical gold is bigger than ever at these rock bottom prices with paper money as we know getting more diluted by the day.
We are witnessing higher lows as shown by the HUI performance. The HUI often front runs the performance of the underlying gold and silver bullion. At present the investment performance records show the HUI Index is 10% ahead of the S&P 500 and NASDAQ Indexes and a whopping 15% ahead of the bond TLT, since the start of the quarter. On May 13 we saw gold breaking a key technical reaching a 3-month high breaking above its 200DMA at $1209.60 whilst silver broke above its 200DMA of $17.23.
The weak US economy and thus the loss in momentum for the US Dollar and the loss of confidence in the central banks, incurring huge losses even if they don’t show it, is fuelling the precious metals. Precious metals don’t have counter-party risk!
Since Monday May 11 till Thursday May 14 we have seen precious metals surging. Silver is up over 7.8% to $17.47 - its biggest such rise since Aug 2013, and gold is up 3.5% to $1,218 - its largest in 4 months. Volume was heavy too. Weak macro data such as disappointing April retail sales are suggesting further easing contributing to the US Dollar weakness. According to a note from Greg Valliere, chief political strategist at Potomac Research Group, former Fed Vice Chairman Donald Kohn says a June rate hike is off the table following weaker-than-expected April retail sales data. Kohn, who worked at the Fed for 40 years before retiring in 2010, now briefs clients at Potomac Research. They also confirm that the retail sales report, released Wednesday, hints at a weaker bounce back in second quarter growth than many economists had expected.
The US dollar, which is inversely correlated to gold prices, is breaking down from a top formation and it’s set to head lower in the weeks and months ahead. Aside from normal upward rebounds, the U.S. dollar index now at 93.50 will stay weak below 96.50. The 200-day moving avg of 90.40 is clearly in sight see chart below.
Courtesy: Aden Sisters
The reason I put the daily as well as the weekly chart of the USD Index in here is because of its importance. The inverse relationship with gold is so important not only because of the fact that the gold price is expressed in US dollars but also because I think that with increasing likelihood the US dollar will lose its reserve status. As a last resort of capital preservation and in search of higher yields the whole world fled into the safe haven of the US dollar which as a result became a very one sided bet. We reached a high on the USD index of 100.71 on March 16, 2015 after which the USD index has been falling following progressively weak economic news. And if the Fed raises interest rates or not the result will be the same. The fact that the 10y yields went up on the news that the retail sales for April were weak means that fear and risk is getting into the markets! Why? Because normally a weak number should make yields fall in anticipation of a more lenient monetary stance but it didn’t whilst also the dollar fell and gold went up. It is a clear fear trade that the Fed’s policy is not working. The QEs have borrowed from the future (like when you loan money whereby you bring future income forward since you will have to pay the loan back out of future earnings) and soon it will be payback time for the markets that have risen far beyond what is justified by the real fundamentals.
Following imploding bond and equity markets and the subsequent losses the central banks will suffer huge losses on their bond and equity portfolios, which will undermine their currencies of which the most important currency of course is the reserve currency, the US dollar. And at the moment the US dollar goes gold will fill the void till a new monetary currency will be determined. On the weekly chart the 50 and 200 day moving average of subsequently 88.94 and 82.45 are important.
Gold hasn’t risen as much as the dollar index has declined, as you can see on the chart, but according to the Aden Sisters once gold closes back above $1220, it’ll be catching up and the so called C rise will strengthen.
Next to the technical picture Investors should also consider what JP Morgan is reportedly doing amassing a horde of silver. The question is what JP Morgan’s reason is for doing so. Is it because they recognize that with all the initiatives currently being developed to create exchanges whereby the metal contracts need to be backed by the physical metal that they have enough metal to be a player in the silver market. Or is it because they recognize that a huge surge in the silver price is about to unfold?
Bill Gross, who called the bunds the biggest short of a lifetime, confessed that he has a sense that the 35-year bull market in bonds is “ending” and he admitted that he is feeling “great unrest”. This is a mathematical certainty because there is too much debt for the global economy to support. And this at a time when, until recently, there has been less than zero premium (interest) to compensate for risk!
The weak retail figures and subsequent higher 10y treasury yields are showing that fear and risk is entering the markets. The Fed policies are failing. And Ray Dalio says: "If You Don't Own Gold, You Know Neither History Nor Economics".
The world's central banks have attempted to keep the asset bubbles inflated by lowering interest rates and manipulating markets with secret purchases of assets, either directly or through proxies. Whenever markets threatened to collapse, central banks stepped in and "bought the dip," reinforcing the faith that central banks will never let markets fall. The problem for central banks is the pool of greater fools is increasingly skittish. Once the herd is no longer willing to "buy the dip," central banks will have no other choice other than to increase their buying--in effect, replacing private demand with their own purchases of assets. And this money used to rescue the markets will be “worth” less and less every time the central banks employ QE because the stimulus and rescue are not really working and as such undermine the central banks own bond and equity positions which will accelerate the undermining of their currencies, the benchmarks of wealth.
Greenspan outlined in his Foreign Affairs article: when markets go bid less, "animal spirits" may be beyond calming. Once central bank buying fails to stem the tide, markets will truly panic. At that point, central banks will have to decide to buy trillions of dollars of rapidly depreciating assets or finally let the market find its own level. Those who are confident the central banks can print unlimited money may find there are political and financial consequences to such extremes that cannot be foreseen. Anyway isn’t it amazing that this guy was in charge of monetary policy of the richest country in the world for 19 years! Things are changing, hedge yourself and buy physical gold and silver. As Ray Dalio, founder of the largest hedge fund in the world, said: "If You Don't Own Gold, You Know Neither History Nor Economics".
Part 1 of the above analysis may be reviewed here:
© Gijsbert Groenewegen, May 15, 2015
share
share
share
share
share


