
Seemed Like ‘Time Out’
 share
share
 share
share
 share
share
 share
share
 share
share
 The first part of 2016 kicked off with strong moves in just about all the markets. In some cases, like gold and silver, the moves were mostly sustained, seemingly as a new trend in the PMs. Others, like the DJIA and the yield on the 10-year Treasury, were also volatile, but being range bound their trends were broadly sideways. Then, last week, most markets all settled in a relatively narrow range; volatility was still high, but the range of movement was more limited. The exception is the DJIA which set off on a steep rally to challenge the 16836 resistance on its monthly chart – at the close on Monday 29th.
Other monthly charts discussed in the Presentation essay, seem to have their major trend reversals safe and in place. Or so it seemed for silver as well, because it was holding above $15/oz, well clear of resistance at $14.14 on its monthly chart. Then came Friday afternoon – midst option expiry and FND on Monday – the silver price plummeted steeply to bottom at $14.59, and holding near that low. If silver stocks for delivery are so critically low to call for that kind of drastic action – which is sure to have added a good number of new short positions, and more at this low price – it might be just a kick at a can to get it further down the road. It does not resolve the apparent silver crisis.
When reading the mostly concerned comments on the markets from those ‘outside the herd’ commentators, it is interesting how much their number has grown during the past few months. The signs of severe problems on a number of economic fronts have been there to see for many months, some even many years. Yet the ’Johnny’s come lately’ want desperately to get a place on the bandwagon, just so they also can claim later to have been clairvoyant well before the crisis struck. This of course is not new: happened in 2000 when Nasdaq folded, and in 2008 when the GFC hit.
Looking ahead, the future still looks promising for gold and silver; they are clear of critical support, even if they have to overcome old resistance again. Strong longer term resistance for the DJIA is rising steeply and it will have to run to catch up, or stay ahead if it does recover above nearby resistance on Monday. The euro took a beating last week on Friday, after being quiet and range bound for quite some time – perhaps part of the positive reaction enjoyed by Wall Street when crude improved in price having shrugged off the worsening demand-supply situation, which still has Iran trying hard to join the supply chain.
This recovery by crude oil reminded much of late afternoon rallies out of nowhere on Wall Street when the market had turned lower earlier in the day. One wonders whether the same fairies are now smiling on crude as well. Another cause for some speculation is how long this can last with fundamentals, including the cooling global economy, pointing crude in the opposite direction.
2016 so far is living up to what many had forecast: a very interesting year!
Euro-Dollar Chart
After spending a few weeks in a narrow if volatile sideways trend, which was not really going anywhere, the euro jumped higher when an opportunity was presented two weeks ago when markets reacted strongly all around. After holding steady near its recent high, this changed on Friday when the dollar joined Wall Street in a rush higher and the euro gave way to end the week on a low note.
The period of consolidation for most markets and a recovery for others took a really wild turn on Friday; the euro was caught up as well, break cleanly below support at line Q ($1.1109) and even closing the gap to key support at the bottom of channel KL ($1.0809). The support is not at much risk at this moment, but if the wildness in the markets continue into March, anything can happen. One should remember that Europe is still facing a major crisis with the continued inflow of migrants and a new hot spot, political or social, can erupt at any time to affect the euro.
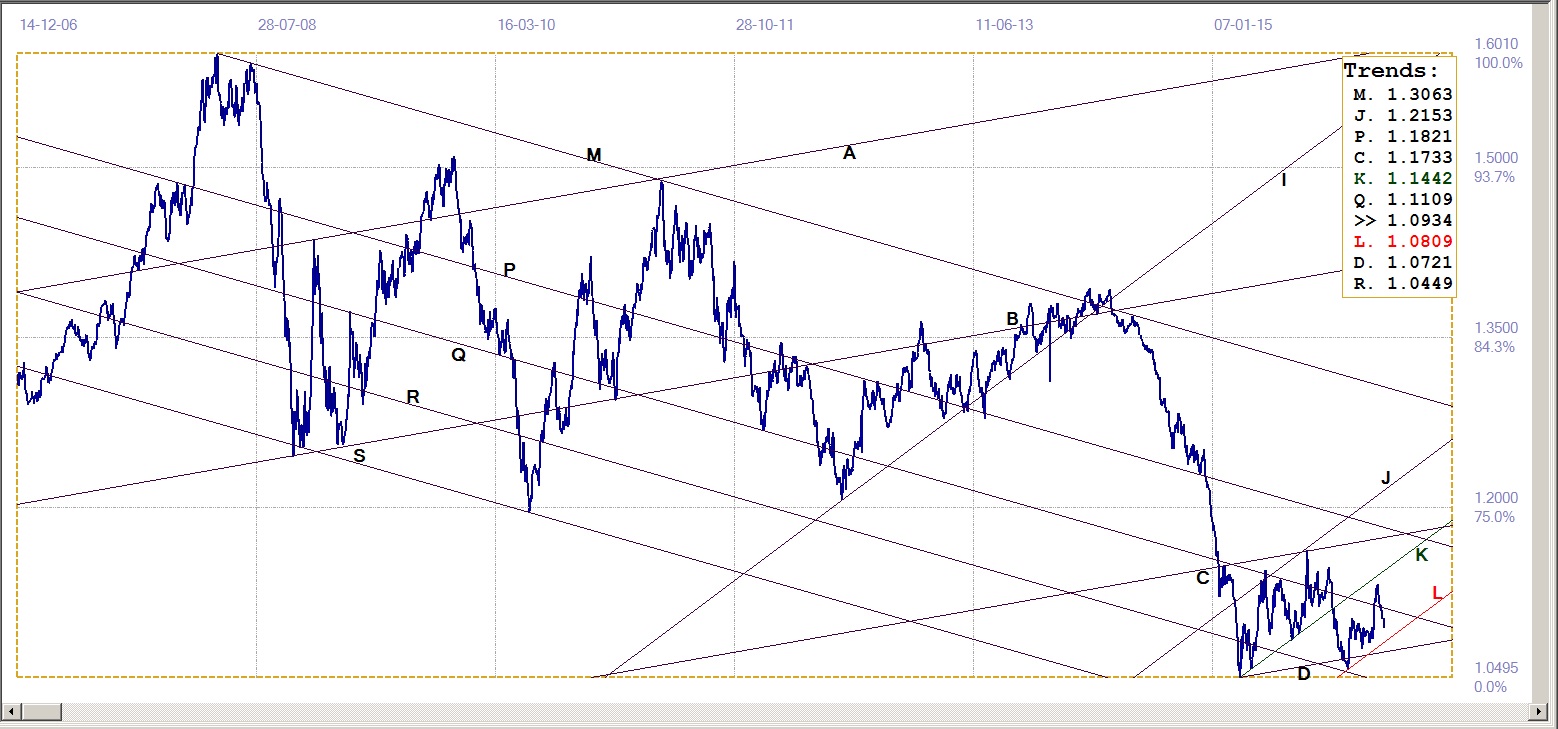
Euro-dollar, last = $1.0934 (www.investing.com)
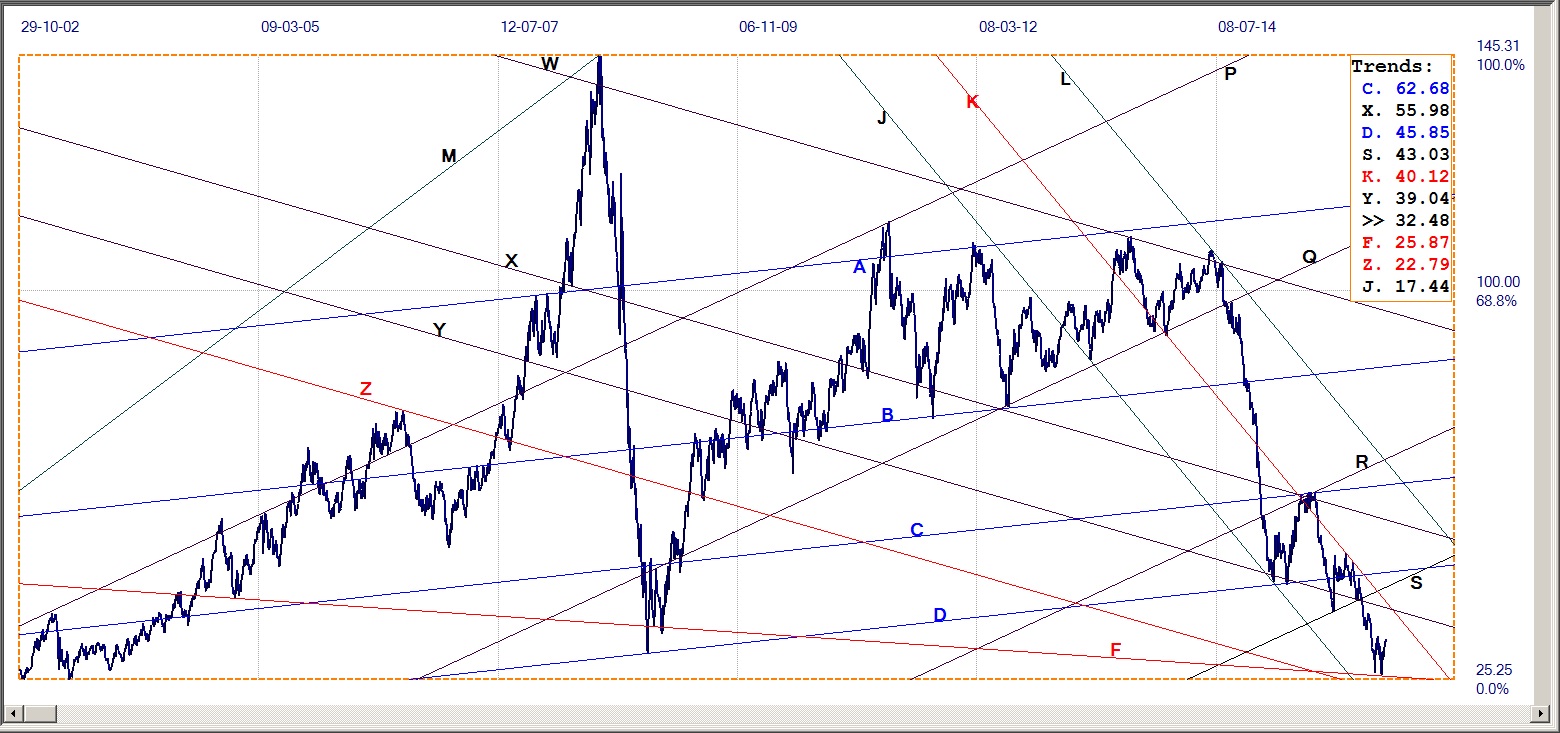
Dow Jones Industrial Average (DJIA)
The second break below steep support from bull channel VW (16574) had failed to respect and hold at support of line Z (15886) as it did previously, not too long ago, on the initial break below steep support of line W. This new break below line Z was a clear bearish signal; but, as has happened so often in the past after equally steep bearish breaks, the fairies woke up and swung their wands and made sure the good people on Main Street would not get concerned about the state of the economy.
The new rally broke back into bull channel VW; then also clear above the resistance at line K 16389) to end a little short of resistance at line B (16727), but well within reach of the key resistance on the monthly chart, at 16836. Where the DJIA closes on Monday will fascinating for the long term view, but a definite break above line B on the daily chart will open up room for further gains, perhaps even high enough to reach line L (17707).
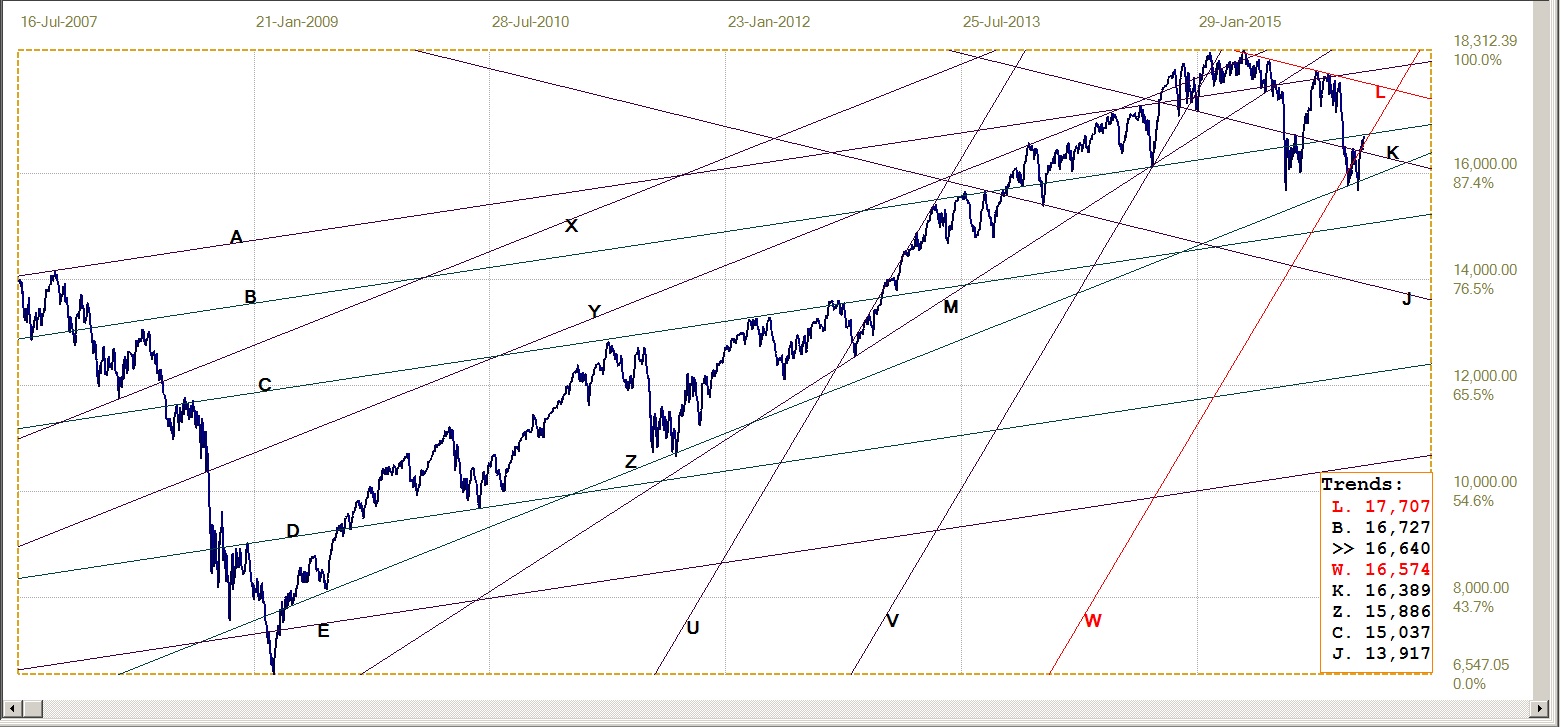
Dow Jones Industrial Index, last = 16640 (money.cnn.com)
Gold PM fix - Dollars
The persistent waterfall attacks still continue, with more than two attacks on the same day the rule rather than the exception. These often happen in two stages to catch the traders going for the early worm when they sense the waterfall has ended – thus allowing the early bird sellers to close more of their shorts on the hop.
However, despite these attacks, the gold price has not broken down permanently or even for extended periods, as was often the result prior to 2016. Nevertheless, this has the effect that gold’s rising trend has stalled and it has failed to extend its trend clear of the $1200 level.
The trend is still range bound near its recent high and has not (yet?) challenged its rising support along the bottom of bull channel KL ($1164). While gold continues to hold clear of the psychological support at $1200, it is within reach of the next level of support at line C ($1270), which is not all that far from the recent high London fix at $ 1250.75 on Wednesday.
Psychologically, the high also presents near term resistance that has to be broken.
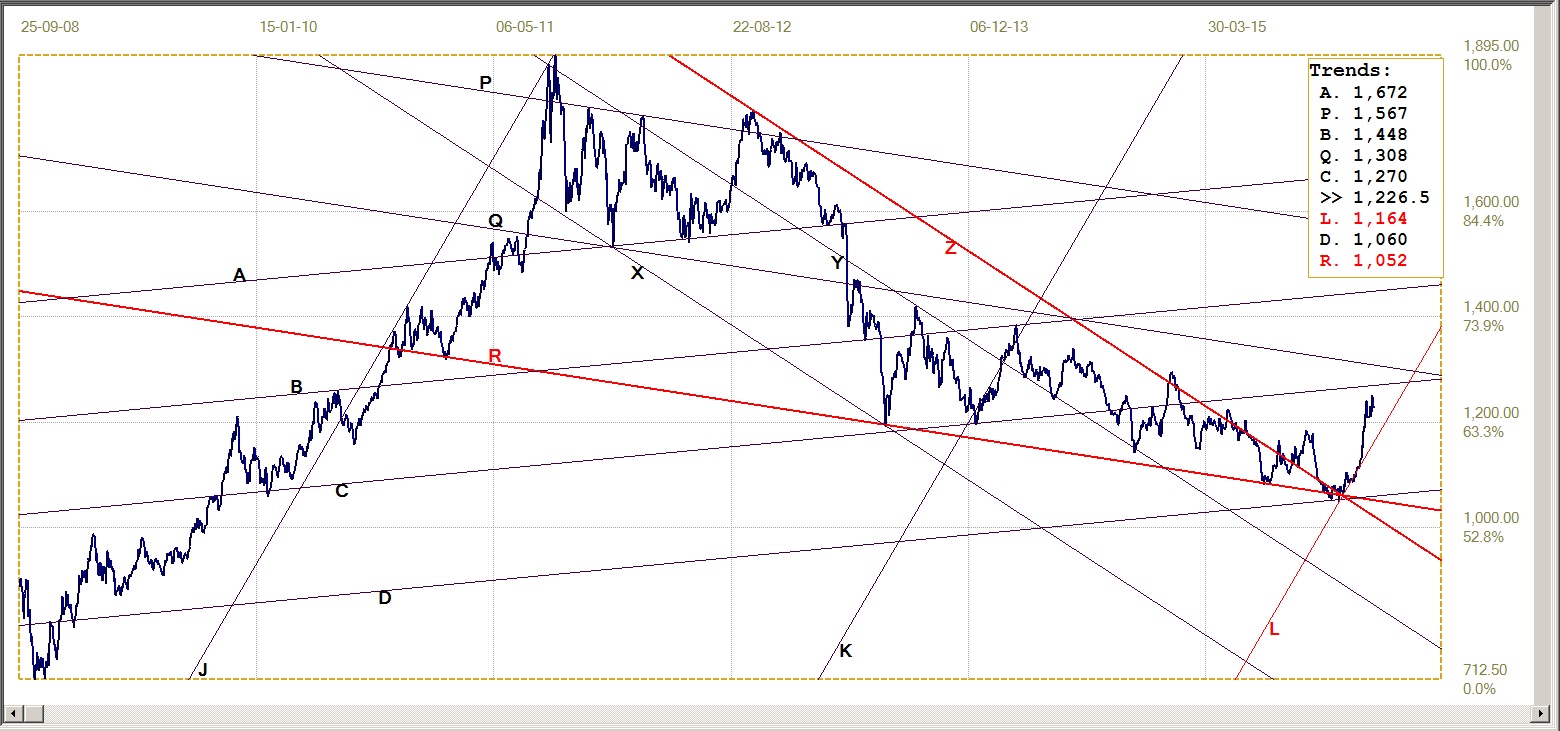
Gold price – London PM fix, last = $1226.50 (www.kitco.com)
Gold PM fix - Euro

Euro gold price – PM fix in Euro, last = €1120.5. (www.kitco.com)
The euro took a knock when the US dollar set off in pursuit of Wall Street and the price of crude – apparently having a positive effect on the former and no negative effect on the latter! – and this thereby assisted the euro price of gold to sustain its rising trend albeit at a slower pace than before.
As mentioned previously, the break from the large triangle SA (€1040) happened at the end of leg 5 of the patterns. Most often when this happens, the break higher is followed by a sustained bull market that can be anticipated to extend above the top of the triangle. That is still a looong way to go, Charlie! To achieve the target would require gold to really outperform the euro, should it be the result of a weaker dollar – else, if the euro also performs well, the gold price has to be on a real rampage.
Silver Daily Fix Chart

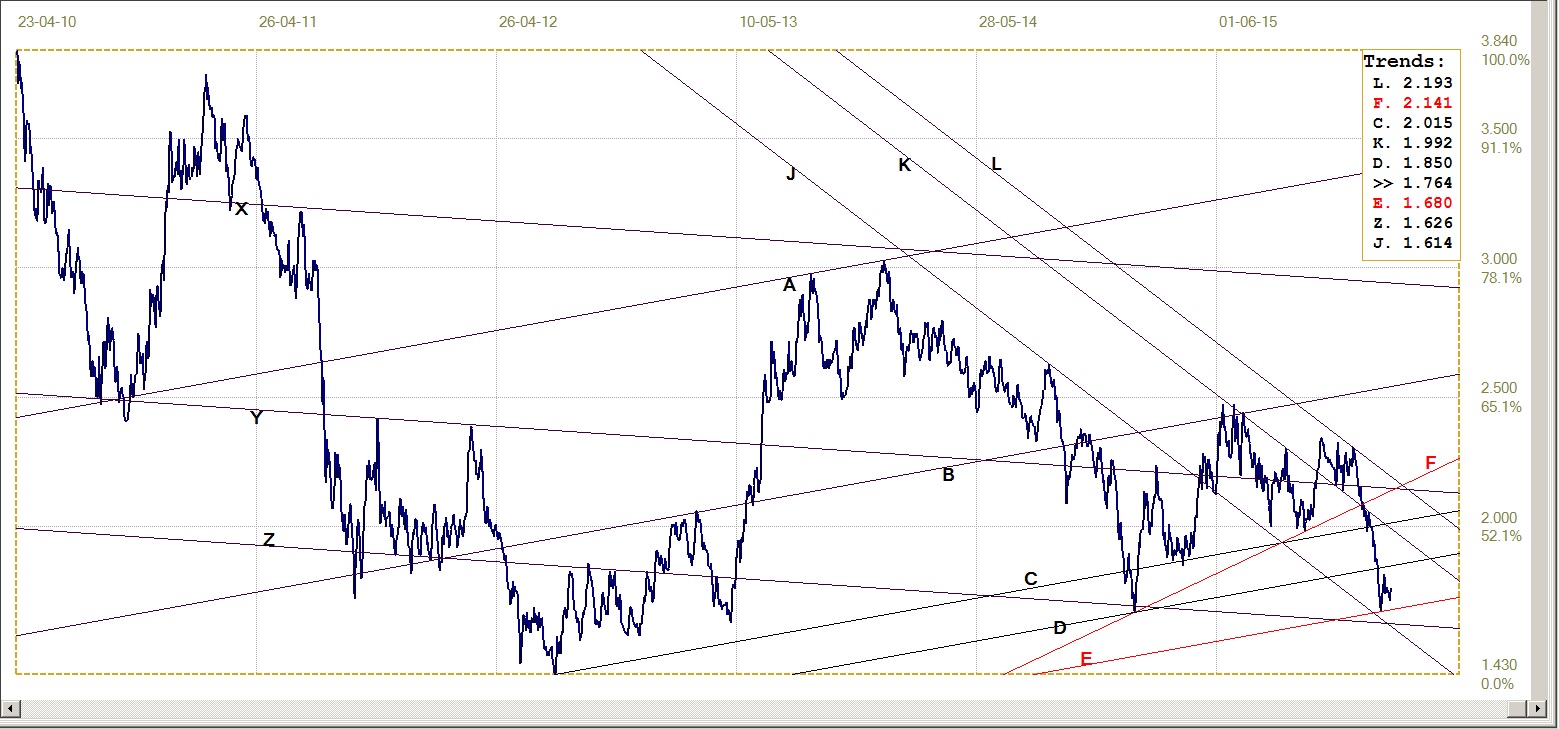
Silver daily fix, last = $15.17 (www.kitco.com)
Silver started 2016 as if shifting up to high gear, but then either the wheels started spinning or there is sugar in the gasoline, because the speed soon dropped into the sideways crawl that has taken the price to challenge support at line L ($15.17). The challenge is a foregone conclusion to result in a break lower given Friday’s close at around $14.60.
The London fix to Monday’s addition to the chart is in the middle of the trading day and it will require a small miracle from very early Asian trading to resurrect silver in time for the London fix to be above the support. Even the support on the monthly chart, at $14.14 might not be safe if there is a desperate need to blast most of the recently accumulated longs out of the market.
Silver used to be very volatile during the trading day – more so than gold – but it has gone to sleep the past few weeks; that is, except for the out of the blue great bear raid on Friday. Will be interesting to see if silver can rebound after digesting over the weekend what happened on Friday. Traders were too shell-shocked to do anything of substance before the close for the weekend.
U.S. 10-year Treasury Note
U.S. 10-year Treasury note, last = 1.764% (www.investing.com)
After retreating from the spike top the week before, the yield on the 10-year spent most of last week in a tight sideways range – just like some of the other markets. There was a brief spike lower on Wednesday when some news about crude rattled markets (before its price achieved one of those miraculous recoveries just before the close!), but this too did not last into the next day. On Thursday the safe haven was no longer in such favour as on Wednesday when the panic struck the markets.
The yield is in a trading band that, except for a brief period two years ago, is much lower than at any time in the past 4 years. Assuming that, as almost always tends to happen when bad news creeps up on the markets, that the Treasuries are seen as the most liquid safe haven, the behaviour of this market supports the negative outlook for the economy – and the probability of other, globally related, problems.
In this atmosphere of nervousness, it would not require much to trigger a sell-off – again – if again of short duration. Until the markets sandpile becomes so unstable that even some minor event triggers a major slide; which will be hard to stop after it has gained momentum.
West Texas Intermediate crude. Daily close
WTI crude – Daily close, last = $32.48 (Investing.com)
Nothing much to say really. Perhaps except that on Wednesday the price of crude oil fell steeply throughout the day, creating near panic in other markets. Which goes to show how dangerous investors perceive the situation with shale oil operators to be. Or, rather, with the banks which carry their debt. Iran is still stirring up trouble with its aspirations to gain foreign revenue through increased oil exports, even at these current low prices.
They are desperate to boost their economy and, as we know from other parties who are in desperate situations, cornered rats will do anything to keep going. Perhaps it is going to be Iran after all – now that sanctions are effectively gone – who reaches out and grasps the opportunity to create sales by lowering their price even more. Interesting times; more so than usual.
©2016 daan joubert, Rights Reserved
chartsym (at) gmail(dot)com
share
share
share
share
share


