
Silver, Gold, Debt & Taxes
 share
share
 share
share
 share
share
 share
share
 share
share
 I'm convinced – we can’t escape debt and taxes. Essentially all currency is created as debt, and our financial system creates more debt and more currency into circulation every day. Taxes are insufficient to pay the massive expenditures that our politicians deem essential, so our national, state and local governments fall deeper into debt every year. I think we can all agree – expect more debt and more taxes.
What About Silver and Gold?
National debt has increased from $3 Billion in 1913, to $398 Billion in 1971 to about $17,700 Billion ($17.7 Trillion). Debt and taxes – much more debt – are in our future. Plan on it.
The population of the US slowly increases (203,984,000 in 1970, about 322,500,000 today). Take the national debt and divide by the population to calculate a per capita national debt. Now divide the annual price of gold (annual price is the average daily price for the year) by per capita national debt and graph it.

Gold to National Debt, adjusted for population for 20 years
The gold to population adjusted national debt ratio has increased, on average, for about the last 25 years. You can see the gold bear market (1981 – 2000) and the bull market (2001 – 2011) and the correction (some will call it a bear market) since 2011.
But the point is:
- Increasing national debt is a “sure thing.” It has increased over $7.6 Trillion since 10/1/2008.
- Unless the Gold to National Debt ratio breaks down (very unlikely), much higher gold prices are a “sure thing.”
- Silver will trade up and down with gold, so plan on much higher silver prices also.
Summary:
Population adjusted national debt is increasing – inexorably. The gold to population adjusted national debt ratio will decline only if gold falls more rapidly than the national debt grows.
Will that ratio decline? It would take a further large decline in the price of gold to make the ratio decline. But will gold prices collapse even further?
Look at the following graph of the ratio calculated back to 1971. Does the bubble in the gold to national debt ratio in 1980 look similar to the increase in the ratio into 2011? Clearly not! Gold bubbled up from about $100 to over $800 in about 3.5 years back in 1976 – 1980. The rally from the October 2008 lows in gold to the August 2011 high was impressive but not similar to the 1980 rally. You can see from the graph of the ratio that the 2011 high was barely a “blip” on the graph compared to the spike upward in 1980.
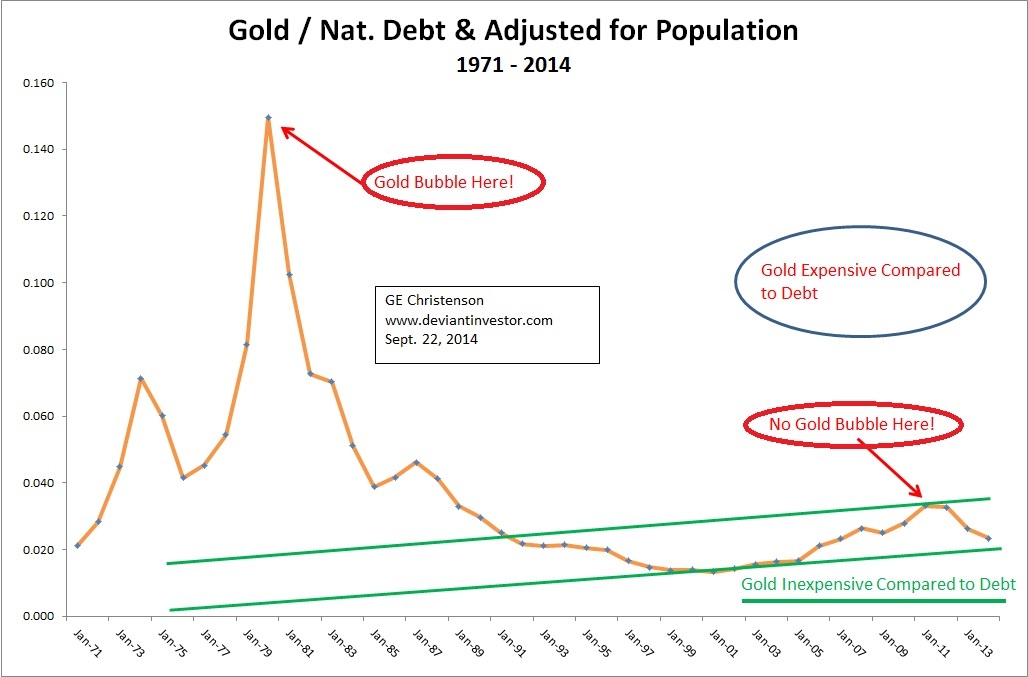
Gold to National Debt, Adjusted for Population, since 1971
CONCLUSION:
- Gold was not in a bubble in 2011. The fall to $1,180 in December 2013 (about $1,200 as of late September 2014) is just another correction similar to the correction in gold prices from 1974 to 1976.
- Gold prices are still low compared to debt as shown by the gold to population adjusted national debt ratio from the past 44 years.
- National debt is increasing rapidly, population is increasing slowly, and the gold to population adjusted national debt ratio seems likely to increase substantially from here. Hence gold prices will rally much higher, thanks to massive increases in debt, more currency in circulation, “money printing,” investor demand, higher energy prices, various worries and wars, and Asian demand.
- Will gold prices rally tomorrow, next week, next month or next year? I don’t know; the High Frequency Traders will determine most of the DAILY price action, but LONG TERM price changes will be determined by purchases of physical gold in Asia, massive “money printing” in the West, and the “wisdom” of our central bankers and elected leaders in the West.
Alternatively, congress could pass a budget that drastically cuts spending, reduces the military, slashes spending on Social Security, Medicare, presidential golf excursions, White House staff, congressional staff, CIA spending, and 1001 other governmental expenses.
If you find that scenario unlikely, consider buying gold and silver while the prices have been smashed down by our favorite High Frequency Traders.
********
For more information on gold, read my book: “Gold Value and Gold Prices From 1971 – 2021.” It is available here and here.
Gary Christenson
The Deviant Investor
share
share
share
share
share
 Gary Christenson is the owner and writer for the popular and contrarian investment site Deviant Investor and the author of the book, “Gold Value and Gold Prices 1971 – 2021.” He is a retired accountant and business manager with 30 years of experience studying markets, investing, and trading. He writes about investing, gold, silver, the economy and central banking.
More from Gold-Eagle


