
Sneak Preview: 10 Charts From In Gold We Trust 2015
 share
share
 share
share
 share
share
 share
share
 share
share
In exactly one week, the 2015 edition of the “In Gold We Trust” report will be released. It is the 9th edition (read In Gold We Trust 2013 and In Gold We Trust 2014). With a global reach of some 1 million readers, it is probably the most read gold report worldwide.
In Gold We Trust 2015 is written by Ronald Stoeferle. He is the managing partner of a global fund at Incrementum AG in Liechtenstein, focused on the principles of the Austrian school of Economics.
Although the gold report will be published in one week, GoldSilverWorlds had the privilige to “take a look into the kitchen” of precious metals expert Stoeferle. This article highlights 10 interesting charts from the upcoming report.
The gold price stabilized in 2014, after it collapsed in Q2 2013. Since then, investors have lost their interest in the yellow metal. Hence, market sentiment vis-à-vis gold is standing at multi-year lows, even multi-decade lows.
History learns that extreme underperformance in gold usually lasts for one year. If history is any guide, the gold price should recover in the foreseeable future, as evidenced by the first chart.

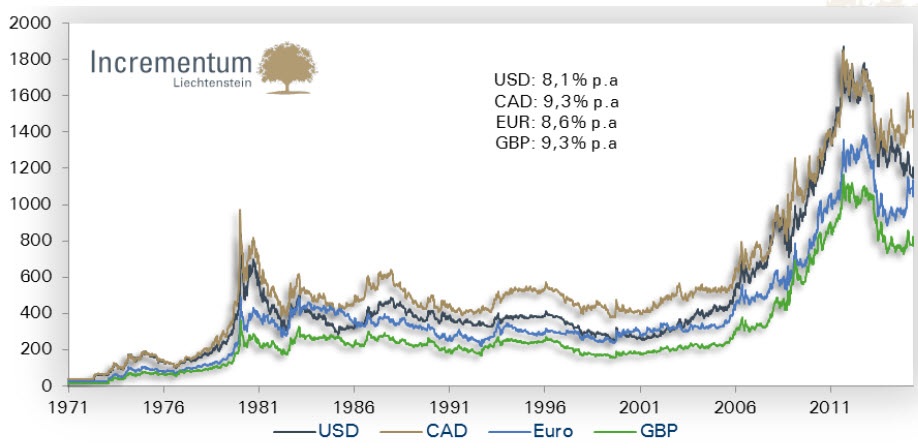
Even with the severe underperformance since 2013, gold is up approximately 9% per annum since it started to trade freely in 1971. As seen on the next chart, depending on the currency in which it trades, average yearly returns are excellent for investors with a long term horizon. In other words, gold does what it always has done throughout history: preserve value and purchasing power.
Preservation of wealth is the primary reason why one should hold gold nowadays. Monetary policies of central banks are extremely unusual … and dangerous for investors and ordinary people. The U.S. Fed could be talking about “normalization” of their policy, but as their zero percent interest rate policy is at its 7th year we are nowhere near “normal” conditions. Today, the most extreme monetary conditions are seen in Japan. It really is no coincidence that the gold price in Yen is near its all-time highs.

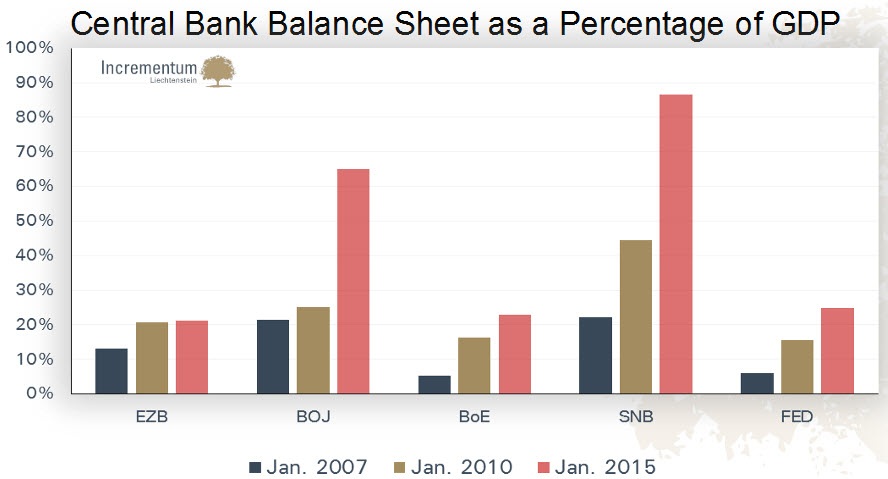
The gold price in Yen is simply reflecting the extreme expansion of the monetary base of the bank of Japan (BOJ). As the next chart shows, the balance sheet of the BOJ is approximately 65% of the country’s GDP. In other words, the assets that the BOJ holds equal 2/3 of the total economic output of the country. When compared to other regions, it looks like Japan is near its endgame.
One of the “reasons” gold got so little attention since 2013 is that investors have been focused on stock markets around the world. The U.S. stock market saw a huge rally since October of 2012, European stocks catapulted higher when the European version of QE was announced earlier this year, Japan keeps on making multi-year highs in the wake of an ever expanding monetary policy.
Meantime, however, stocks are not cheap anymore. On a historical basis, when looking at the price/earnings ratio according to the Shiller method, the U.S. stock market is trading at relatively high levels (although no extremes).

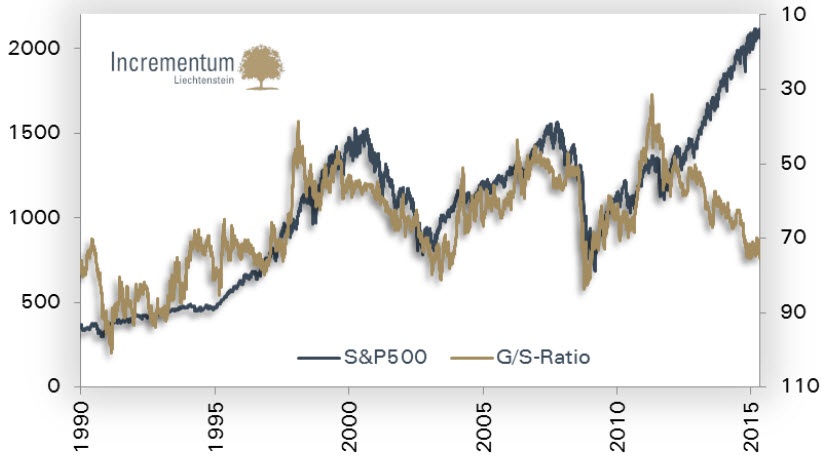
Although it is not given that the stock market is about to go south, there is always a possibility the market has topped in which case gold should start seeing positive returns. As the next chart shows, the periods in which the S&P 500 underperformed were positive for gold.

A correction in the stock market is certainly in the cards. Why? Because traditionally the gold/silver ratio is generally negatively correlated with the S&P 500. In other words, as the gold/silver ratio goes up, which happens typically in a disinflationary environment, stocks tend to fall. Over the last 25 years, that correlation has held very well, but is diverging for 3 years ago.
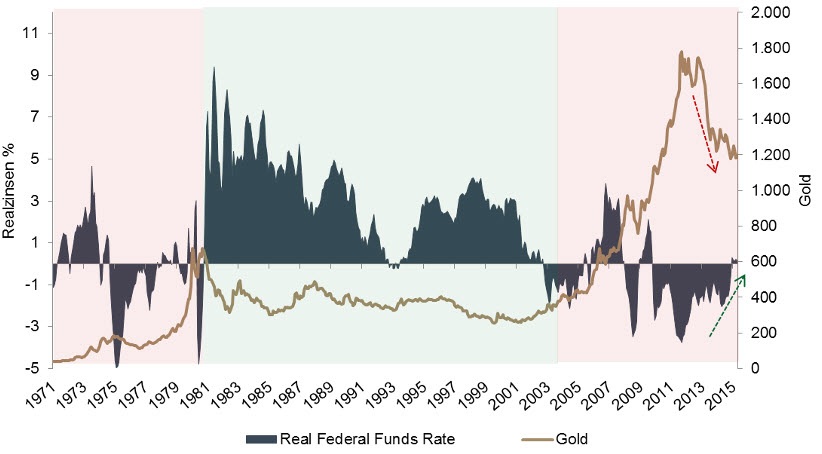
Gold is underperforming in a disinflationary environment. That has been one of the key observations in the last In Gold We Trust reports. Although the charts of recent years contained sufficient proof, the most up-to-date chart is even clearer (see below). While the real rates were standing at -4% in 2011, they have gone up steadily since then, and are again in positive territory this year. The gold price has moved in the opposite direction in that same time period.
In Gold We Trust 2015 will focus, among many other things, on the correlation between the gold price and inflation expectations. Gold is an inflation-sensitive asset. The U.S. 10-Year real yields provide an indication of inflation expectations. As readers can see, a strong divergence is in place since 2013, arguing for a strong revaluation of the gold price as inflation expectations are in an uptrend since then.

Suppose, however, that inflation expectations will weaken … would that be bad for precious metals? The answer to that question is to be found in the last chart. During deflationary periods, like the ones that started in 1814, in 1864, the Great Depression of the 30ies and the financial crisis of 2008, gold did remarkably well. It is during those periods of “financial stress” that gold shows its real value, i.e. preserve wealth and provide protection against other assets.

This article is focused on the value of gold as a financial asset. It also provides sufficient data to argue that the end of gold’s underperformance is near. Those are also the key themes of the In Gold We Trust 2015 report which will be released on Wednesday June 24th on www.incrementum.li. Stay tuned, it will be another excellent piece, full of insights and charts.
********
Courtesy of http://goldsilverworlds.com/
share
share
share
share
share


