
The Stock Market Is In The Process Of Forming A Major Top!
 share
share
 share
share
 share
share
 share
share
 share
share
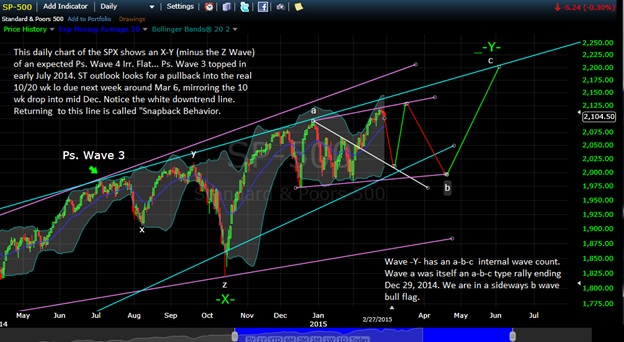
The 10/20 week cycle low is due within this time frame. The previous 10 wk cycle low (ideally 50 trading days) on Dec 15, 2014 ran just 43 trading days. The next ideal trading low is due on March 6, 2015.
Feb 24 marked an irregular topping pattern off the Feb 20 top, which in Elliott Wave terms means that after the expected fast sell-off, a fast rally should ensue. The larger (b) wave shown on the chart should tag near SPX 2008/09. The next top (wave ‘c’) should occur about 15 trading days after the Feb 24 top and that should be around Mar 18 near 2130.
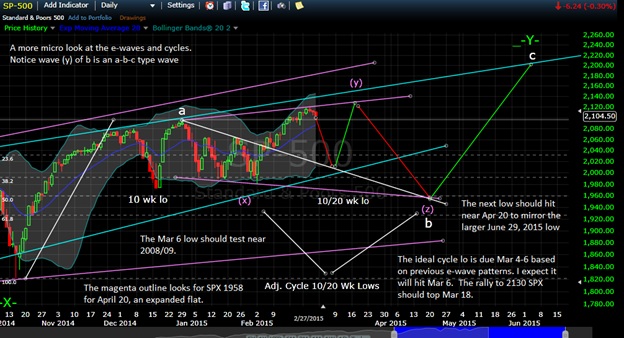
The chart below shows a more micro look at the chart. I also adjusted the expected b wave bull flag into an expanded irr. flat, which projects down to near SPX 1958/60 by April 20. There is an adjusted 10/20 wk cycle (that is a mirror of what happened last year prior to the Oct 2014 drop, which also made trading for me a lot more difficult in 2014) due between February 2, 2015 and April 20, 2015. Ideally, we should see a final top on June 3, 2015 near SPX 2200 (max) and a drop to under 1670 by around June 29 (I may need to change these dates and prices slightly as we get closer).
Note that I have labeled that expected top as a larger Wave -Y- with -X- occurring in mid Oct 2014. I label bullish flag patterns as X-Y-Z and bearish flag patterns as W-X-Y to distinguish the differences. Note also that wave (a) was an a-b-c type rally interrupted by the drop into mid Dec 2014 which was wave ‘b’ of that series.
Wave -X- was itself an E-Wave Irregular Flat (strong) with wave ‘x’ of that wave ending in early August, wave ‘y’ into Sept 19 and ‘z’ into Oct 15. That launched the market higher into the expected Wave -Y- top due soon.
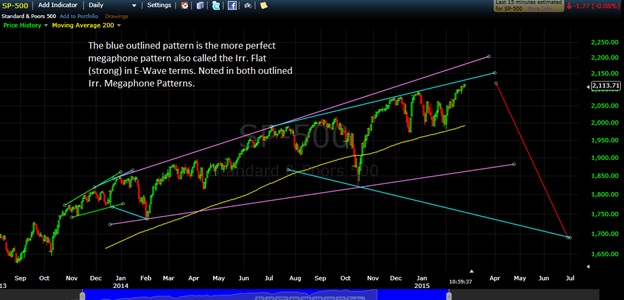
Overall, drawing an ascending line since Feb 5, 2014 connecting into the Oct 15, 2014 bottoms we have been forming a bearish broadening top formation I call an “irregular megaphone pattern”. We had a small one occur in late 2013 that caused the market to drop into the Feb 5, 2014 low near SPX 1737/38. The current one is expected to drop the SPX to below 1737 (probably near 1700 or slightly below) by late June (or early/mid July latest) to fit the 8/9 mo. cycle low pattern from Oct 2014.

Overall, once the pattern is complete, it forms a more perfect bullish broadening top pattern termed the Strong Irregular Flat (or perfect/regular megaphone pattern), which will launch a final wave into the next major cycle top due in 2018 (Benner’s Cycle). The 2018/2020-21 drop will likely rival the stock market crash of 1929/32(IMHO).
Note also that we have been in an ascending wedge pattern and broke that in Oct 2014 in what I term a ‘false break’ (we may see another one in mid April 2015). This is another sign of weakness going forward once the launch to new highs occurs as is happening right now. A large breakdown out of this type of pattern is always expected and is considered a “waterfall decline”.
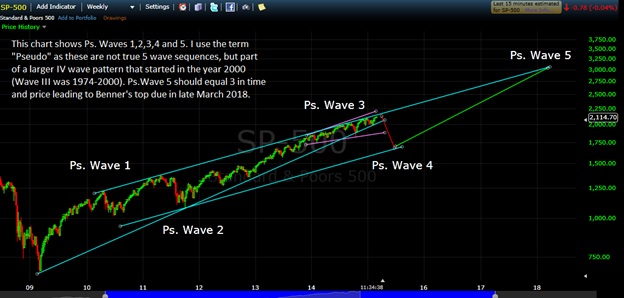
Below is a weekly chart of the S&P 500 showing the long term “rising wedge pattern” from the Mar 2009 bottom to present. Also shown, is a reformed channel that shows support near 1667 SPX in late June 2015. I also term the waves as “Pseudo” as they are not true 5 wave sequences, but part of a larger Wave IV pattern starting in the year 2000 (IMHO).
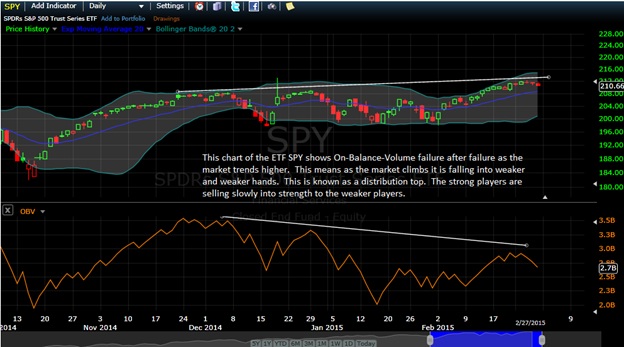
Below is a chart of the daily SPY. It shows Granville’s On-Balance-Volume clearly depicting as we go higher that the strong players are slowly distributing into weaker hands. Once we do top (probably in early June) the market will crack hard as is the case coming out of a rising wedge pattern. The fundamentals are likely going to be due to the FED either raising rates in June or giving the appearance they will do so (or possibly some other unforeseen event). This is at a time when Europe is lowering rates to negative returns, weakening their currency (the Euro). A huge currency adjustment is coming! There are also signs of over speculation at a time when there is a slowdown occurring in the economy (especially worldwide).
In the macro view, I believe we are approaching a top of historic proportions in the year 2018. The top this year should yield to a 20/24%+ bear market, but it should lead us even higher as these patterns always do. What awaits us after 2018 has me concerned the most.
********
Editor of The BluStar Market Timer
The BluStar Market Timer was rated #1 in the world by Timer Trac in 2014, competing with over 1600 market timers. This occurred despite what the author considered a very difficult year for him. Brad Gudgeon, editor and author of the BluStar Market Timer, is a market veteran of over 30 years. The website is www.blustarmarkettimer.info To view the details more clearly, you may visit our free chart look at www.blustarcharts.weebly.com Copyright 2015. All Rights Reserved
share
share
share
share
share


