
Stock Market Top, Crude Oil, Gold, USD, Real Estate And TNX
 share
share
 share
share
 share
share
 share
share
 share
share
2016 Market Overview
There has been extensive discussion, questioning the current decline and if a bear market has begun. We called the May 2015 top in the DOW last year with the decline in August 2015 as wave (1) down and the following rally as wave (2) up. The equity markets are now in wave (3) down. We published a previous newsletter which explained bubbles and parabolic advances and we are now seeing the effects of these historic advances. Parabolic advances ALWAYS end poorly and retrace the entire advance of the parabolic move. The DOW spent most of 2015 in a topping process and has now broken down with substantial downside ahead.
Our DOW Forecast from Nov 3rd 2015

We called the top in Crude in July of 2014 and confirmed the wave (c) decline after it broke the first lower trendline. We had another confirmation on Oct 9th 2014 when it broke the second lower trendline. The charts below were posted on our site on Jun 12 2014 and on Oct 14th 2014. The first Crude chart was posted when the price was still over $100. We had a minimum target of $30-$32 which has now been broken and we should see further downside to complete this wave down. Keep in mind that Crude was trading at $11 a barrel in 1998, although we don't expect to see it move this low at this juncture. Many of the oil stocks still have considerable downside ahead which have extremely lagged the decline in Crude. The continued downside in Crude could align with the expected lows for the XOI index, but if not, it could suggest that we will see a long sideways pattern after Crude bottoms in a Leading Diagonal pattern. We will determine this possibility of a Leading Diagonal pattern when Crude bottoms and compare it with the oil stocks and XOI index. We will want to determine if the XOI has bottomed with Crude, or if the XOI has further bottoming action ahead. We are already looking ahead to determine how Crude will bounce off the bottom, since a Leading Diagonal pattern will be difficult to trade. Crude may not bounce as it did at the 2009 lows.
Our Crude Forecast from June 12 2014
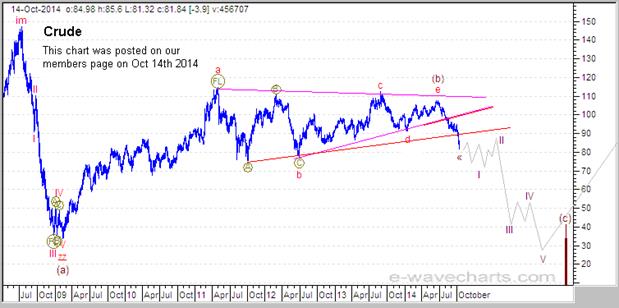
Our Crude Oil Forecast of October 14th 2014
Quick Notes on Gold, USD, Real Estate, TNX -10 Year US Treasury Yield (interest rates)
1: We are expecting a large rally in Gold, Silver and the HUI, but we should see further downside in wave V before this advance begins. The metals and associated stocks are extremely over sold and a substantial bounce is lining up this year.
2: The USD has further upside ahead in wave V which aligns with the forecast for the metals and Crude. The upper trendline for the USD is near the 103 area.
3: Our Real Estate chart indicates that a high is in place for wave (b) up, similar to the DOW chart above.
4: Our TNX chart for yields indicates further downside in wave II down, before wave III up.
The lower trendline is near the 1.8 area.
I wanted to provide an update on the equity markets since they have been in a very long process of topping in the parabolic advance, but with wave (2) up complete, the downside should continue to accelerate in wave (3) down, although we are expecting a small bounce on Tuesday Jan 19th.
I also have the Oct 2014 Crude chart above posted on the main page of the site, so I am just advising that the $30 forecast level on this chart is not the bottom. We still have further downside ahead for Crude, but we should also see a small bounce for Crude on Tuesday Jan 19th. We changed the count for Crude from the Elliott Wave above triangle pattern on the second chart back to a number of 1's and two's in the triangle pattern illustrated on the first chart.
This will be an interesting year with many long-term trends changing.
Safe investments that are guaranteed will be critical.
These charts are only a guide so that you can follow the action and monitor the expected outcome. The action could play out exactly as illustrated or it may need minor adjustments as we follow it through.
********
To learn more on the status of Gold, Silver, HUI and the USD, please visit the link below for registration details. The commentary and forecasts are updated daily, including intraday commentary and chart updates. Fibonacci pivot dates and cycle analysis are also utilized to forecast reversal dates. The indices covered include the NASDAQ, DOW, S&P 500, SOX, Nikkei, DOW Transports, TSX, BSE, KSE, AORD, HSI, DAX and FTSE. Commodity charts include Copper, XOI, Crude Oil, Nat Gas, Gold, GLD ETF, Silver, SLV ETF, HUI and/or the XAU (Gold and Silver index). Additional Elliott Wave charts cover the US Dollar (USD), EURO FXE ETF, Canadian Dollar (CAD) FXC ETF, 10 Year Treasury Note Yield (TNX), Bank Index (BKX)
With market timing and Elliott Wave Forecasts, we can be on the right side of the market.
********
Elliott Wave Chart Site
e-wavecharts.com
share
share
share
share
share
More from Gold-Eagle


