
The Topping Process Begins. The Bubble Finds Its Pin
 share
share
 share
share
 share
share
 share
share
 share
share
Volatility has now returned to the stock market after a hibernation of several years. An explosion of volatility normally is indicative of a change of trend. The recent signals transmitted by this market have been classic and has been telling us that we have entered the final topping process of this extended and stretched economic cycle. The trading over the past 7 market sessions fit a classic pattern of market panic which corrects the excesses of a market which just completed an upside climax and had been without correction for close to two years. I believe this panic is now over and the muscle memory of buy the dip will now reassert itself. That however does not mean good times will continue as the froth has now been blown off of the bubble.
Anecdotal signs of a market top have been flashing loud and clear now for the past 6 months. Since last summer the public has finally embraced this market and over the last 3 months have been recklessly plunging head long into it. Complacency reigns supreme so that after last Friday’s 666 point drop even the superstitious remained complacent.
Complacency exists due to the lack of any meaningful correction over the past 2 years and valuation levels set records with the S&P 500 trading at 26X earnings and the Russell 2000 at 150X earnings. With interest rates now in an established uptrend we now have a bubble in search of a pin…looks like it may have just found it.
We have noted before that the month of January often accommodates market tops. Gold in 1980, the DOW in 1973 and the Nikkei in 1990 are stand out examples. With the Deep State spying scandal now reaching critical mass the similarities to the Watergate bear market of 1973-1974 have become undeniable. The scandal reaching critical mass means it will now have to run its course to completion, exerting a cancerous effect upon the market.
The Bloated Market Exhausts itself
After putting in 15 consecutive months of higher lows and two years of closes above its 50-week moving average it began to feel like the market would never go down again. After prolonged rises such as this when a correction finally comes around it can unfold quite violently as this one indeed has. Most investors actually have no idea just how extended this market had become. In late December I wrote the piece on how the DOW had entered a throw over top. Throw overs such as the DOW in 1929, Nikkei 1990 and Gold 2011 where shown. We now see the resolution of the current throw over is shaping up like others in the past.
1929 Throwover Top

Note how in 1929 RSI peaked at the beginning of the year and the market was able to continue to advance until Sept 1929. This argues that today’s market should eventually be able to regroup and make a renewed assault at the existing highs. No guarantees that it will, but in the past momentum has peaked before price, not with price.
2018 Throwover Top
It is important that price immediately close up above the upper trend line or the 1929 example could develop. There is so much residual momentum in this market that it could resume its march back up towards its January highs.
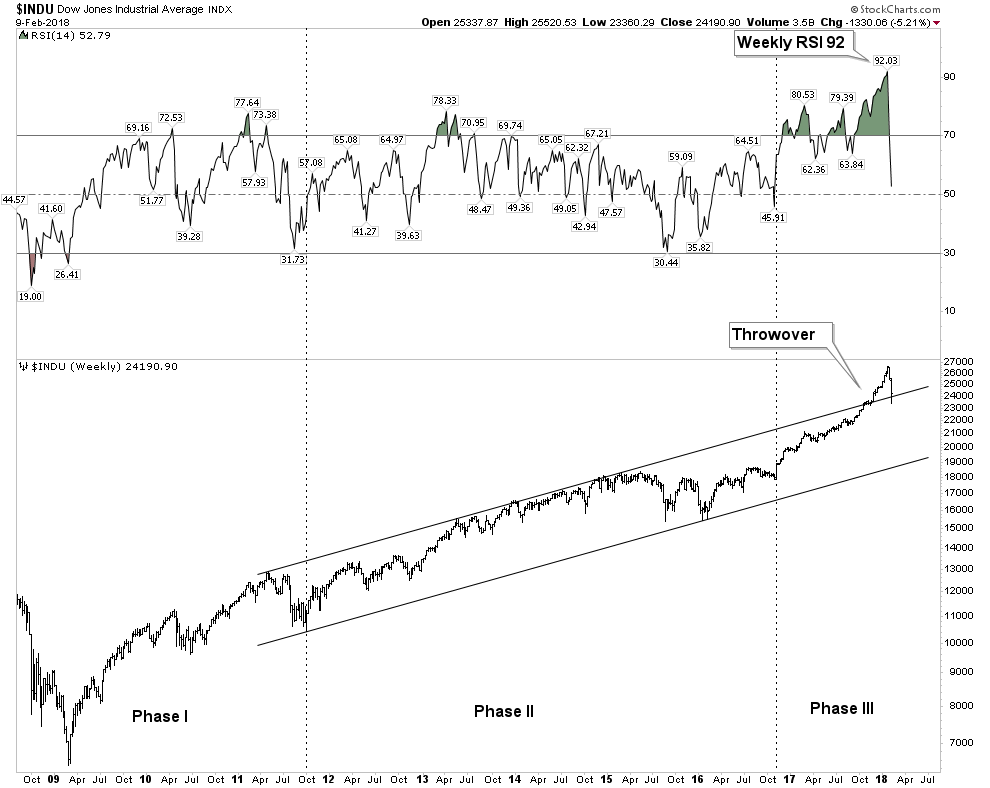
The Phase III mania top
What we just experienced over the past 3-6 months was a phase III mania top. It fully expressed itself in the throw-over. The retail public finally came in and threw caution to the wind. It is the final bull run that excites the imagination, however precious little money is made from entering the market at these times, but the bull mania is contagious and it is precisely these times that lambs rush to the marketplace and of course eventually to the slaughter. No money is made, or at least banked in the climatic months of a great bull episode. Serious money is coined by purchases made in bad times, not by chasing fading rainbows of a mature advance. But that is just what we witnessed. Just as winter follows summer, bear markets follow bull markets and the seasons continue.
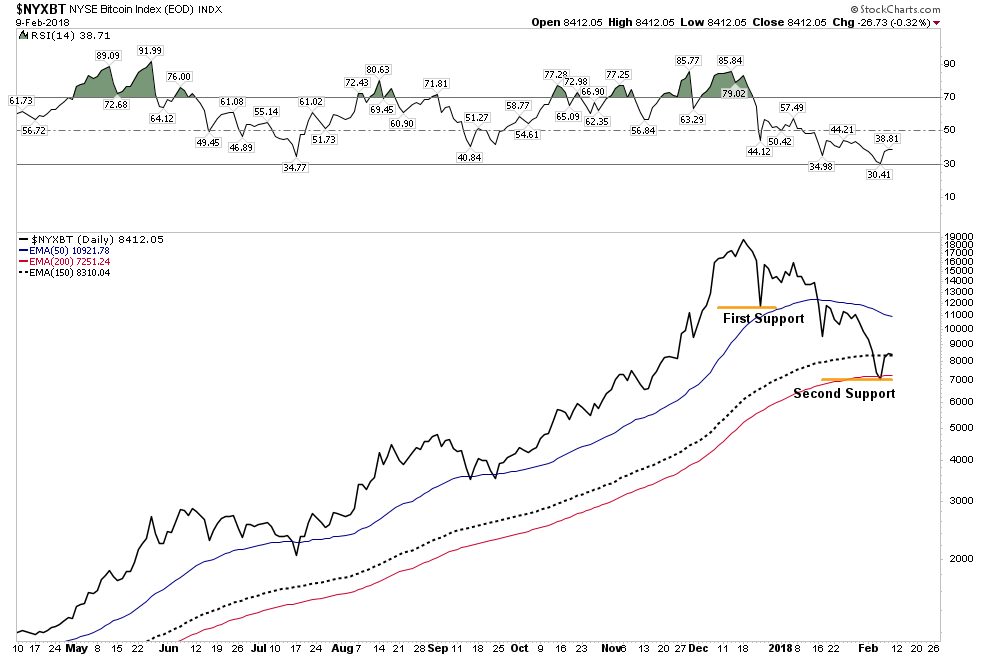
BITCOIN- The Cherry on the top of the Everything Bubble
That is the best description of the bitcoin phenomenon I have seen. Bitcoin started out as an alternative currency in response to the reckless money printing and debt monetization of the central banks. It was a legitimate libertarian attempt to address the issues of currency store of value and oppressive sovereign banking. Just like what happens to all people who get close to Hillary Clinton central bank money printing corrupts everything as well. Bitcoin morphed into a risk asset not a currency due to its violent volatility. Its store of value function has been trashed and the inherent flaw of its blockchain has been revealed to be massive electrical consumption.
If bitcoin doesn’t function as a currency what can explain its moonshot rise? It is best explained as an unintended consequence of easy-money monetary venting. Like skyrocketing art prices for the rich, bitcoin became the preferred vehicle of money flows of the young tech savvy libertarian crowd. Simply another case of excess money printing having to go somewhere. It has now had a quick 70% drop, but holders are still holding as there has not yet been any capitulation. This argues for lower prices ahead.
The slaughter of the cyptos is part of the process of wiping the froth off the top of the everything bubble. This marginal investor class has now lost a lot of money and that money is not coming back into the market since it’s gone to money heaven. So when the stock market resumes its advance there will be less juice in the system to fuel its rise. It is significant that bitcoin, the most speculative asset in this bubble, peaked in the historic topping window of Dec-Jan. The peaking of the cherry on the top of the everything bubble symbolizes that it’s over.
The Topping Process has Begun
The above commentary is not saying the market goes straight down from here in a bear market. There is too much upside momentum remaining to do that. Over the past week we experienced a violent correction, but it was a classic shakeout type decline. Bear markets are slow grinding declines, the action of the past week was like a fast burning prairie fire, more typical of a correction. A clean out of the Johnny come latelys.
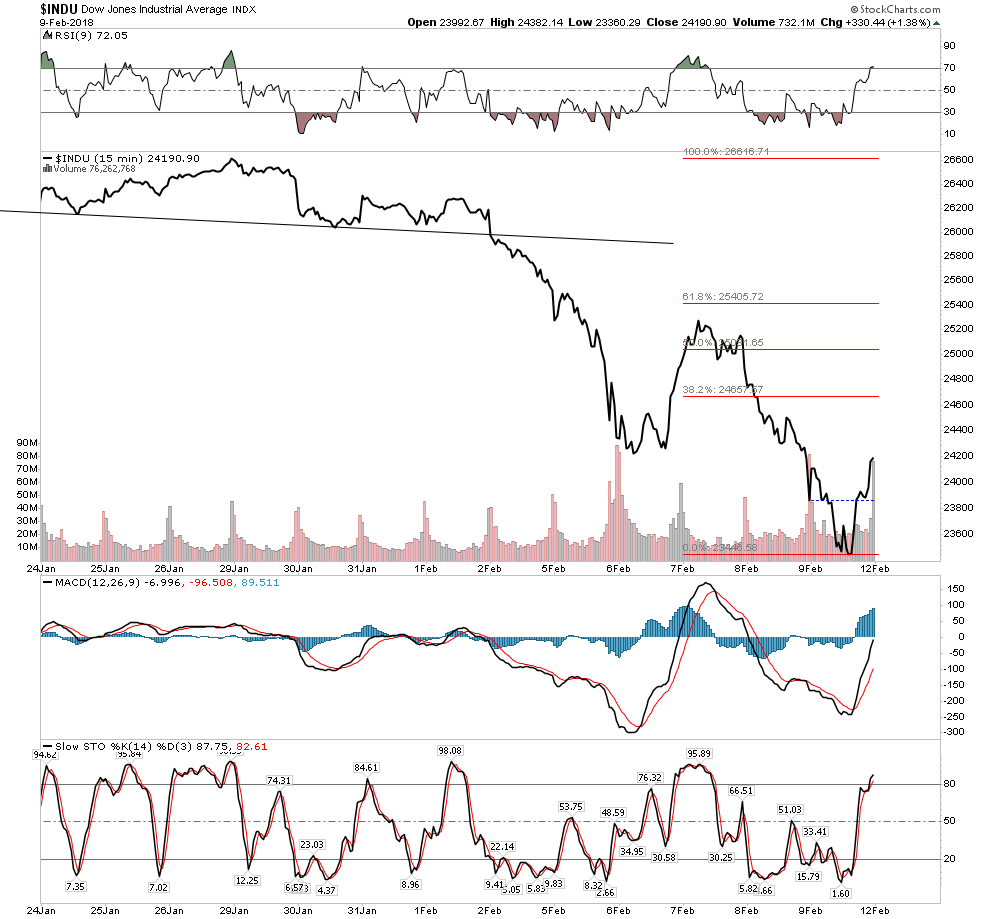
The Structure of Panic
A typical panic will have at least 4 hard down days with a 1-2 day relief rally in the middle of the down sequence. The pressure relief day typically comes after the second hard down day. The decline then resumes and the 3rd down day is typically the scariest. Finally during the 4th hard down day within the panic period an upside reversal occurs and the panic is over. This “typical” model was mentioned in the forum early in the week and is precisely what actually unfolded. Since 1000 point swings in the DOW have characterized this panic, one could continue to expect aftershocks, however I believe the worst is over and buy the dip muscle memory will now come in. The buy the dip habit won’t go away until well into phase II of the bear after plungers have been burned enough to say “no mas”.
In the current action below note the described classic sequence with the pressure relief day. Also note the positive divergence in the RSI hinting it may be over:

The line chart shows a fledgling inverse H&S bottom starting to build out.
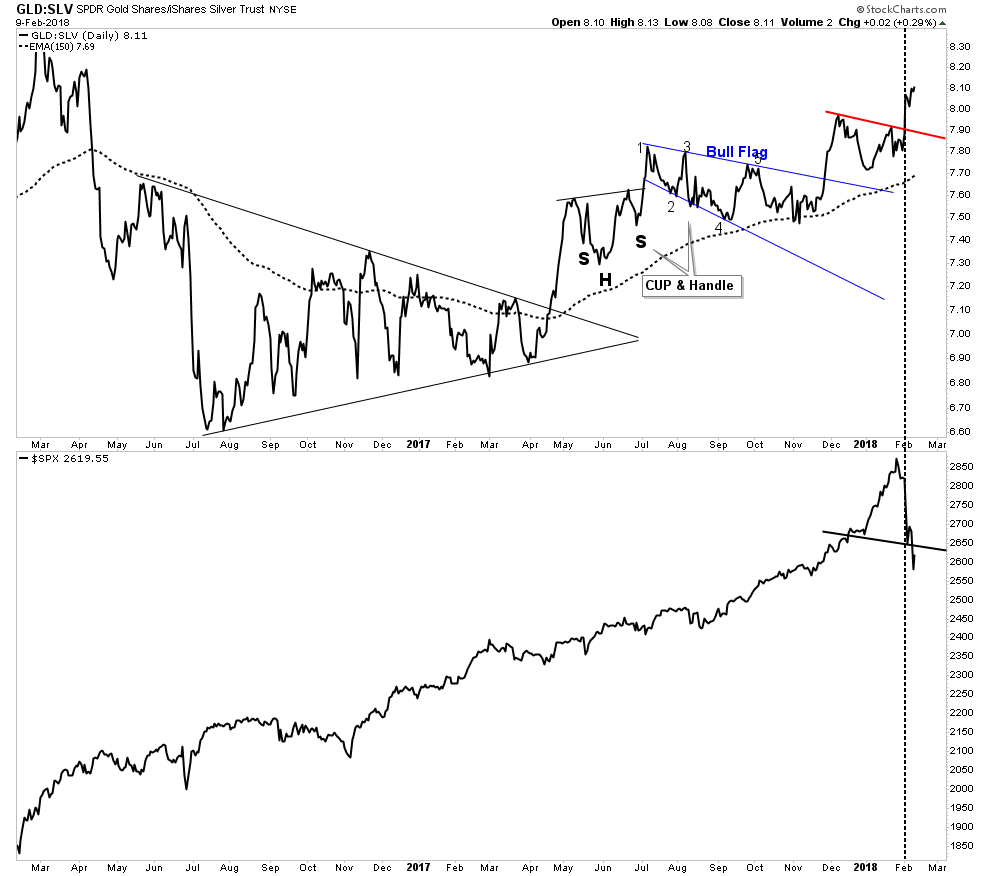
Gold Silver ratio announces trouble ahead.
This indicator has been steadily building since last April. Eventually the credit stress it was reflecting would reach a breaking point which it did this past week. We can see the clean break above the NL as the market imploded. One troubling thing here is how it shows the S&P in a broken H&S signaling it may want to go lower.
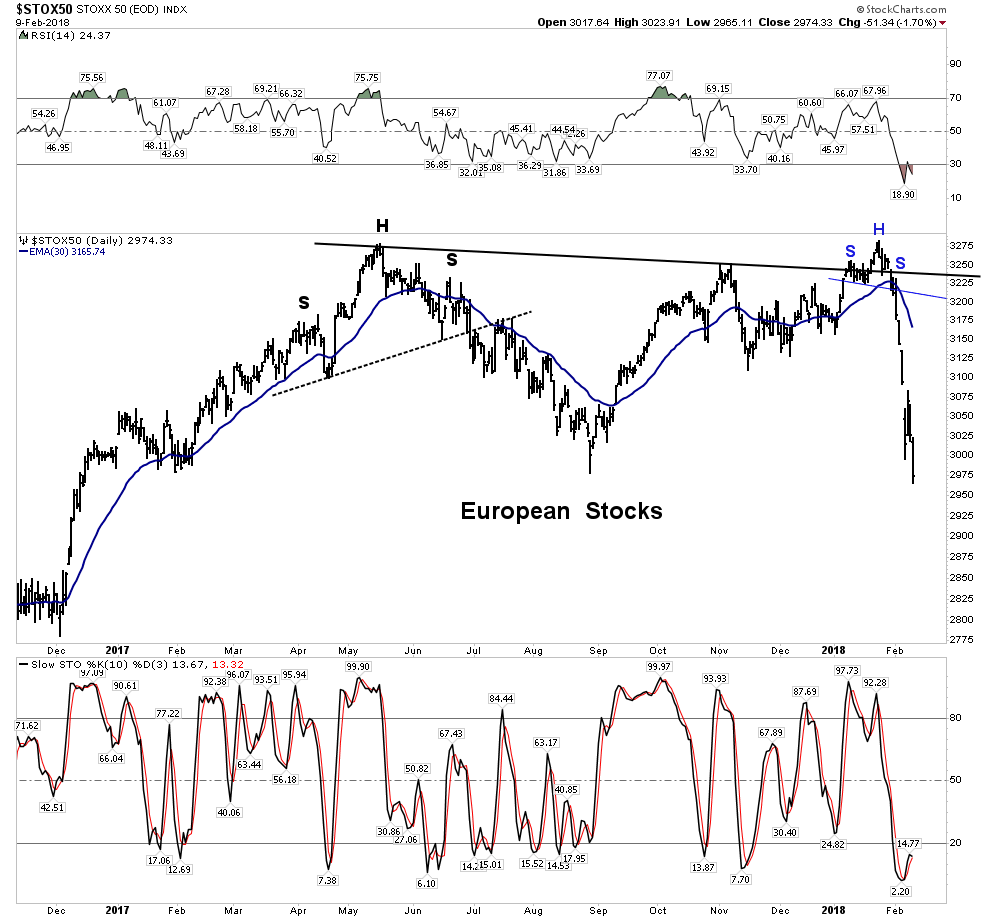
Is Europe the Tell?
The European stock market put in a suspicious looking top last May. It looked done to me, however it put on an impressive recovery. Turns out it was a head fake. The double top it just put in simply looks disastrous… an implosion. Avoid the continent across the pond- it’s a flame out.
Gold- Bottoming Action Hanging by a Thread
The rally in the gold stocks which started in early December imploded this week. There was a decent chance it could have lasted another month but succumbed to the overall market decline. After all gold stocks are stocks too. The bigger picture to review is not the stocks, but gold itself. Gold began its bull market in December 2015. In the past 42 years gold has had 6 bull markets. In those bull markets the rally coming after the first correction following the first leg up has lasted 58, 61, 55, 55, and 64 weeks long. Our current rally since December 2016 lasted 55 weeks so its par for the course. We can now expect a retrenchment followed by the resumption of Phase II of the bull in gold. In the chart below the classic buy point will be when the CCI reaches the -100 level as depicted. Once this entry occurs gold should resume its phase II. Phase II is the longest phase where the public eventually comes to understand the bull and wants in.

Gold could have a visit into the upper $1200 range

Anything above $1230 remains a healthy backtest- Shake’m out.
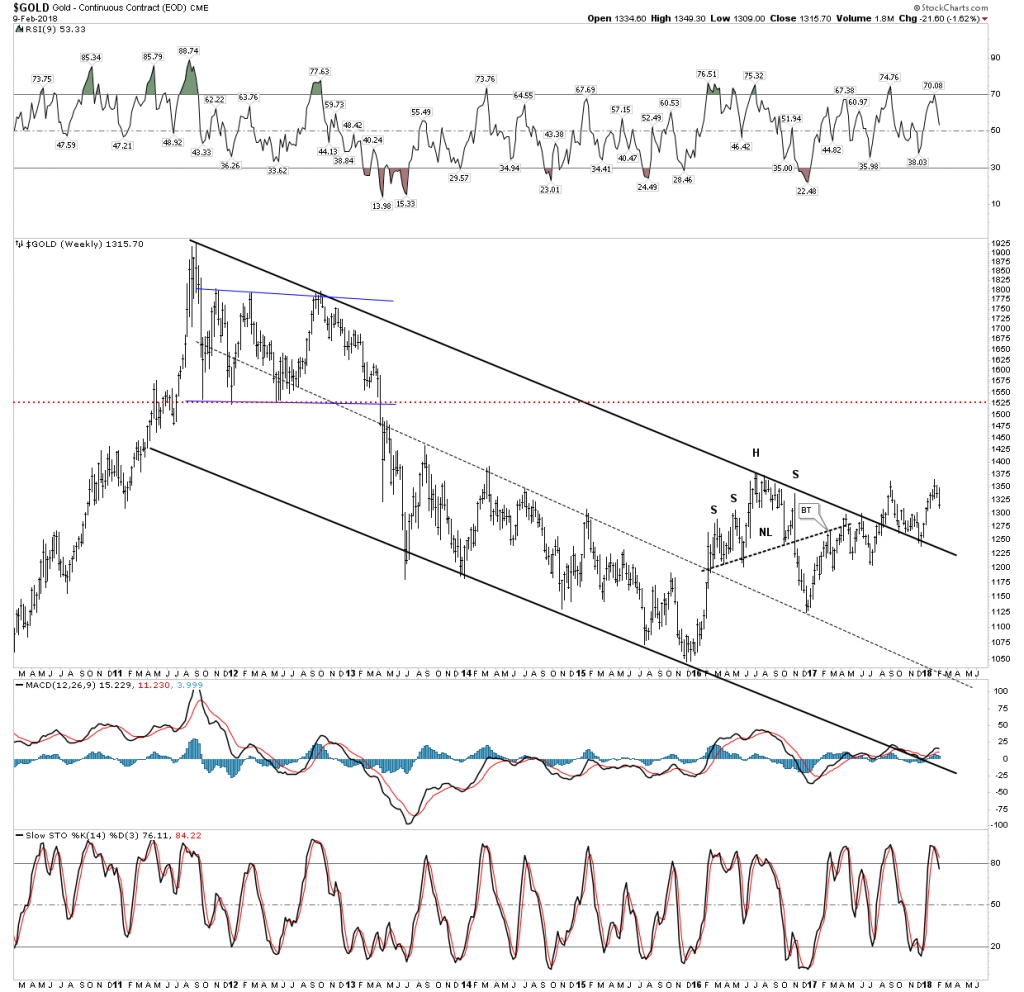
It’s been a long hard road of base building:

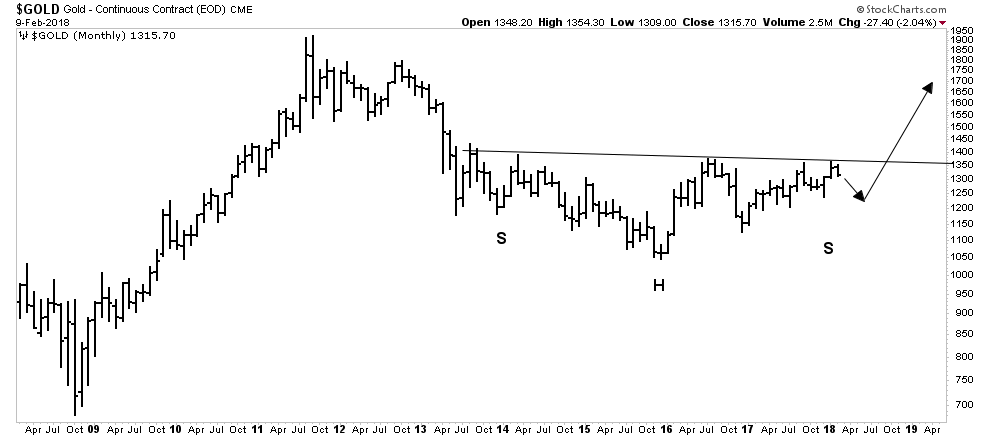
Big Picture Saucer Bottom
Keep the big picture in mind. Gold is building out a solid foundation to support a massive powerful move. Big Bases = Big Moves
The Gold Stocks
My silver/gold stock buy indicator just entered the buy zone for the first time in two years. The last buy signal was the great buying opportunity of Jan 2016. Note it is now back in the buy zone, but it has not triggered a buy signal yet. It must turn up to trigger a buy. But it’s important to know its ready to go

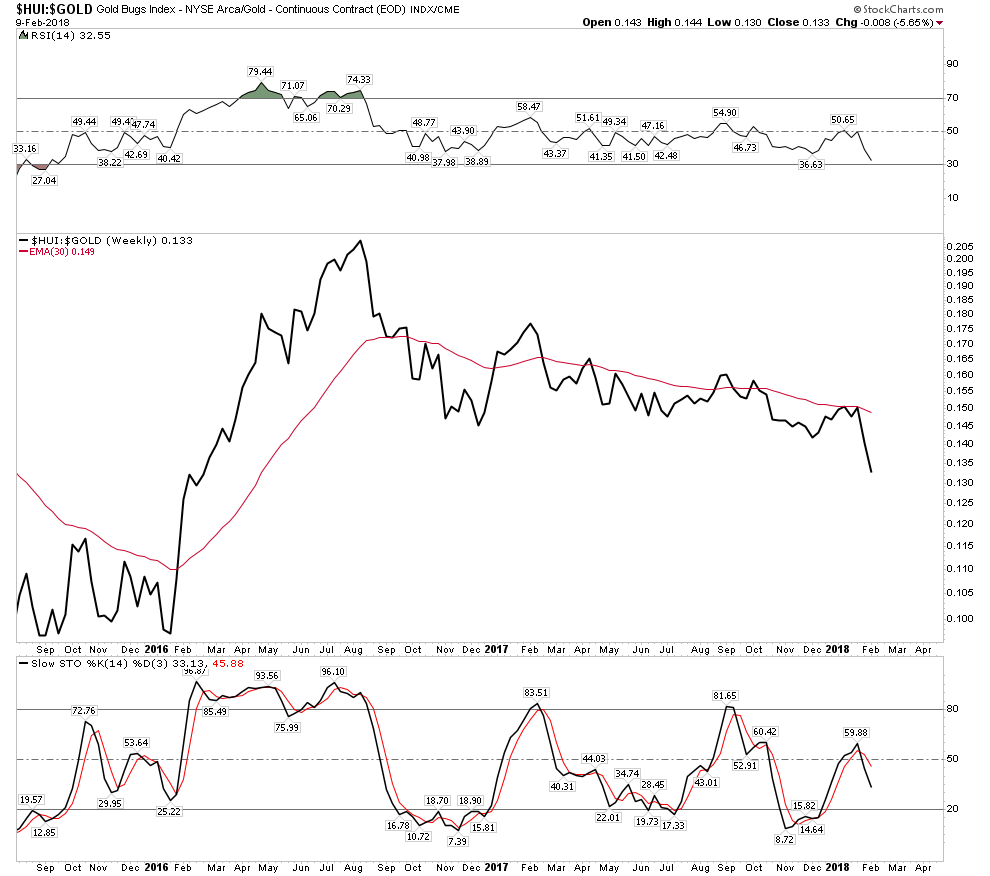
We need to combine the above trigger indicator with my gold bottoming system for a launch signal. As of now the gold bottoming system is NOT on a buy.
The most important indicator in the system, the HUI:GOLD ratio, is not green as you can see below:
*********
share
share
share
share
share
 Rambus Chartology is Primarily a Goldbug TA Site following the precious metals markets. Chartology is the Unique Blend of Technical Chart Pattern Identification and Market Psychology, Developed by Rambus During the Tech Mania of the late 1990s. His Early Training came the old fashioned way...Reading Edwards and McGee's Bible of Technical Analysis and spending years with a sharp pencil graph paper and ruler refining his skills and accuracy. Visit the Rambus Chartology website at http://rambus1.com/.


