
The Transports Are Troubling
 share
share
 share
share
 share
share
 share
share
 share
share
In Brief: The Dow Jones Transportation Average is in technical trouble, in our view, considering:
- This equity index’s position below its 200 DMA,
- A bearish Death Cross that occurred recently when its 50 DMA sliced below its 200 DMA, and,
- Its broken bull market as demonstrated by DJT’s position below its bull market uptrend.
All of this has put the Dow Transports into formal correction territory of a more than 10% decline and suggests that the sellers are slowly but surely taking control of this marketplace.
This stands out as a bit of an anomaly to the other four major U.S. equity indices that have continued to put in a series of new all-time highs, but we tend to think that the weakness showing in the Dow Transports may portend trouble ahead for all of the major U.S. equity indices.
This troubling dynamic seems particularly true against the backdrop of uncertainty and volatility inherent to the possibility of the Federal Reserve raising rates in the near- to medium-term.
Our Bottom-Line: We continue to believe that investors may want to prepare for a prolonged period of massive cross-asset class volatility in the financial markets that could resolve in a significant corrective move to the downside in the equity markets.
2015 has been a year filled with volatility for the various financial markets on trading action that is perhaps starting to answer the question posed in January’s GFG Market Insight titled 2015: The Year of Massive Volatility?
This is true in areas of the currency markets as demonstrated by the euro’s nearly 14% peak-to-trough year-to-date slide along with parts of the commodity markets with platinum’s more than 18% peak-to-trough year-to-date decline according to data provided Thomson Reuters.
But true volatility is as much about a significant move in one direction as it is about dramatic and frenzied trading action up and down in a range that resolves in what is typically a truly substantial directional move. In other words, volatile trading action often ends with either a bull or a bear market move of up or down 20%.
This was certainly true of the crude oil’s nearly 5 year-long trading range comprised of multiple 10%+ whipsaws between about $75 and $115/barrel that led to a more than 50% crash from the most recent peak in that range based on Thomson Reuters data.
In this light, there is one chart that truly stands out and one that we have been highlighting all year due to a myriad of increasingly bearish technicals centered in a 7 month trading range and that is the chart of the Dow Transports.
Unlike the other 4 major U.S. indices, the Dow Transports put in its last peak at the end of last November and one that has led to a bearish series of lower highs and lower lows that suggest the sellers are slowly but surely taking control of that marketplace.
One red flag that we highlighted back in April was the DJT’s weekly close below its 200 DMA and another indication of increasing selling pressure in the presence of waning buying interest.


Another red flag that we highlighted more recently was a Death Cross put in by the Dow Transports last month when its 50 DMA sliced through its 200 DMA on a sign that the near-term momentum is shifting to the sellers.
These technical events were of interest to us on a standalone basis with the Dow Transports down as much as 11.4% from last year’s peak but even more so in the context of the other indices putting in all-time highs.
Leaving the intricacies of Dow Theory aside, we thought and continue to think it is worth noting that this economic backbone and infrastructure-heavy equity index is in correction mode simultaneous to some of the other equity indices carving out new all-time highs after significantly smaller bouts of congestion.
This seemingly contradictory dynamic is shown best by a shared chart of the Dow Transports and the Russell 2000.
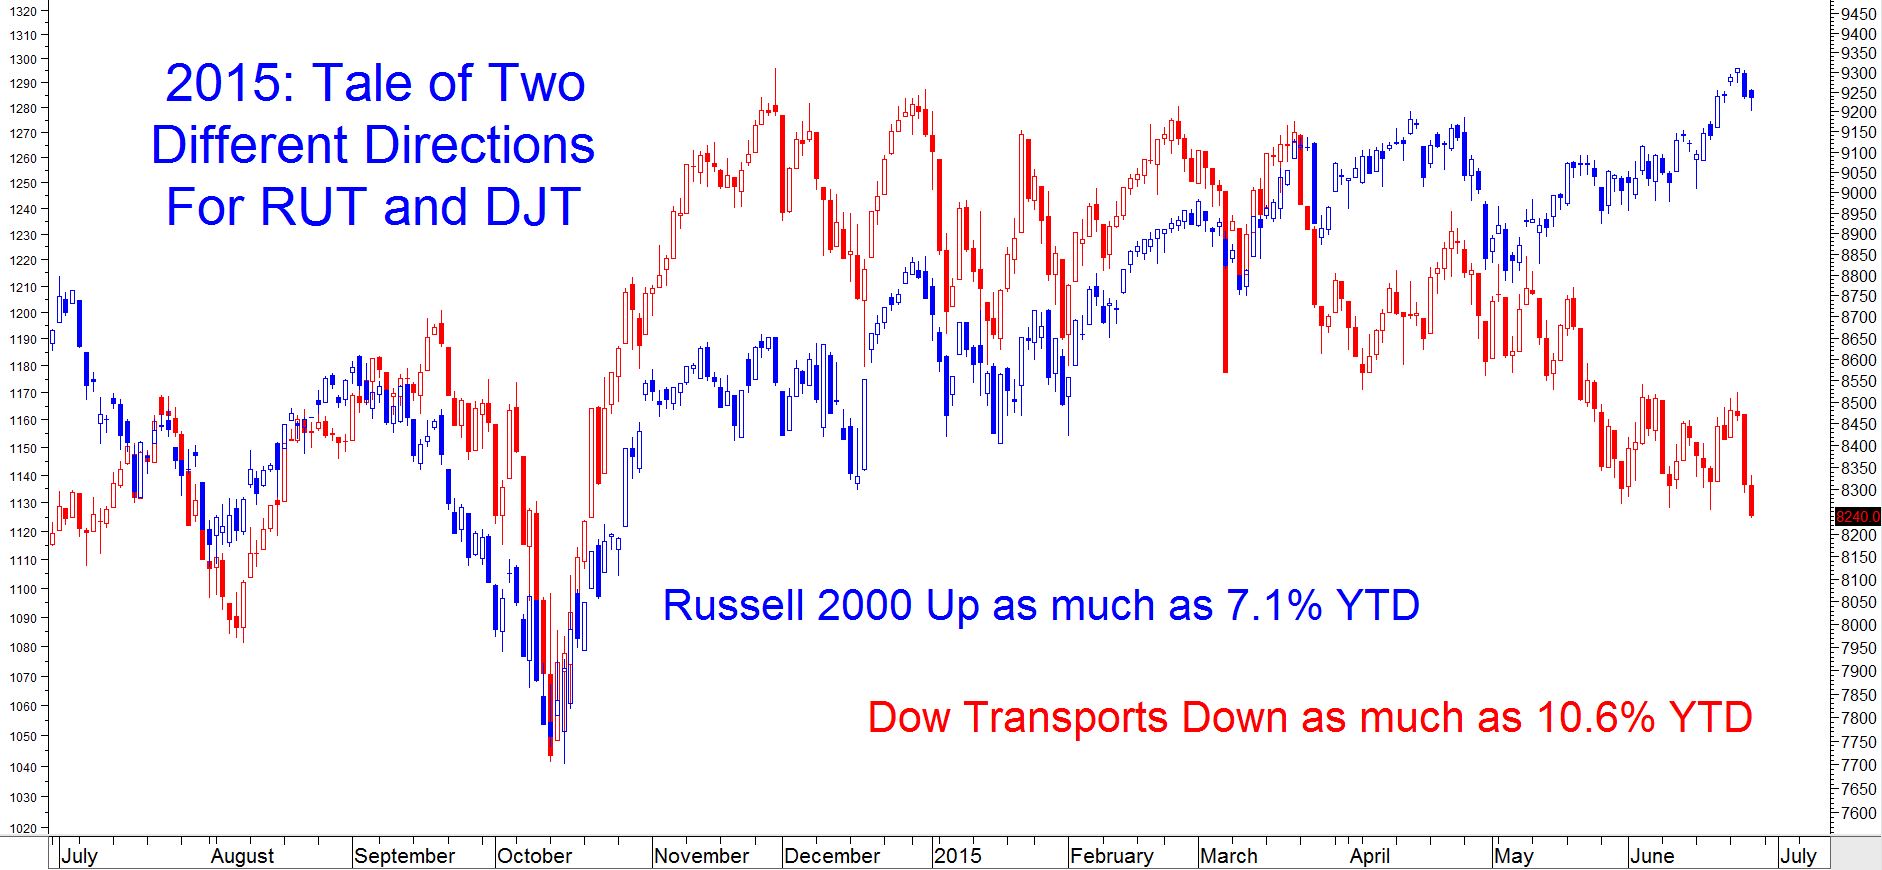
As small cap stocks have only rallied higher from last October’s V-Bottom, it has been a different story for the Dow Transports.
Specifically, the Russell 2000 is up nearly 25% from last October as compared to the comparable gain in the Dow Transports of 7%.
Source: Thomson Reuters
This divergence is made more extreme by the fact that the Russell 2000 put in another record high just this week as the Dow Transports tangled with a formal correction – again.
From a fundamental perspective, it is clear that investors are making very different bets on very different segments of the economy.
The Russell 2000 is comprised of 2000 small cap company stocks that are often associated with high-growth but less mature businesses. Investors are often willing to reward these sorts of companies with higher stock valuations on the prospect of higher growth than is associated with more mature businesses as is the case now with the RUT’s P/E ratio of 82.98 on a trailing 12-month basis according to data offered by the Wall Street Journal as of 6/19/15.
Contrast this with DJT’s P/E ratio of 20.21 on a trailing 12-month basis according to data offered by the Wall Street Journal as of 6/19/15 and the extreme nature of the divergence between small cap stocks and some of the economic backbone companies comprising the Dow Transports becomes even more stark.
As such, investors are sending mixed messages on the health of the economy and the financial markets in making a massively bullish bet on less mature small-cap and often high-growth companies and a somewhat neutral-to-increasingly bearish bet on some of the most mature transportation and infrastructure companies underpinning the U.S. economy such as CSX Corp., FedEx Corp., United Parcel Service, Inc. along with the airlines and other similar companies.
It is challenging, in our view, to argue that this is a reflection of what could be a successful sector rotation bet considering that many of the companies in the Dow Transports represent the “nuts and bolts” of the U.S. economy, in our opinion. Without the foundation of the economy functioning well, it is difficult to believe that the “nice-to-have” segments of the economy can thrive.
Perhaps we will be proven wrong on that reasoning, but we suspect this would happen only in the absence of the ability to prove us correct as the Dow Transports potentially turns around to play “catch up” to the Russell 2000.
Considering how surprising much of the trading action in the equity markets has been to us over the last 2 to 3 years in particular, this could very well happen and it would be demonstrated by the Dow Transports putting in a new record high as the Russell 2000 at least holds ground to its record high.
Most ironic would be if the Dow Transports starts to recover only as the Russell 2000 falters, but there are a few factors that cause us to believe that the Dow Transports are only going to continue to correct – into a bear market – as the Russell 2000 and other U.S. equity indices play “catch up” to the downside.
First, the equity markets are trading against the backdrop of massive uncertainty around if and when the Federal Reserve will start to raise rates. While it could be healthy ultimately for the economy to return to normalized rates, it would likely cause massive volatility in the equity markets and we suspect that the masked volatility over the last 18 months or so is an early reflection of that dynamic.
Second, the Dow Transportation Index has put in 5 Death Crosses over the last 10 years ahead of this May’s Death Cross and 3 of those events led to significant declines including the peak-to-trough crash of more than 60% in 2008 and 2009.
Third, the bull market in the Dow Transports is broken. This is shown clearly by the weekly chart below with the DJT trading beneath the uptrend marking its bull market.
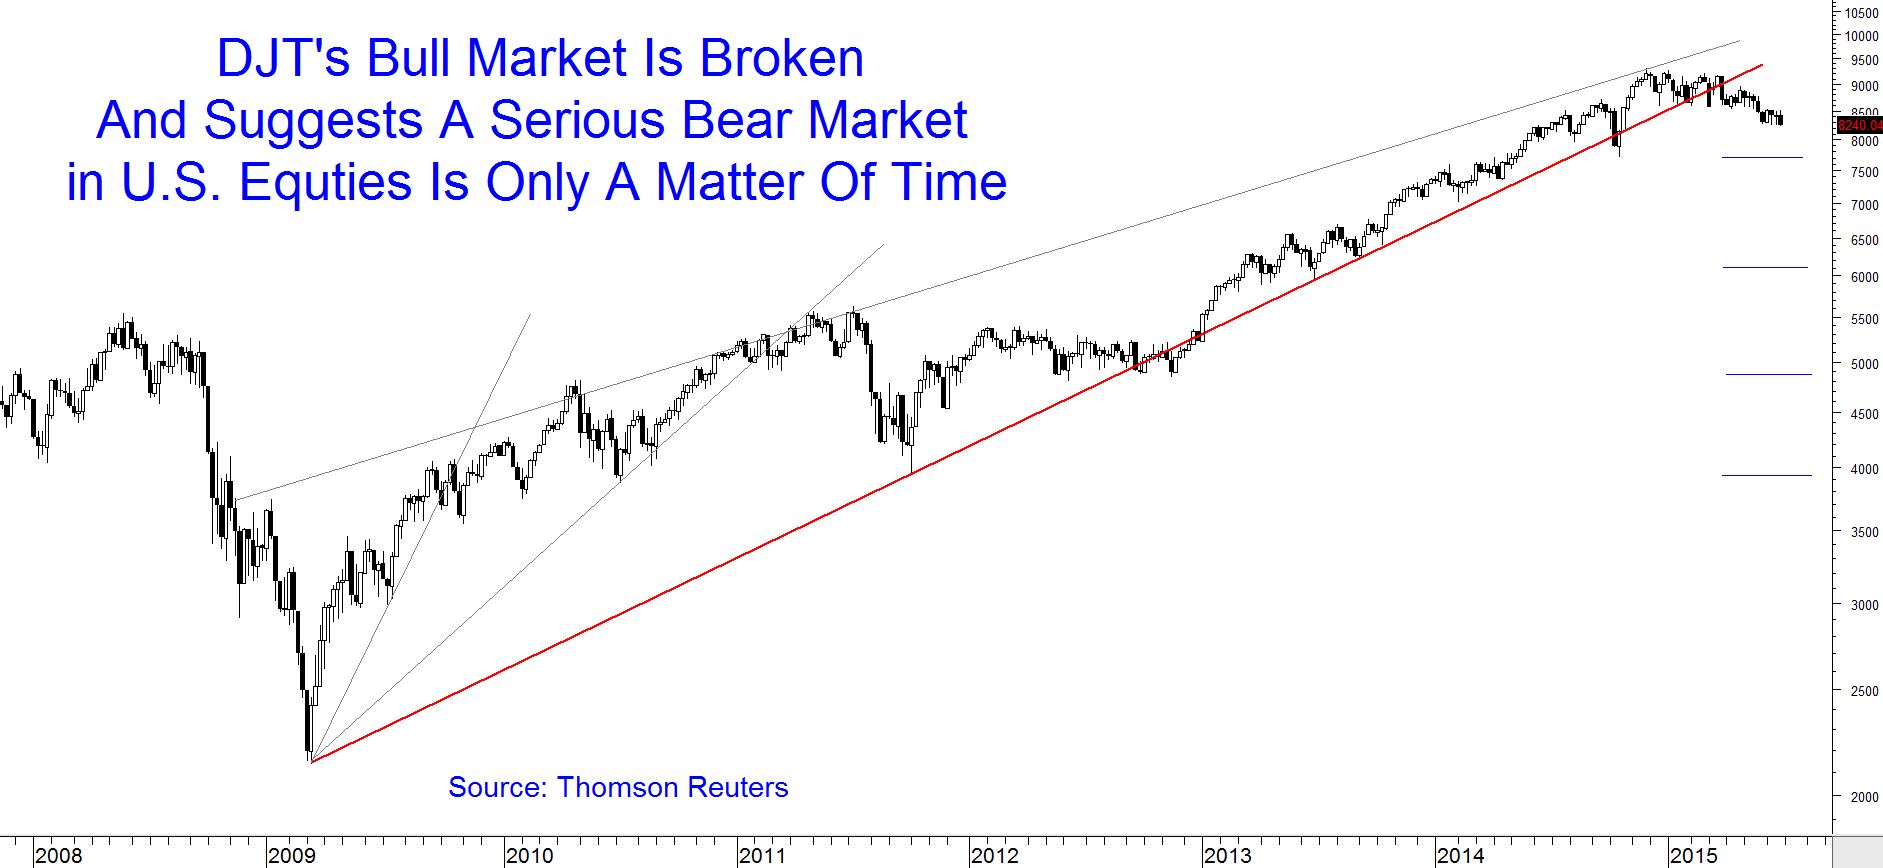
Similar to points made above, this chart points to a slow shift in control to the sellers from the buyers and one that is likely to lead to a prolonged period of even more severe volatility than what we have witnessed so far in 2015 followed by a bear market decline if not crash.
Should this prove true and it seems only a matter of time, it is highly unlikely that the Dow Industrials, Nasdaq Composite, Russell 2000 and the S&P 500 will hold on to the new all-time highs achieved – again – for long. Rather, we tend to think that these other four equity indices will turn toward volatile sideways trading followed by corrective trading action into bear market territory.
It is for this reason that the Transports are troubling.
********
Investment Advisory Services offered through Greenbush Financial Group, LLC. Greenbush Financial Group, LLC is a Registered Investment Advisor. Securities offered through American Portfolio Financial Services, Inc. (APFS). Member FINRA/SIPC. Greenbush Financial Group, LLC is not affiliated with APFS. APFS is not affiliated with any other named business entity. Abigail Doolittle is a registered representative with American Portfolio Financial Services, Inc. Information in this illustration has been obtained from sources believed to be reliable and are subject to change without notification. The information presented is provided for informational purposes only and not to be construed as a recommendation or solicitation. Investors must make their own determination as to the appropriateness of an investment or strategy based on their specific investment objectives, financial status, and risk tolerance. Past performance is not an indication of future results. Investments involve risk and the possible loss of principal. Any opinions expressed in this discussion are not opinions or views of American Portfolio Financial Services, Inc. (APFS) or Greenbush Financial Group, LLC. Options expressed are those of the writer only. There is no guarantee that a diversified portfolio will enhance overall returns or outperform a non-diversified portfolio. Diversification does not ensure against market risk. The opinions voiced in this material are for general information only and are not intended to provide specific advice or recommendations for any individual. To determine which investments may be appropriate for you, consult your financial advisor prior to investing. All performance referenced is historical and is no guarantee of future results. All indices are unmanaged and cannot be invested into directly.
share
share
share
share
share


