
Wednesday Stock Report... A World of Head & Shoulder Tops!
 share
share
 share
share
 share
share
 share
share
 share
share
Tonight I want to bring everyone up to date on the many H&S top patterns that have been forming for sometime now. All these H&S top patterns are telling a very big story as to the direction of the world marketl. These H&S top patterns are showing up in every corner of the investing complex. There are several more that have broken their necklines this week. I will let the patterns speak for themselves.
First, lets look at some of the world stock markets and see what kind of shape they’re in as this is a world wide phenomenon taking place.
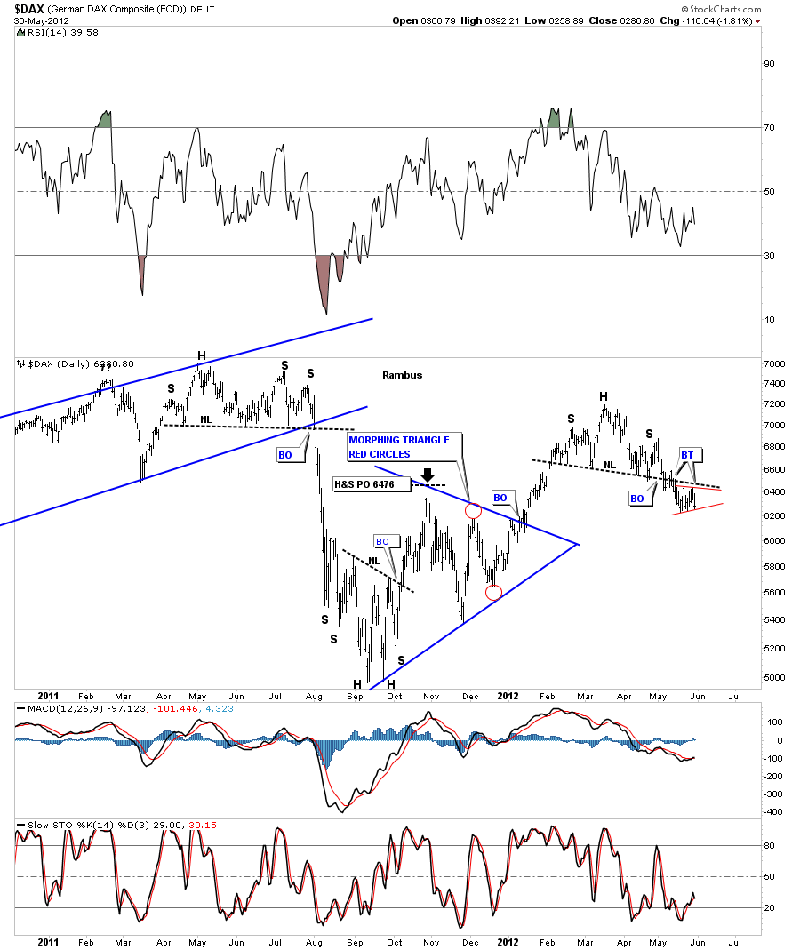
One of the stronger European stock markets the DAX. Note the little red triangle forming just below the neckline.
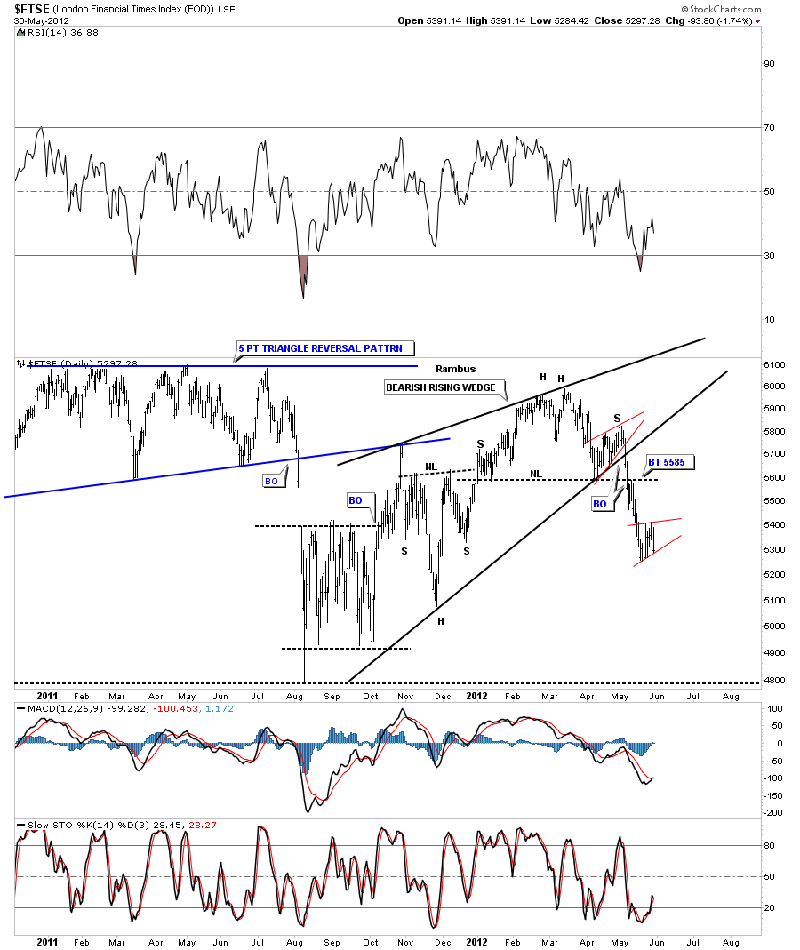
The FTSE is alittle further along than the DAX in it’s move lower. Note the little red bearish rising wedge.
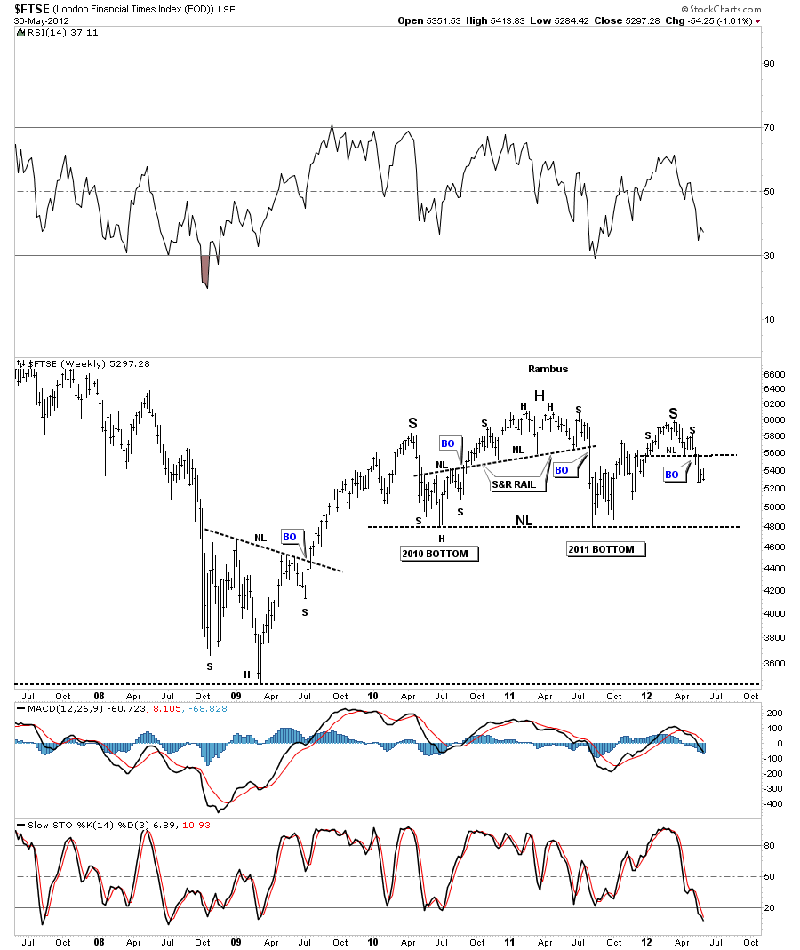
The weekly FTSE look shows a much larger H&S pattern that is almost 2 1/2 years in the making.
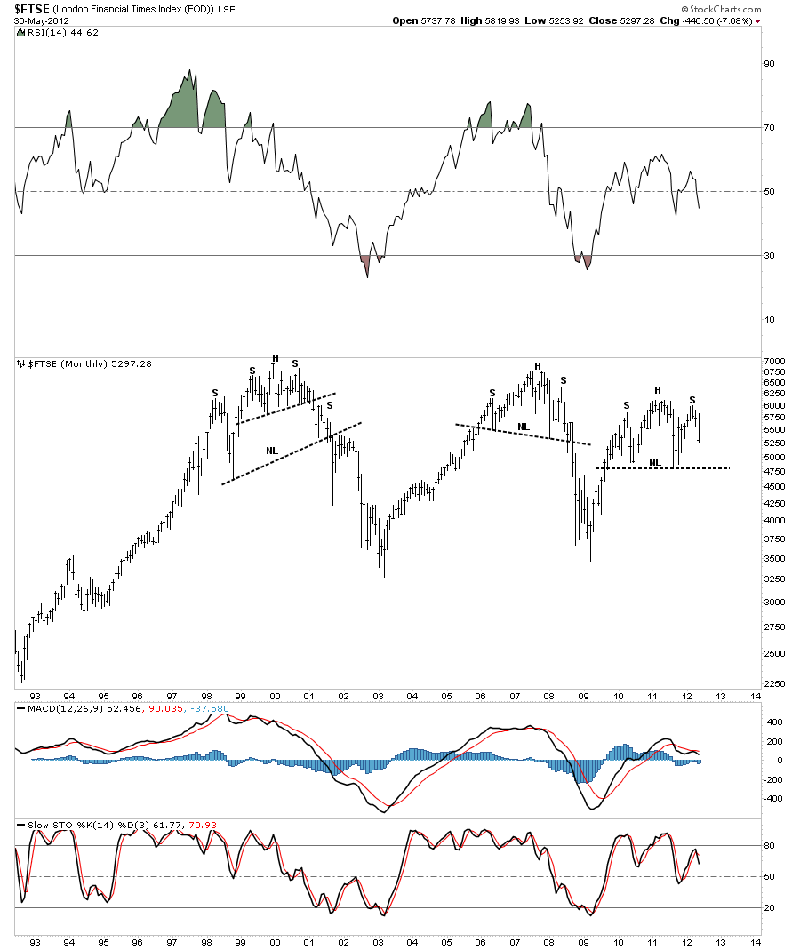
The monthly chart shows the similarities between the two other big topping patterns from 2000 and 2007 and our current one.
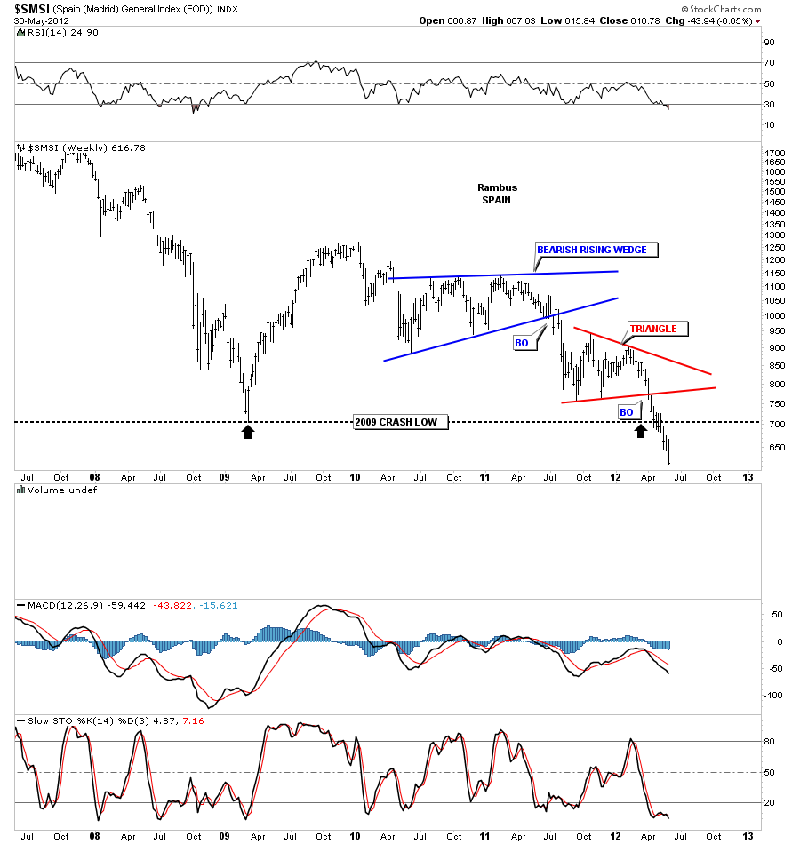
The SMSI is the Spain stock market that doesn’t have a H&S top but it does have a triangle consolidation pattern and is breaking down below the all important 2008 crash lows.
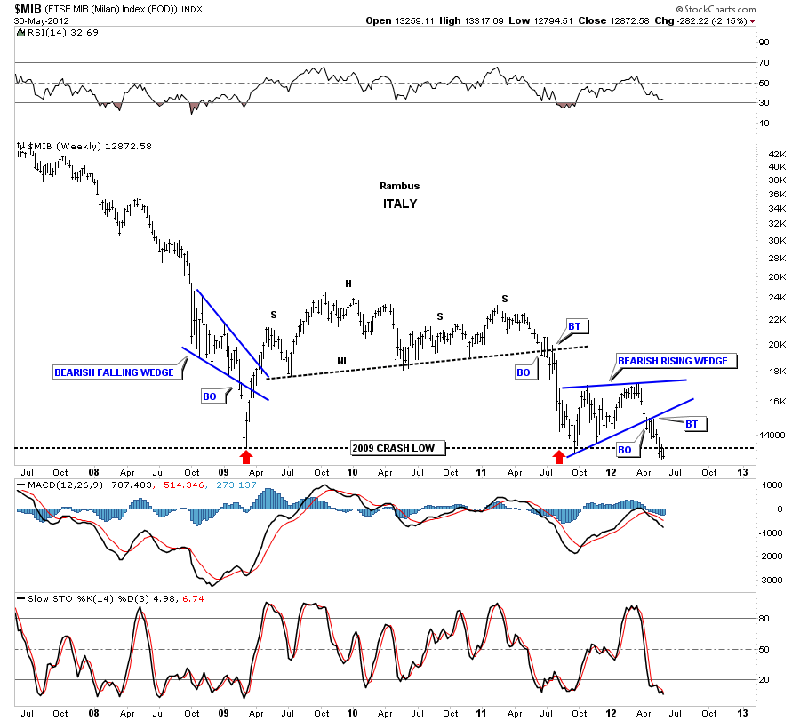
The MIB Italian stock market is also breaking below the 2008 crash lows.
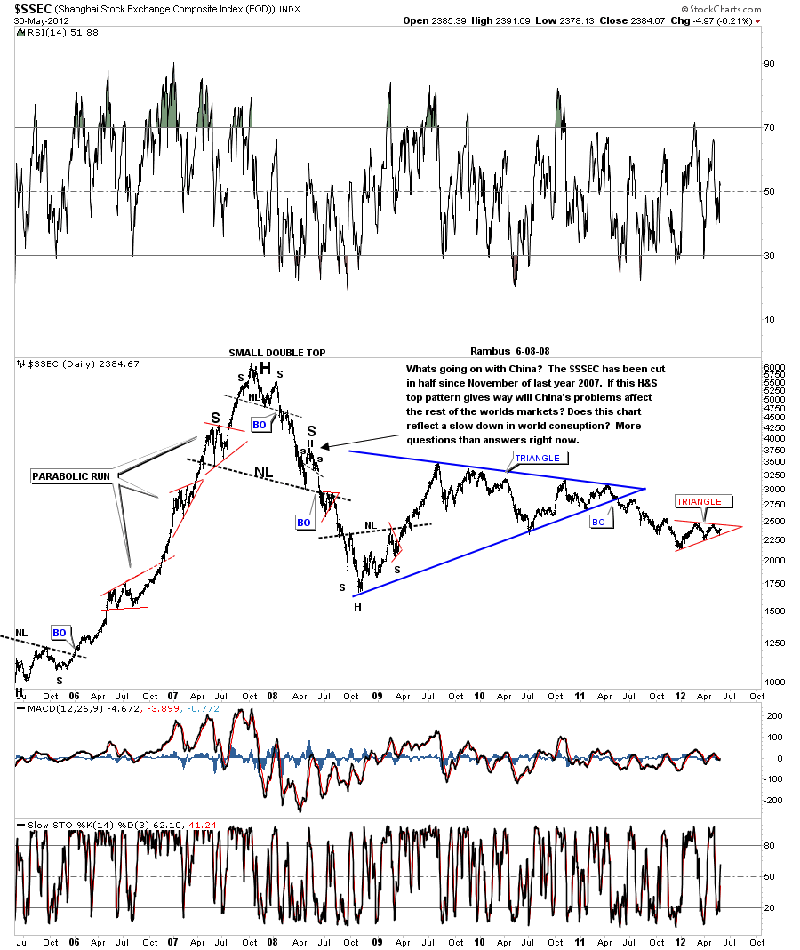
The SSEC has formed a red triangle pattern that has yet been decided on which way it will breakout. Note the parabolic run the SSEC had back in 2007. This is a good example of what happens after a parabolic run is over. Its been trending down for over four years now with no real bottom in sight yet.
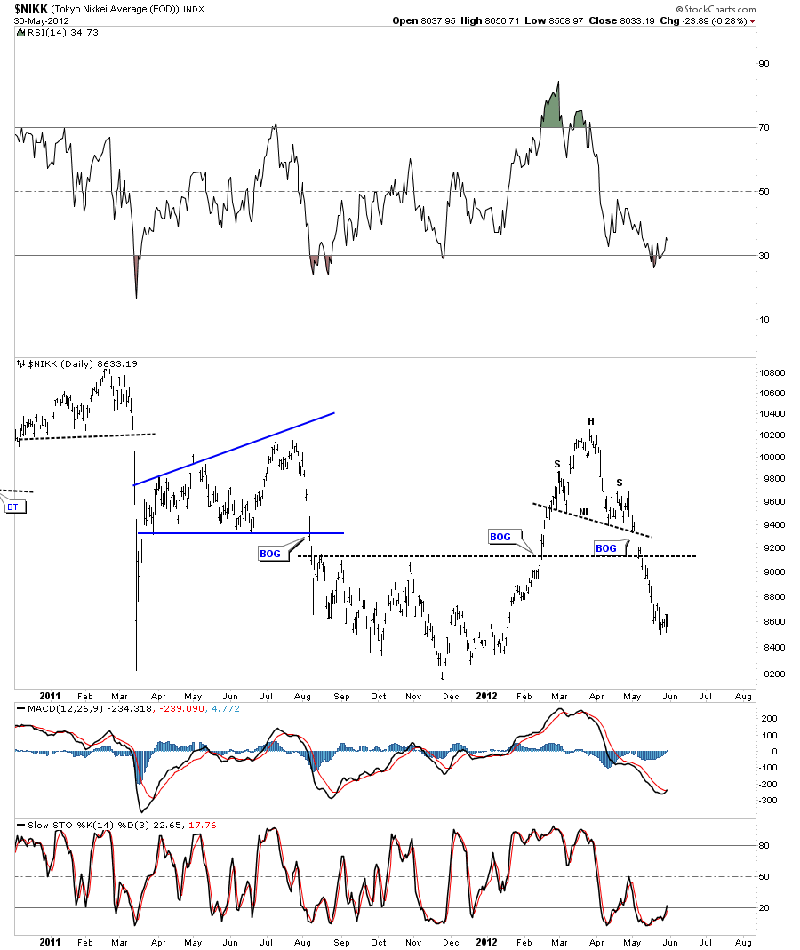
The NIKK daily H&S top.
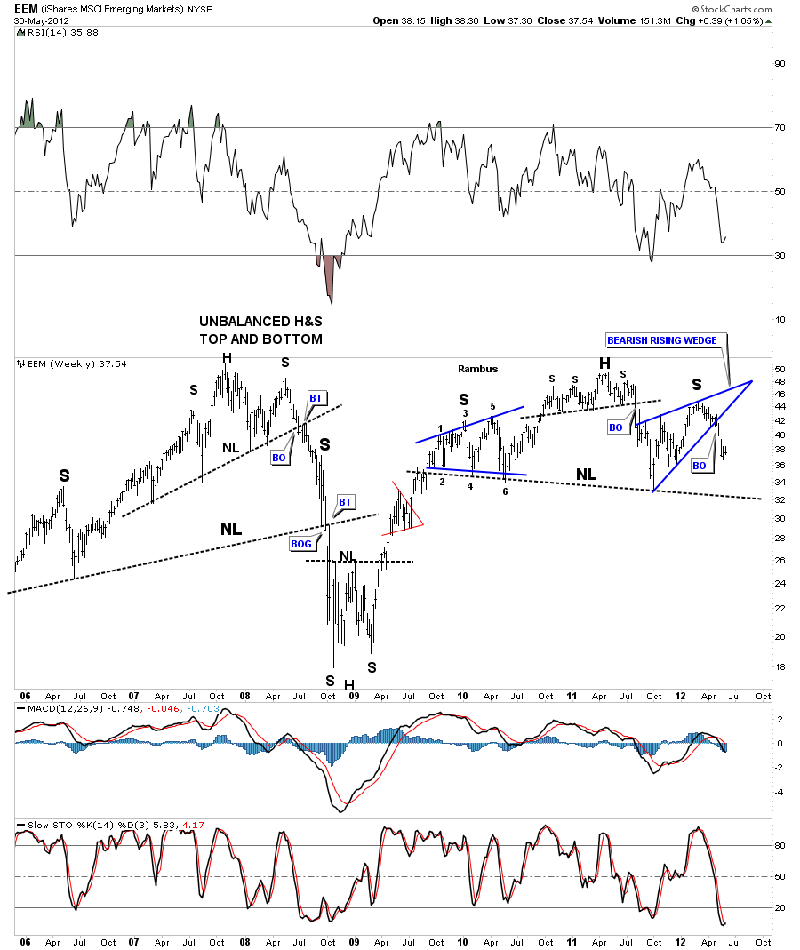
The EEM emerging markets are showing a large H&S top. No area seems to be immune to what seems to be coming our way.
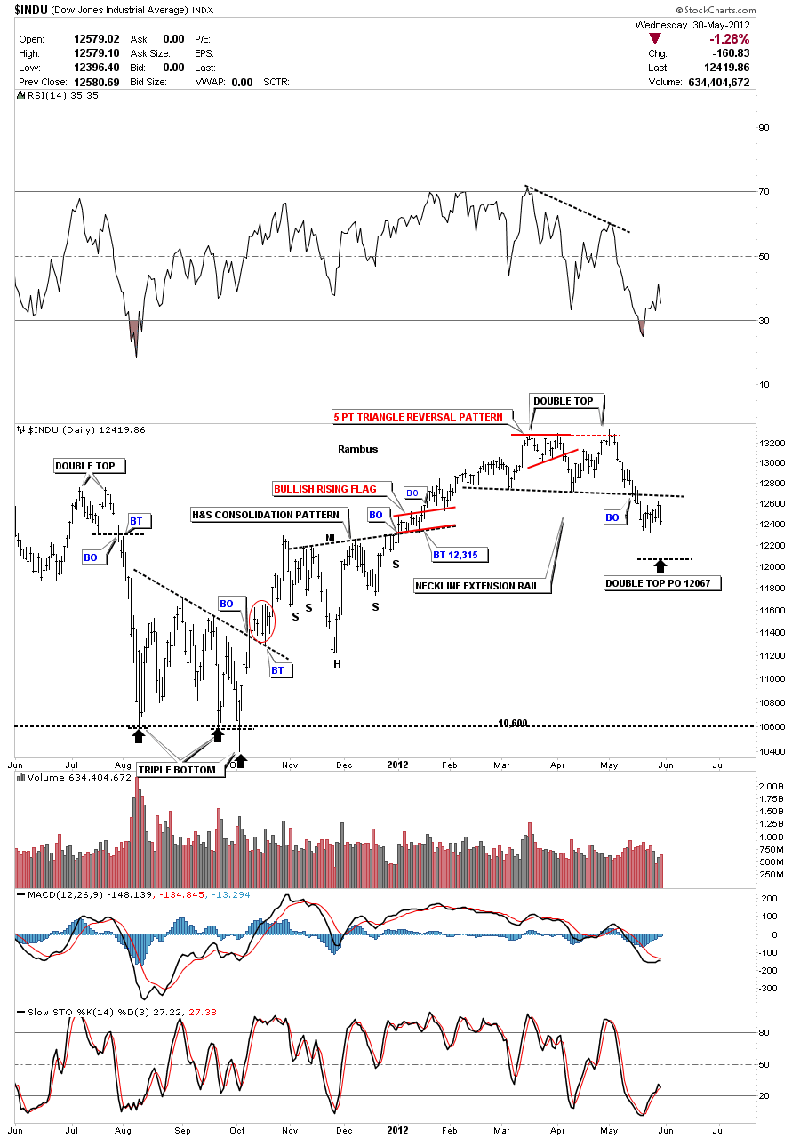
Lets now take a look at some of the US stock markets. Most are showing H&S topping patterns as well. The Dow is the only US stock index that is showing a double top which is still a reversal pattern.
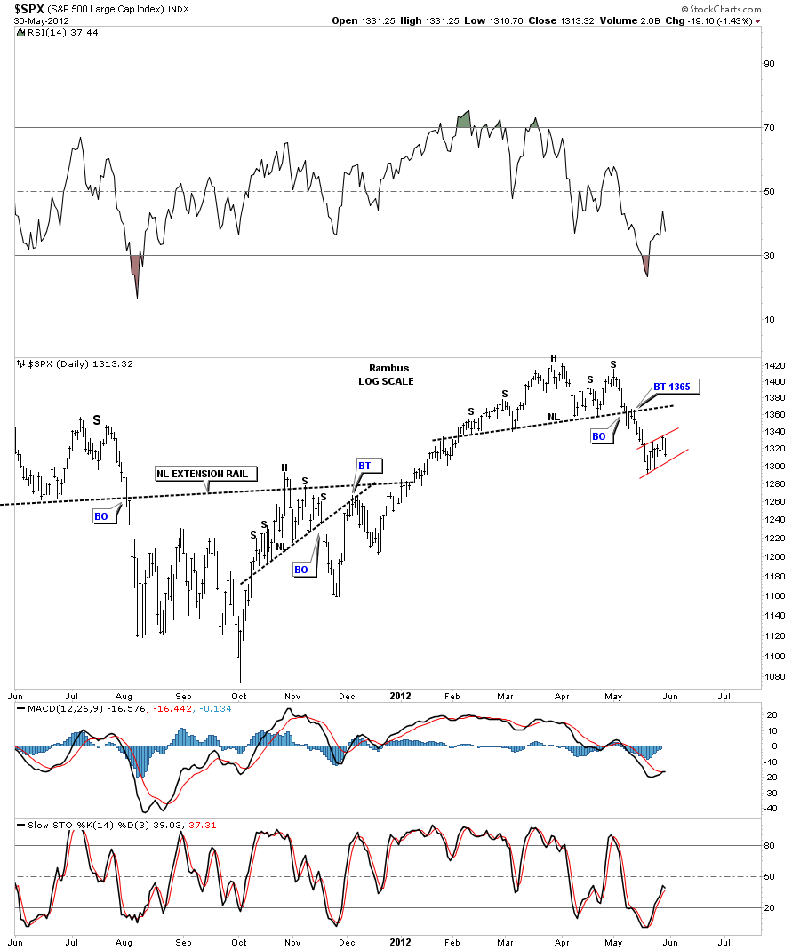
The S&P shows a H&S top pattern with two left and two right shoulders. Note the little red bear flag that has formed over the last couple of weeks.
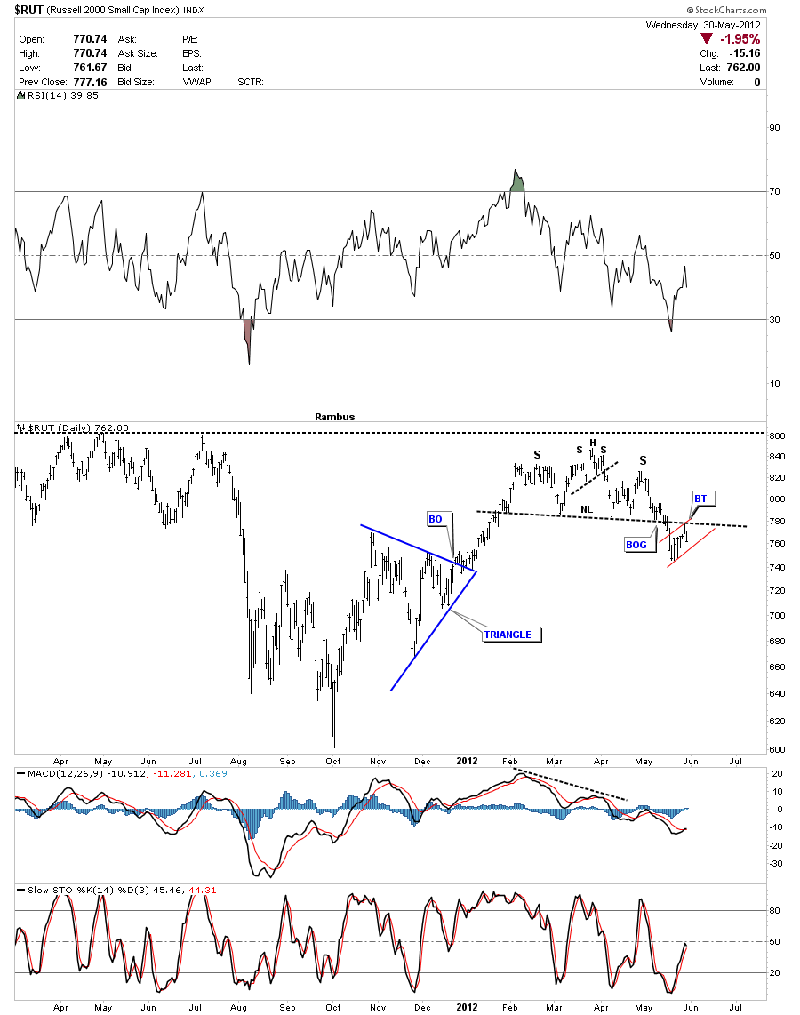
The RUT small cap index has a nice H&S top pattern with a bear flag forming just below the neckline which is a bearish setup.
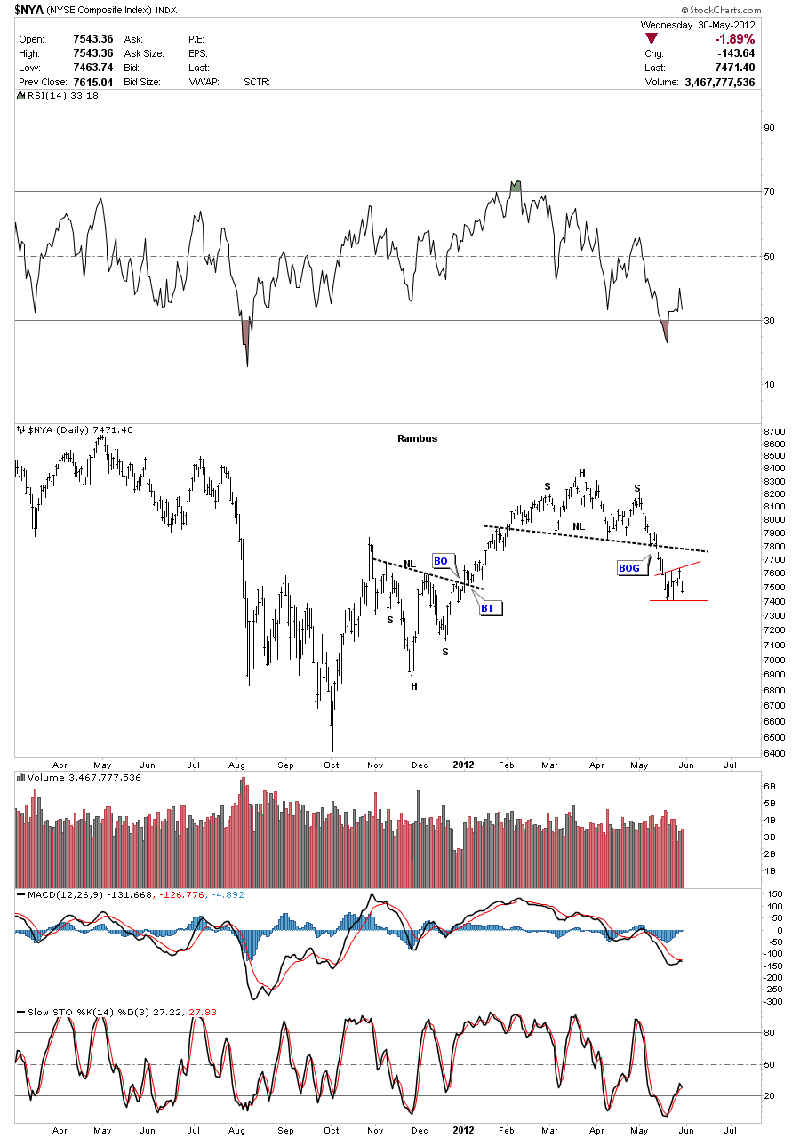
The NYA is a broad measure of US stocks.
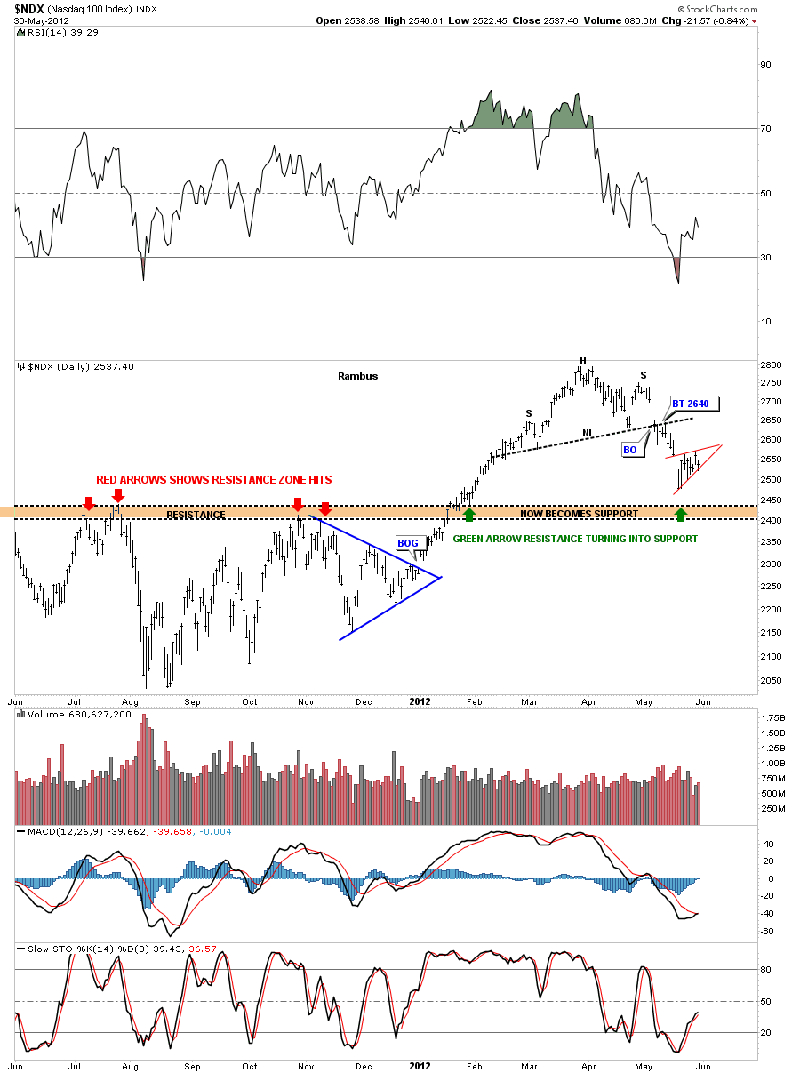
Lets look at one more US stock index that has the 100 biggest tech stocks, the NDX 100. Note the little red bearish rising wedge that will most likely be a halfway pattern to the downside.
I was going to show some other areas of the markets tonight with H&S top patterns but its getting late. I will bring you up to date on the weekend report. All the best ..Rambus
To Subscribe to Rambus Chartology and see Rambus' 10 Favorite PM Stocks and a World of Charts and Projections including the Chartology Forum where Rambus answers your Questions and even Charts your Favorite PM Stocks by Request, go to : www.rambus1.com
share
share
share
share
share
 Rambus Chartology is Primarily a Goldbug TA Site following the precious metals markets. Chartology is the Unique Blend of Technical Chart Pattern Identification and Market Psychology, Developed by Rambus During the Tech Mania of the late 1990s. His Early Training came the old fashioned way...Reading Edwards and McGee's Bible of Technical Analysis and spending years with a sharp pencil graph paper and ruler refining his skills and accuracy. Visit the Rambus Chartology website at http://rambus1.com/.
More from Gold-Eagle


