
What’s Wrong with this Picture?
 share
share
 share
share
 share
share
 share
share
 share
share
![]()
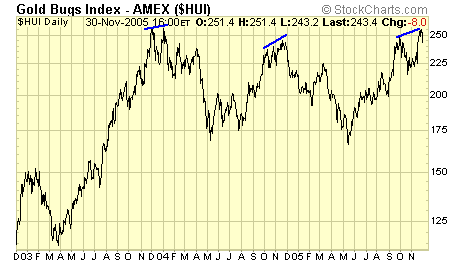
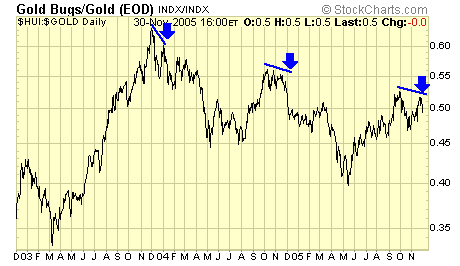
The top chart is the $HUI, and bottom chart is the performance ratio between $HUI and gold.
For the third winter in a row, stocks failed to assume leadership, resulting in another bearish divergence. In the past two weeks, all the ducks were lined up so to speak, to break this bearish pattern with $HUI challenging the Dec 2003 high of 258.60, but unfortunately, the $HUI has failed so far.
It is still possible for the bullish scenario, and in order for that to happen, gold stocks must begin to outperform gold immediately, otherwise gravity takes over and it will not be pretty.
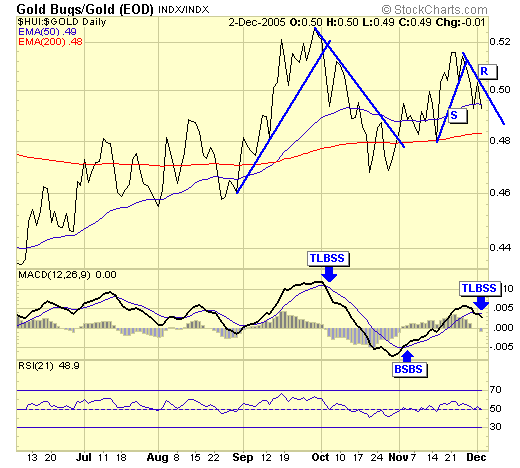
Our leading indicator is once again a step ahead, already given us a sell signal. We have taken profits on our trading portfolio and keep stops tight on our investment portfolio. I refuse to see profits turning to a loss.
Summary
My analysis on gold and silver has not changed.
They are rising against all major currencies.
They are rising against other "things".
They are in a roaring bull market.
But we trade gold and silver stocks, and they are not joining the party, yet.
Keep it simple, follow the market.
Jack Chan at www.traderscorporation.com
3 December 2005
share
share
share
share
share

Jack Chan is the editor of Simply Profits, established in 2006. Chan bought his first mining stock, Hoko Exploration, in 1979, and has been active in the markets for the past 37 years. Technical analysis has helped him filter out the noise and focus on the when, and leave the why to the fundamental analysts. His proprietary trading models have enabled him to identify the NASDAQ top in 2000, the new gold bull market in 2001, the stock market top in 2007, and the US dollar bottom in 2011.


