
What Goes Up Must Come Down! - A Stock Market Top To Remember...
 share
share
 share
share
 share
share
 share
share
 share
share
Upcoming Events:
USD: ISM Non-Manufacturing PMI, Factory Orders m/m.
EUR: N/A. USD: ISM Non-Manufacturing PMI, Factory Orders m/m.
GBP: Services PMI. USD: ISM Non-Manufacturing PMI, Factory Orders m/m.
JPY: N/A. USD: ISM Non-Manufacturing PMI, Factory Orders m/m.
EURUSD
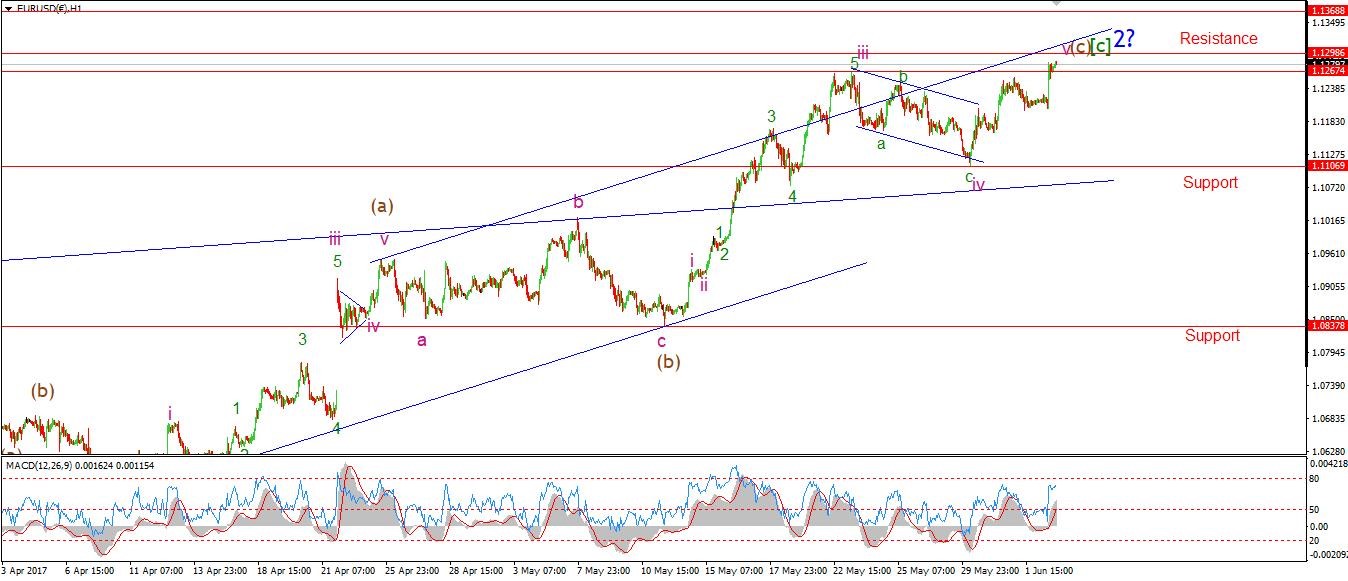
EURUSD 30min:
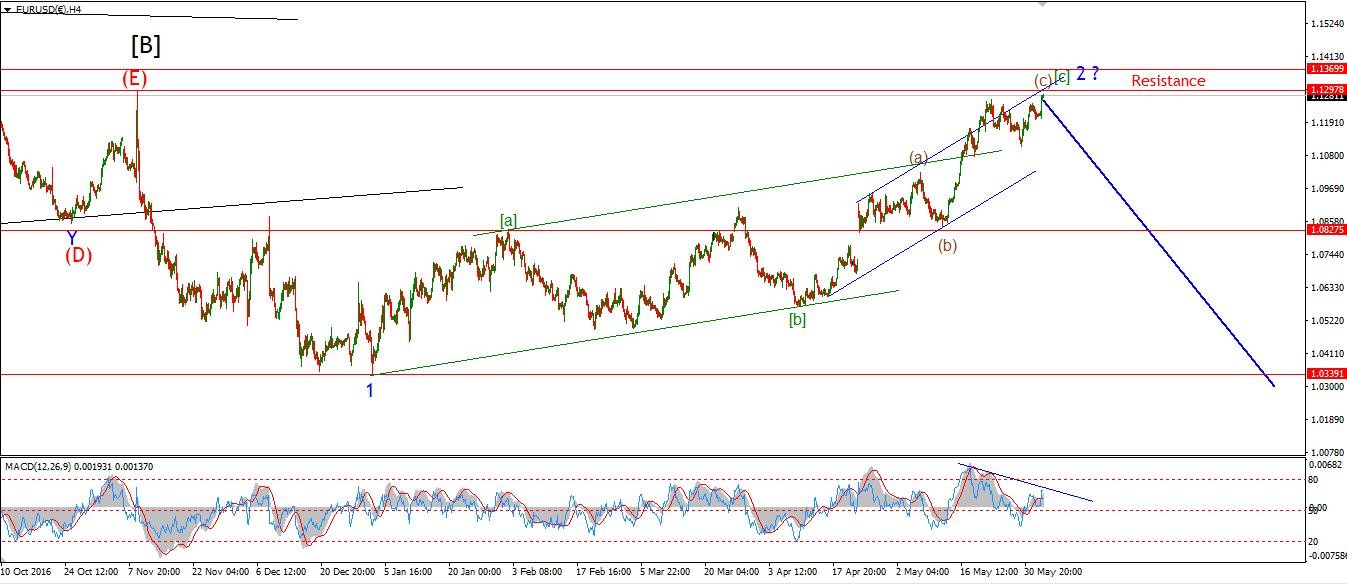
EURUSD 4hr
Welcome to the weekend! But, no parties for me! As a father of 2 young girls, the weekend is the same as every other day, up early, go all day, and fall asleep quickly and be woken up 3 times a night! Life's good though!
EURUSD popped today and did what it has been doing consistently for the last month…that is, extending the rally into the next iteration of the wave count.
I have labelled the short term chart with the next best interpretation. The general bias is still for a massive decline over the next year or so, but catching that final top is tricky in a corrective process.
The new wave labelling views the recent decline as a complex correction in wave 'iv' pink, and wave 'v' has now possibly completed at the highs of the day.
The final invalidation line for the immediately bearish wave count lies at 1.1368. A break of that high will trigger the alternate wave count shown on the daily chart That involves an expanded flat wave [B] rather that the current contracting triangle interpretation.
So;
For the early trade next week, I will be focused on 1.1368, and the action from today’s highs.
If the price turns down in an impulsive looking fashion, and breaks support at 1.1107 again, that action will indicate that the current labelling is still correct. So far this week 1.1298 is proving a hard level to break,
and the longer-term technicals are still registering a sell signal, the early trade next week will clear up a whole lot in this wave count.
GBPUSD
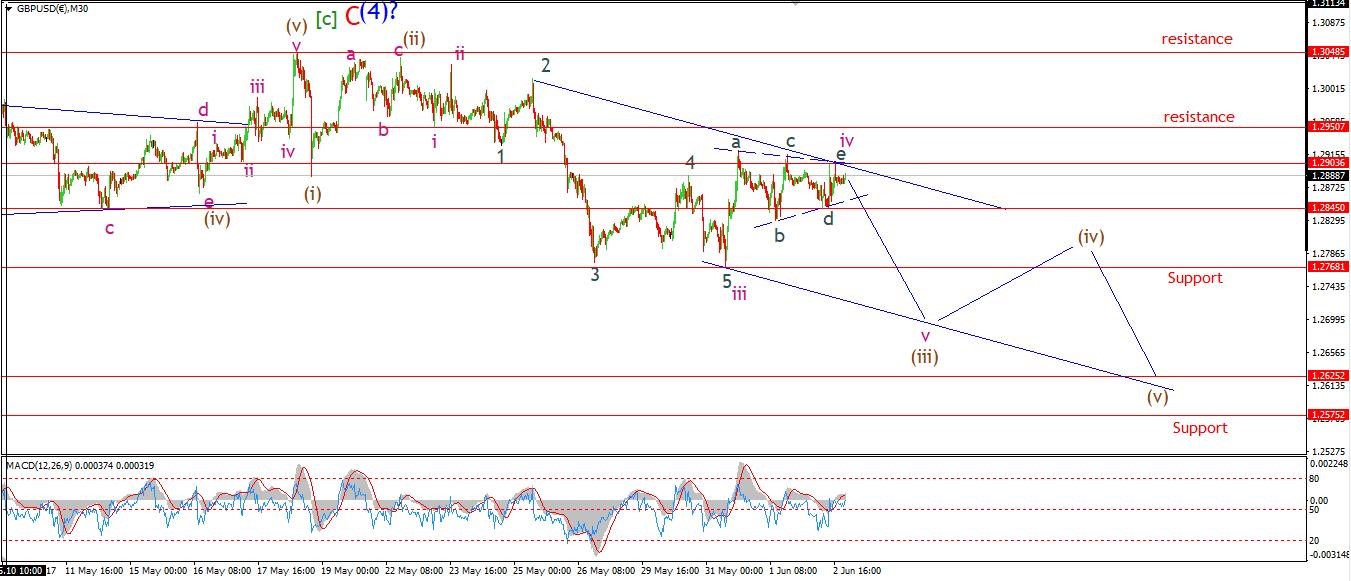
GBPUSD 30 min:
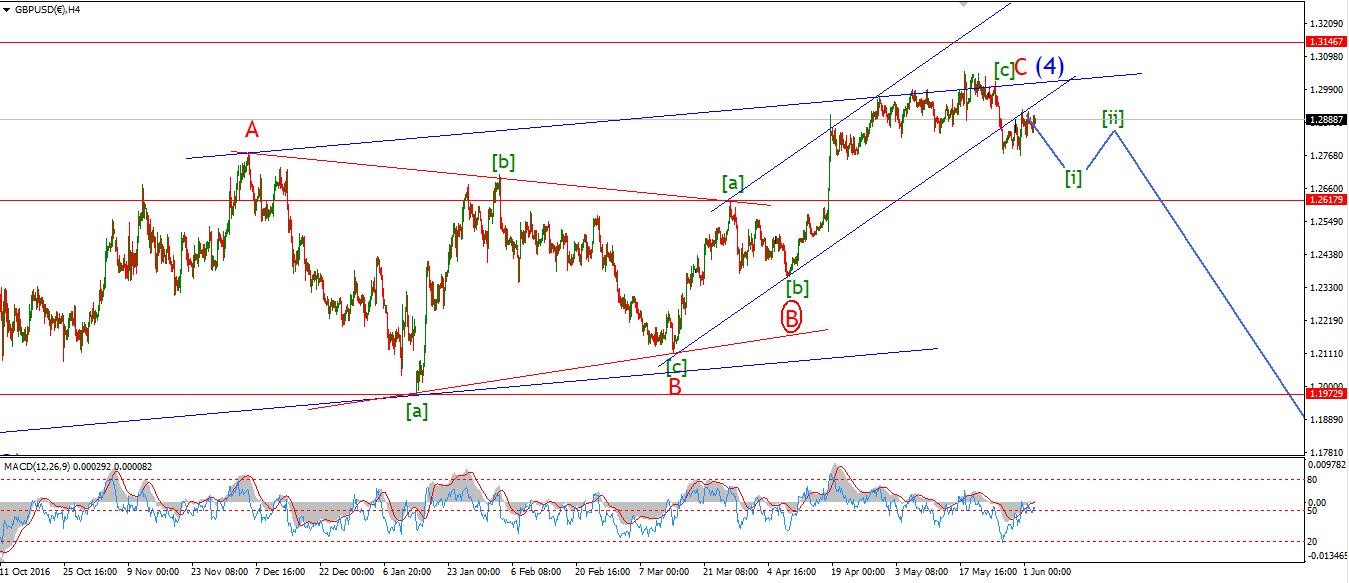
GBPUSD 4 hr:
I have updated the short term wave count in cable to account for the sideways action over the last few days.
The price has been contracting in range, and the price action is very overlapping in nature.This seems to fit a contracting triangle wave form more than anything else.
So;
With that in mind I have labelled the action into today’s high as wave 'iv' pink. Wave 'v' is left to come and should bring the price down to meet the lower trendline at about 1.2700 to complete the larger wave (iii) brown.
A break of 1.2845 will signal wave 'v' as under way. But if the price breaks above 1.2920, we can rule out this idea. For Monday, watch for that triangle to hold and continued declines.
USDJPY
USDJPY 30 min:

USDJPY 4 hr:
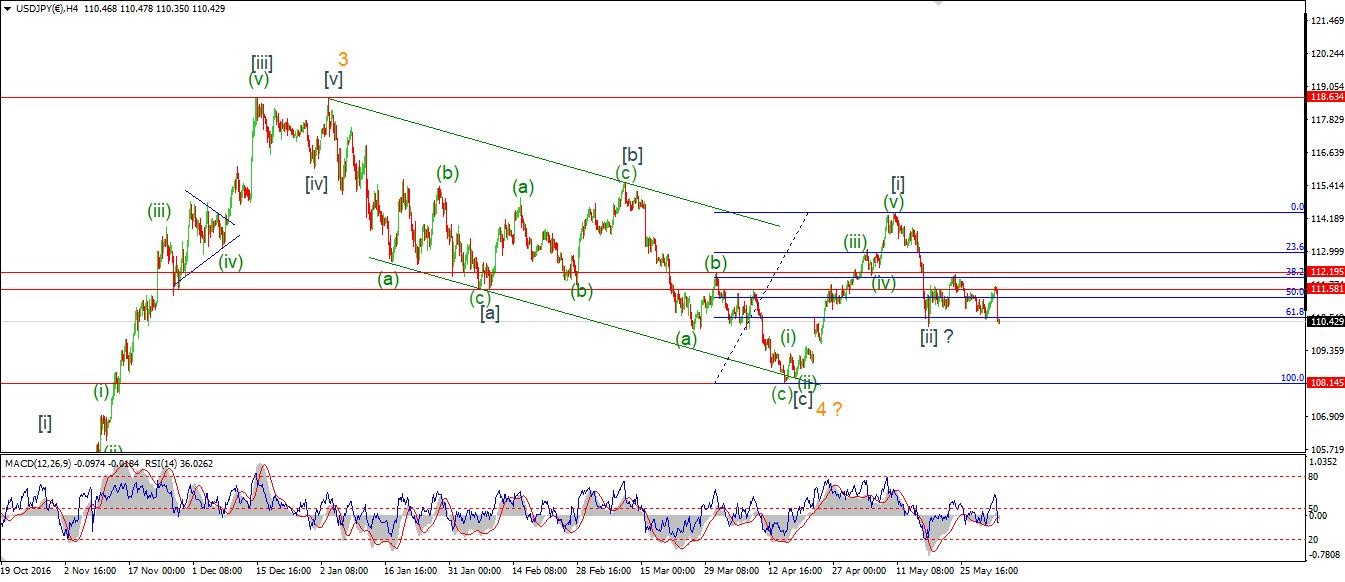
USDJPY has ended the week in a bad way! The short-term bullish wave count is now 20 pips form invalidation as I write this. 110.23 must hold for the immediately bullish interpretation to remain valid.
The alternate wave count is still bullish, but simply calls for a larger wave [ii] grey to play out. This would allow for another decline into the 109 area to complete. This count is shown circled in red on the 30 minute chart.
If the price breaks the upper trendline of the trend channel again it will rescue the bullish count. The overnight trade on Sunday will probably sort out the short term wave count. If support is broken, we will likely have to wait another week or so to turn bullish again.
DOW JONES
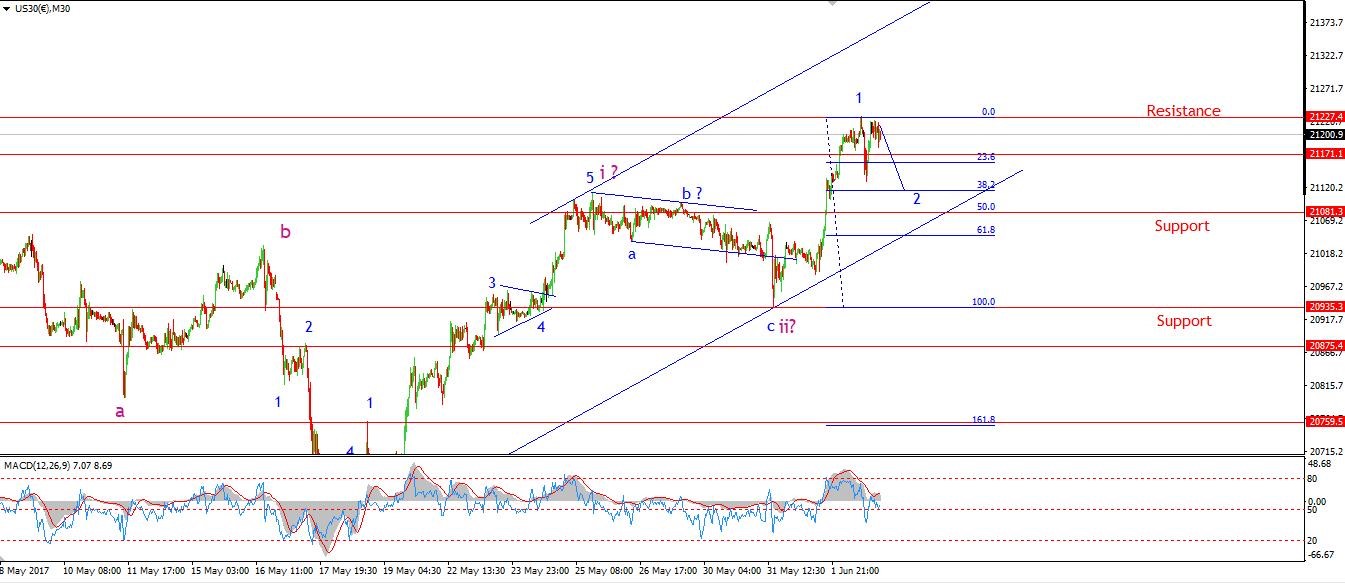
DOW 30 min:
DOW 4 hr:

The DOW reaches new all-time high! SO we should all celebrate that stocks are more expensive than ever before. I hate expensive things!
The target for wave '1' blue was at 21222. The price reached 21228 at today’s high and then promptly fell to begin wave '2' blue Wave '2' should trace out a three wave form. The 50% retracemetn of wave '1' blue lies at 21081.
So for Monday watch for the completion of wave '2' blue, and the beginning of wave '3'. The rally from here could get pretty hairy, with extreme bullishness running away with everyone’s senses. The end game is exactly the same as I have spoken about previously, that is - a massive bear market is coming out way.
First we must dispense with this final bullish structure.
GOLD
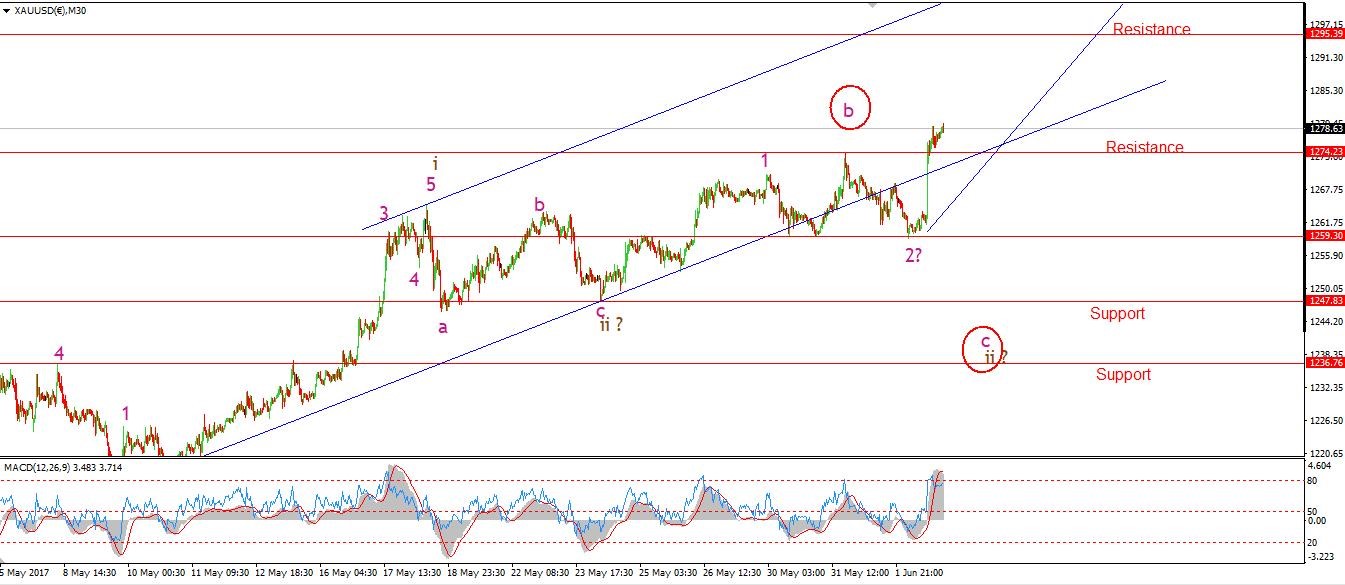
GOLD 30 min:
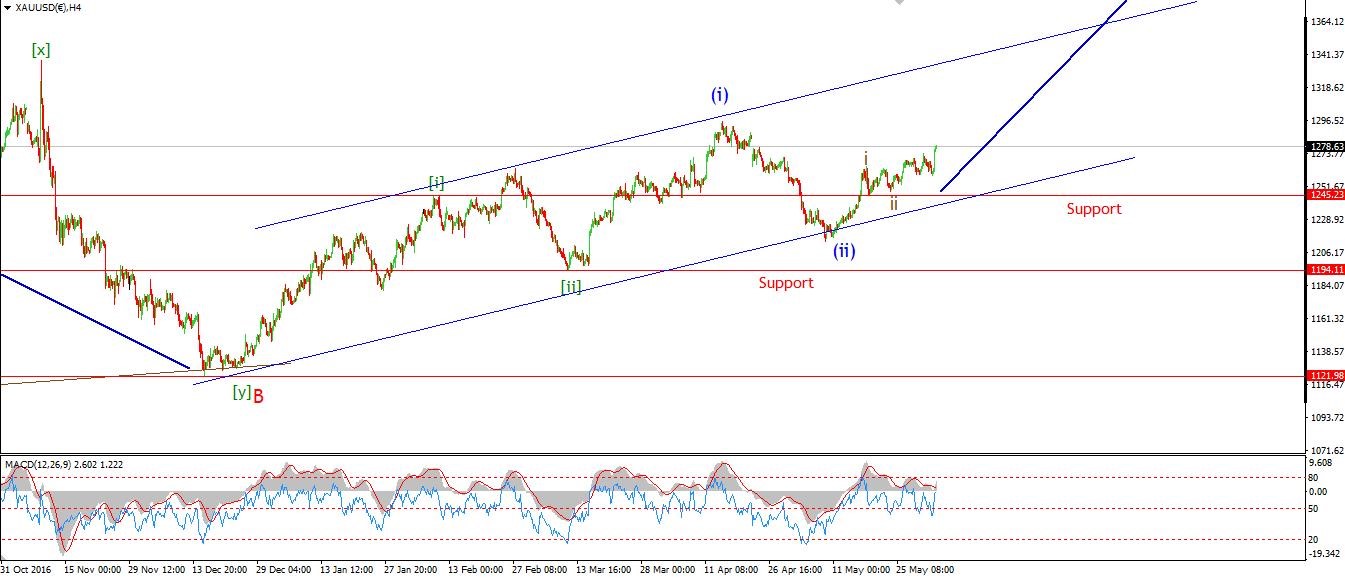
GOLD 4 hr:
GOLD reached a low of 1258.98 today, a slight break of support at 1259.30. So wave '2' pink was confirmed as a complex expanded flat correction. Where the internal structure traces out a 3,3,3 wave pattern.
Since today’s low the price rocketed higher, up $20 dollars to the high. This is likely the start of wave '3' pink that I have been anticipating. The next significance resistance lies at 1295.39, the high of the previous wave (1) blue.
The current wave count calls for a large move higher in wave (iii) blue, #One which should easily break into the $1400 area without much hassle. With that in mind, watch for the price to find support at the lower line of the trend channel. The price should experience only shallow corrections from now on.
That’s it for this week’s analysis. I will be back on Monday for the daily market wrap.
********
share
share
share
share
share


