Will Gold’s Next Decline Be Its Final One?
 share
share
 share
share
 share
share
 share
share
 share
share
If gold’s recent rally is just a correction within a larger medium-term downswing, and the 2018 pattern repeats, this could mean the final plunge.
Gold continues to move just like it did at the beginning of this year, and – combined with the bottoming USDX – it heralds declines in the PMs.
I previously emphasized that despite jumping above the upper (red) border of the roughly one-and-a-half-month trading channel, the bearish implications of the yellow metal’s inability to close above its November 2020 low are more important - and this has remained the case.
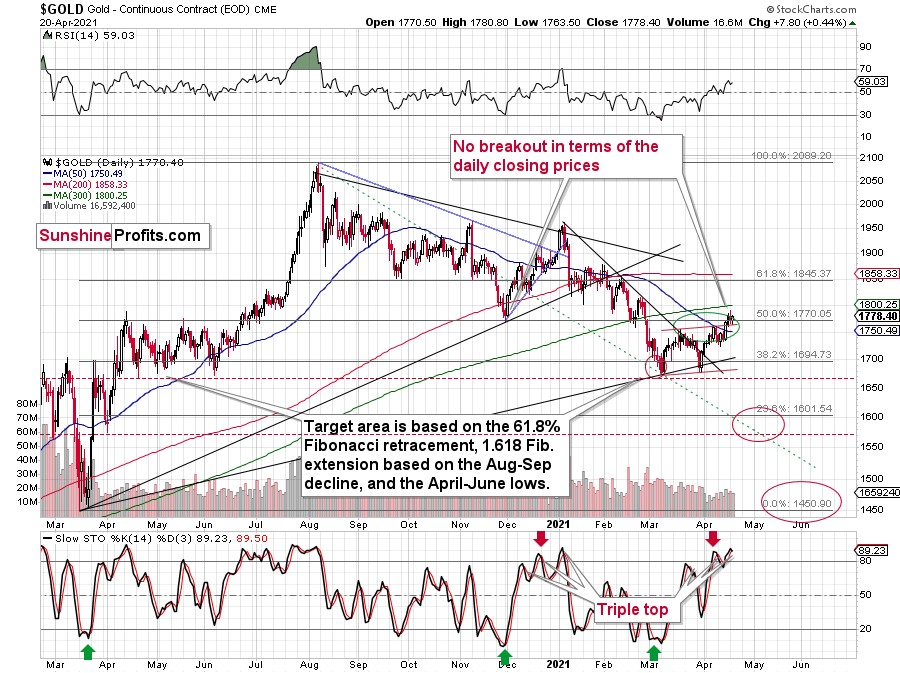
Despite a daily rally in gold, we haven’t seen a daily close above the lowest one of late November 2020. Consequently, the breakdown below this level was not invalidated and its bearish implications remain intact.
In addition, gold’s stochastic indicator is mirroring the behavior that we witnessed in early 2021. If you analyze the bottom area of the chart above, you can see that the indicator recorded three material moves higher (triple top) before gold eventually rolled over.
In particular, the first sell signal occurred slightly below the 80 level, the second was above it, and the same was the case with the third one.
The stochastic indicator has just moved to new highs, just like it did in early 2021, and it also flashed (so far tiny but still) a sell signal. Back in January, this action meant that the final top was in or about to be in (not more than a few sessions away). The implications here are definitely bearish. Especially given Monday’s session, when gold showed that it’s ready to slide even without the USD’s help.
Speaking of the USD Index, please note that it seems to have bottomed almost right at its 61.8% Fibonacci retracement level based on the previous 2021 rally.
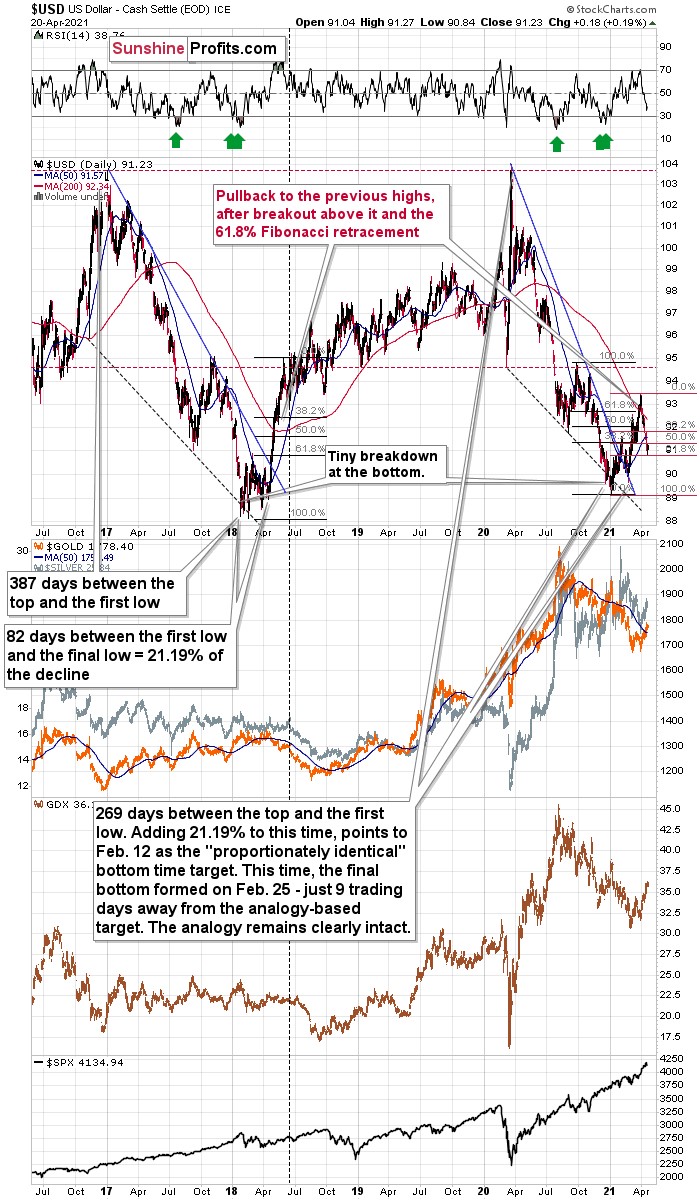
In addition, let’s keep in mind that the very bullish analogy to the 2018 rally remains intact. If you analyze the chart below, you can see that back in 2018, the USD Index rallied sharply and then corrected back to its previous highs. And in similar fashion, the current weakness is nearly identical.
The current correction is much bigger than what we saw in mid-April 2018, so it seems that what we see right now is more of an analogy to what we saw in June 2018. That was the first big correction after the breakout – above the 50-day moving average and the declining blue resistance line – that definitively ended the yearly decline.
I marked the situation from 2018 that seems similar to what we see right now with a dashed, horizontal line. Back in 2018, the pullback ended when the USD Index moved to its first Fibonacci classic retracement level (the 38.2% one). In case of the current rally, it seems that another classic retracement worked – the 61.8% one.
The very important detail about the June 2018 decline (and bottom) is that while this was the moment after which the USD Index’s started to move higher at a slower pace, it was also the moment after which the precious metals market started to decline faster.
At the beginning of the year, I wrote that the precious metals market was likely to decline and that the preceding rally was likely fake. That’s exactly what happened.
Right now, I’m writing that the recent rally was also fake (a correction within a medium-term decline) and – even more importantly – it seems likely that the next downswing could take place at a higher pace than what we saw so far this year. And – just as was the case in 2018 – this upcoming (fast) decline is likely to lead to the final bottom in the precious metals sector.
Thank you for reading our free analysis today. Please note that the above is just a small fraction of today’s all-encompassing Gold & Silver Trading Alert. The latter includes multiple premium details such as the targets for gold and mining stocks that could be reached in the next few weeks. If you’d like to read those premium details, we have good news for you. As soon as you sign up for our free gold newsletter, you’ll get a free 7-day no-obligation trial access to our premium Gold & Silver Trading Alerts. It’s really free – sign up today.
Przemyslaw Radomski, CFA
Founder, Editor-in-chief
Sunshine Profits: Effective Investment through Diligence & Care
* * * * *
All essays, research and information found above represent analyses and opinions of Przemyslaw Radomski, CFA and Sunshine Profits' associates only. As such, it may prove wrong and be subject to change without notice. Opinions and analyses are based on data available to authors of respective essays at the time of writing. Although the information provided above is based on careful research and sources that are deemed to be accurate, Przemyslaw Radomski, CFA and his associates do not guarantee the accuracy or thoroughness of the data or information reported. The opinions published above are neither an offer nor a recommendation to purchase or sell any securities. Mr. Radomski is not a Registered Securities Advisor. By reading Przemyslaw Radomski's, CFA reports you fully agree that he will not be held responsible or liable for any decisions you make regarding any information provided in these reports. Investing, trading and speculation in any financial markets may involve high risk of loss. Przemyslaw Radomski, CFA, Sunshine Profits' employees and affiliates as well as members of their families may have a short or long position in any securities, including those mentioned in any of the reports or essays, and may make additional purchases and/or sales of those securities without notice.
********
share
share
share
share
share
 Przemyslaw Radomski, CFA, is the founder, owner and the main editor of SunshineProfits.com. You can reach Przemyslaw at: http://www.sunshineprofits.com/help/contact-us/.


