
Gold Forecast: Terminal Point to Current Gold Decline


 Since my last article from late-August, Gold has turned sharply lower, off an anticipated correction with our short-term cycles. As for U.S. stocks, this market has also been in a correction phase, with a bigger low there due into late-September to mid-October.
First, we'll take a look at the cyclical position of the Gold market.
Gold's 10-Day Cycle
The smallest cycle that we track is the 10-day wave in Gold, which is shown on the chart below:
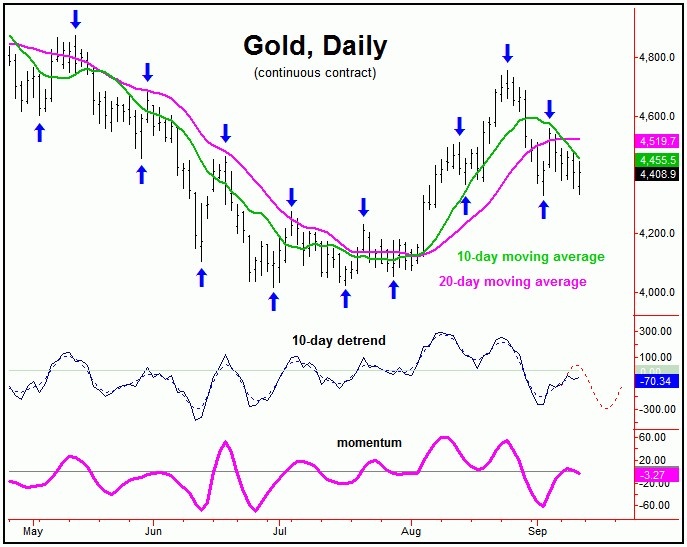
From my last article: "in terms of price, we noted the 4648.00 figure (December, 2026 contract) as the downside 'reversal point' for this 10-day cycle. In terms of time, the next trough for our 10-day cycle in Gold is projected for the early-September window, where it will likely turn up for what could/should be a decent 3-5 day (ideally, countertrend) rally."
As mentioned above, the last trough for our 10-day cycle was projected for early- September, with its actual low made on September 2nd, doing so with the tag of the 4329.20 figure (December, 2026 contract).
From there, a sharp short-term rally was seen, which was some 225 points off the bottom, which saw a left-translated peak forming at the 4558.50 figure - before turning down again into late last week, for a re-test of the lows for the swing.
With the above said and noted, the next smaller-degree low is expected to come from this 10-day wave, if not already in place. In terms of price, a new upside 'reversal point' is looking ready to form for this cycle, which - if broken above - would confirm its next rally phase to be back in force.
More key however is the bigger 34-day cycle in Gold prices.
Gold's 34-Day Cycle
The most dominant short-term cycle that we track is the 34-day wave in Gold, which is shown again on the chart below:

As mentioned in my article posted back in mid-August (i.e., "Gold & U.S. Stocks Setting up for Decline"), the last correction of significance was expected to come from this 34-day cycle. I noted then that the downside 'risk' was back to the 34-day moving average, and the lower 72-day cycle channel - each of which were well below price.
Having said the above, Gold needed to take out our downside 'reversal point' to best confirm a turn south with this 34-day wave, which we noted in our Gold Wave Trader report as being the 4491.20 figure (December, 2026 contract).
With that, on September 1st, this reversal number was broken below, thus triggering a near-automatic drop back to the 34-day moving average - and which was seen with the action that followed, with the metal dropping all the way down to a low of 4329.20.
Due to the bullish position of the bigger 72-day cycle (more in a bit), the correction phase of our smaller 34-day cycle was anticipated to end up as a countertrend affair, with support around the aforementioned 34-day moving average, as well as the lower (and rising) 72-day cycle channel. The recent decline has - at least so far - managed to hold around these key levels.
With the above said and noted, there is the potential for our 34-day cycle to have already bottomed. With that, we are watching a key upside 'reversal point' with price, that - once taken out - will confirm the next upward phase of this wave to be in force, with exact details on this posted in our Gold Wave Trader report.
Gold's 72-Day Cycle
Stepping back, the last low for our larger 72-day cycle in Gold was made back in late-June, which was in the expected bottoming range for this wave.
Shown below is our 72-day cycle in Gold:

As mentioned in recent articles, this 72-day cycle was last due to bottom into early-July, with its actual low having formed on June 30th, within the normal plus or minus for an expected low with this wave.
In terms of time, the current upward phase of this 72-day wave is favored to hold up into the late-September timeframe (plus or minus), before turning south into another low, currently projected for mid-October or later.
With the bullish configuration of this 72-day wave, the correction phase of the smaller 34-day cycle has been anticipated to end up as a countertrend affair, with key support as mentioned earlier, near the lower (and rising) 72-day cycle channel, plus or minus.
For the bigger picture, the next 72-day bottom into mid-October - if seen as noted - would be favored to give way to another sharp rally of some 15% or more, playing out into what currently looks to be early next year, before topping an even-larger tracked 154-day cycle; more on this in a future article.
U.S. Stock Market
As mentioned in my past articles, the last larger low for the SPX (i.e., the S&P 500 index) was made back in late-March, which was a 180-day cycle bottom. In terms of time, my analysis projected the upward phase of this 180-day cycle higher into late-July to mid- August, where it was expected to peak.
Going further with the above, there was a particular focus on the mid-August timeframe to top this 180-day cycle, with the highest high (so far) coming in with the August 13th tag of 7816.70 SPX CASH.
Here again is that 180-day cycle in U.S. stocks:

As mentioned in my article back in late-August, the next larger correction phase was due to play out with this 180-day wave, which is next projected to trough into the late- September to mid-October timeframe - but with a key focus on the latter.
In terms of price, the downside 'risk' is back to the 200-day moving average on the SPX. This moving average could also act as key support (plus or minus) to the correction phase of this 180-day component.
With the above said and noted, while this 180-day cycle may have already topped, it will take a reversal below a key number that we are watching to best confirm. Once taken out, that will be the trigger for the expected decline back to the 200-day moving average on the SPX, with exact details always posted in our daily Market Turns report (which tracks the U.S. stock market).
In terms of patterns, the coming correction with our 180-day wave is expected to end up as a bigger countertrend affair, holding above the late-March low of 6316.91 SPX CASH. With that, an Autumn, 2026 low with this wave - if seen as noted - would be expected to give way to a sharp rally of some 20-25% or more, into late-Spring of next year, setting up a potential peak in a much larger 18-year cycle in U.S. stocks. Stay tuned.
Jim Curry
The Gold Wave Trader
Market Turns Advisory
http://goldwavetrader.com/
http://cyclewave.homestead.com/
********