
Gold Price Forecast: The Final Shakeout Is Happening Now


 Gold and silver are approaching critical support levels, and I believe the final shakeout is underway.
The current correction closely resembles the 2022 midterm election pattern, when gold established a major bottom just days before voters went to the polls. With sentiment extremely bearish and next week’s elections approaching, a significant turning point could be near.
- Gold’s 2022 Pattern: Gold is following a remarkably similar correction to 2022, suggesting a major bottom could form within days.
- Metals and Miners: Gold, silver, and mining stocks are approaching critical support levels that could mark the end of the correction.
- Election Wild Card: Next week’s election results could trigger an immediate reversal or extend the selloff into December, potentially pushing gold toward $3,500.
Gold 2022 vs. 2026
Gold experienced a similar correction in 2022, which was also a midterm election year. Prices peaked in the first quarter, established an initial low in July, rallied into August, and then formed a final bottom just days before the November elections. The current setup closely resembles that pattern, suggesting gold could bottom any day now.

Gold futures trade near $3,919, with the chart highlighting similarities between the 2022 and 2026 corrections and a projected recovery toward $10,000.
WTIC
Crude oil remains a wild card as we enter November. A sustained breakout above $105 could trigger a rapid advance toward $120. If Republicans lose big on November 3, Trump could take an aggressive stance toward Iran. This is purely speculation, but it’s a geopolitical risk worth keeping on the radar.

WTI crude oil trades at $104.18, testing descending resistance near $105. The chart highlights a potential move toward $120 on a breakout, with ascending support near $95.
Gold
Gold is approaching critical support near $3,950, and I believe a bottom could form any day, similar to what we saw in 2022. However, if Democrats sweep both the House and Senate next week, a broader equity selloff could drag gold below $3,800. Under that scenario, I would shift my focus to a potential bottom around the December 9 Fed announcement.
In short, price action surrounding next week’s elections should help determine whether gold establishes an immediate bottom or extends its correction for another month.

Gold trades at $3,919.61, slipping below the $3,950 support level after a prolonged decline from its February peak near $5,608.
Silver
Silver is trading within a falling wedge pattern and is currently retesting its lower trendline. With prices approaching this critical support, a bottom could be imminent.

Silver trades at $49.41, approaching the lower trendline of a falling wedge after declining from its February peak near $121.64.

Silver Monthly
The monthly chart also points to the potential for a backtest of the breakout area near $49.50.
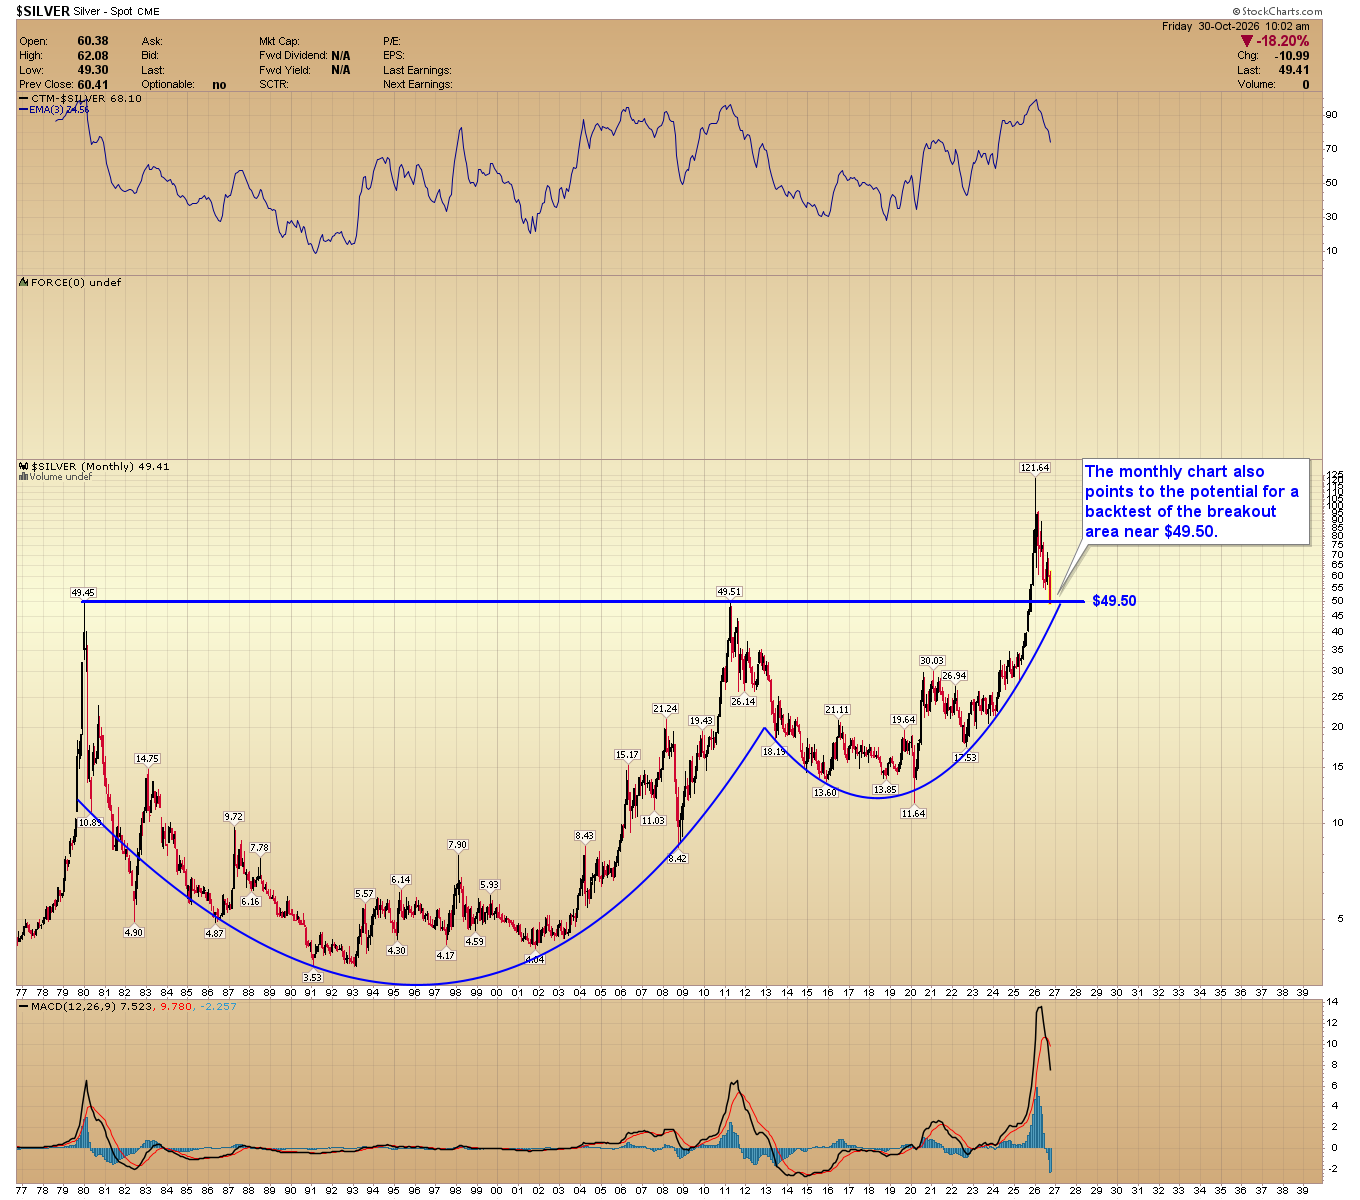 Silver trades at $49.41, retesting the $49.50 breakout area after retreating from its peak at $121.64. The monthly chart highlights this historical price level and a long-term rounded recovery pattern.
Platinum
Platinum is breaking below $1,500, raising the possibility of a further decline toward support at the lower trendline.
 Platinum trades at $1,424.40 after breaking below $1,500, extending its decline from the $2,880.40 peak toward the lower descending trendline.
GDX
Miners have surrendered most of their August gains, with prices approaching the final gap support near $76.00. I expect miners to outperform gold going forward, and establishing a bottom above the July low would strengthen that outlook.

GDX trades at $77.46 after retreating from its August peak near $105.67, approaching horizontal support at $76. The chart also highlights the July low near $69.74.
GDXJ
Junior miners have retraced nearly all of their August gains and are approaching final gap support near $92.50, a key level to watch for a potential bottom
 GDXJ trades at $95.65 after retreating from its August peak near $136.25, approaching horizontal support at $92.50. The chart also highlights the recent low near $97.34.
SILJ
Silver juniors need consecutive closes below $23.00 to confirm a breakdown toward $20.00. Conversely, a close back above $24.00 next week would signal a potential bottom.
 SILJ trades at $22.63 after declining from its August peak near $33.58, approaching the $20 support level. The chart also highlights the recent low at $22.68 and resistance near $24.
NEM
Newmont remains the market leader, and I expect it to be among the first miners to confirm a durable bottom. I’ll be watching for sustained closes above the downtrend line as an early indication that a meaningful reversal is underway.
 Newmont trades at $106.82 after retreating from its August peak near $135.01. The chart highlights a descending resistance trendline and a recent low at $106.96.
S&P 500
In my view, the stock market remains vulnerable to a sharp post-election selloff, particularly if Democrats sweep both the House and Senate next week. A break below 7,500 could trigger accelerated selling, potentially dragging metals and miners lower into December.
 The S&P 500 trades at 7,631.49 after retreating from its October peak near 7,844.52. The chart highlights horizontal support at 7,500 and a recent low near 7,612.07.
Bitcoin
Bitcoin is rolling over, and consecutive closes below $75,000 would confirm a breakdown and open the door to fresh lows in Q4. In my view, this bearish scenario would likely require a sharp post-election stock market selloff.
 Bitcoin trades near $77,004 after retreating from its September high of $87,300. The chart highlights critical support at $75,000, with RSI weakening and MACD turning negative.
Conclusion
Sentiment toward metals and miners is extremely bearish, suggesting prices may be approaching a significant bottom. If prices stabilize and begin to strengthen following next week’s elections, it could signal that the lows are in place and a new uptrend is beginning.
However, if gold breaks below $3,800 after the elections, the correction could extend toward $3,500, with a potential bottom forming around the December 9 Fed decision.
For more price predictions and daily market commentary, consider subscribing at www.GoldPredict.com.
********