The Scorching Gold & Silver Rally Ahead
 share
share
 share
share
 share
share
 share
share
 share
share
The precious metal sector did exactly as predicted in the article WHEN THE RUBBER HITS THE ROAD - THE SCORCHING PM SECTOR RALLY AHEAD posted on the site about a week ago with breakouts by metals and stocks last week from Flag / Pennant consolidation patterns into powerful uplegs. The purpose of this update is to appraise you of the fact that the really big action hasn't even started yet, but it will soon and we will proceed to see exactly why in this update.
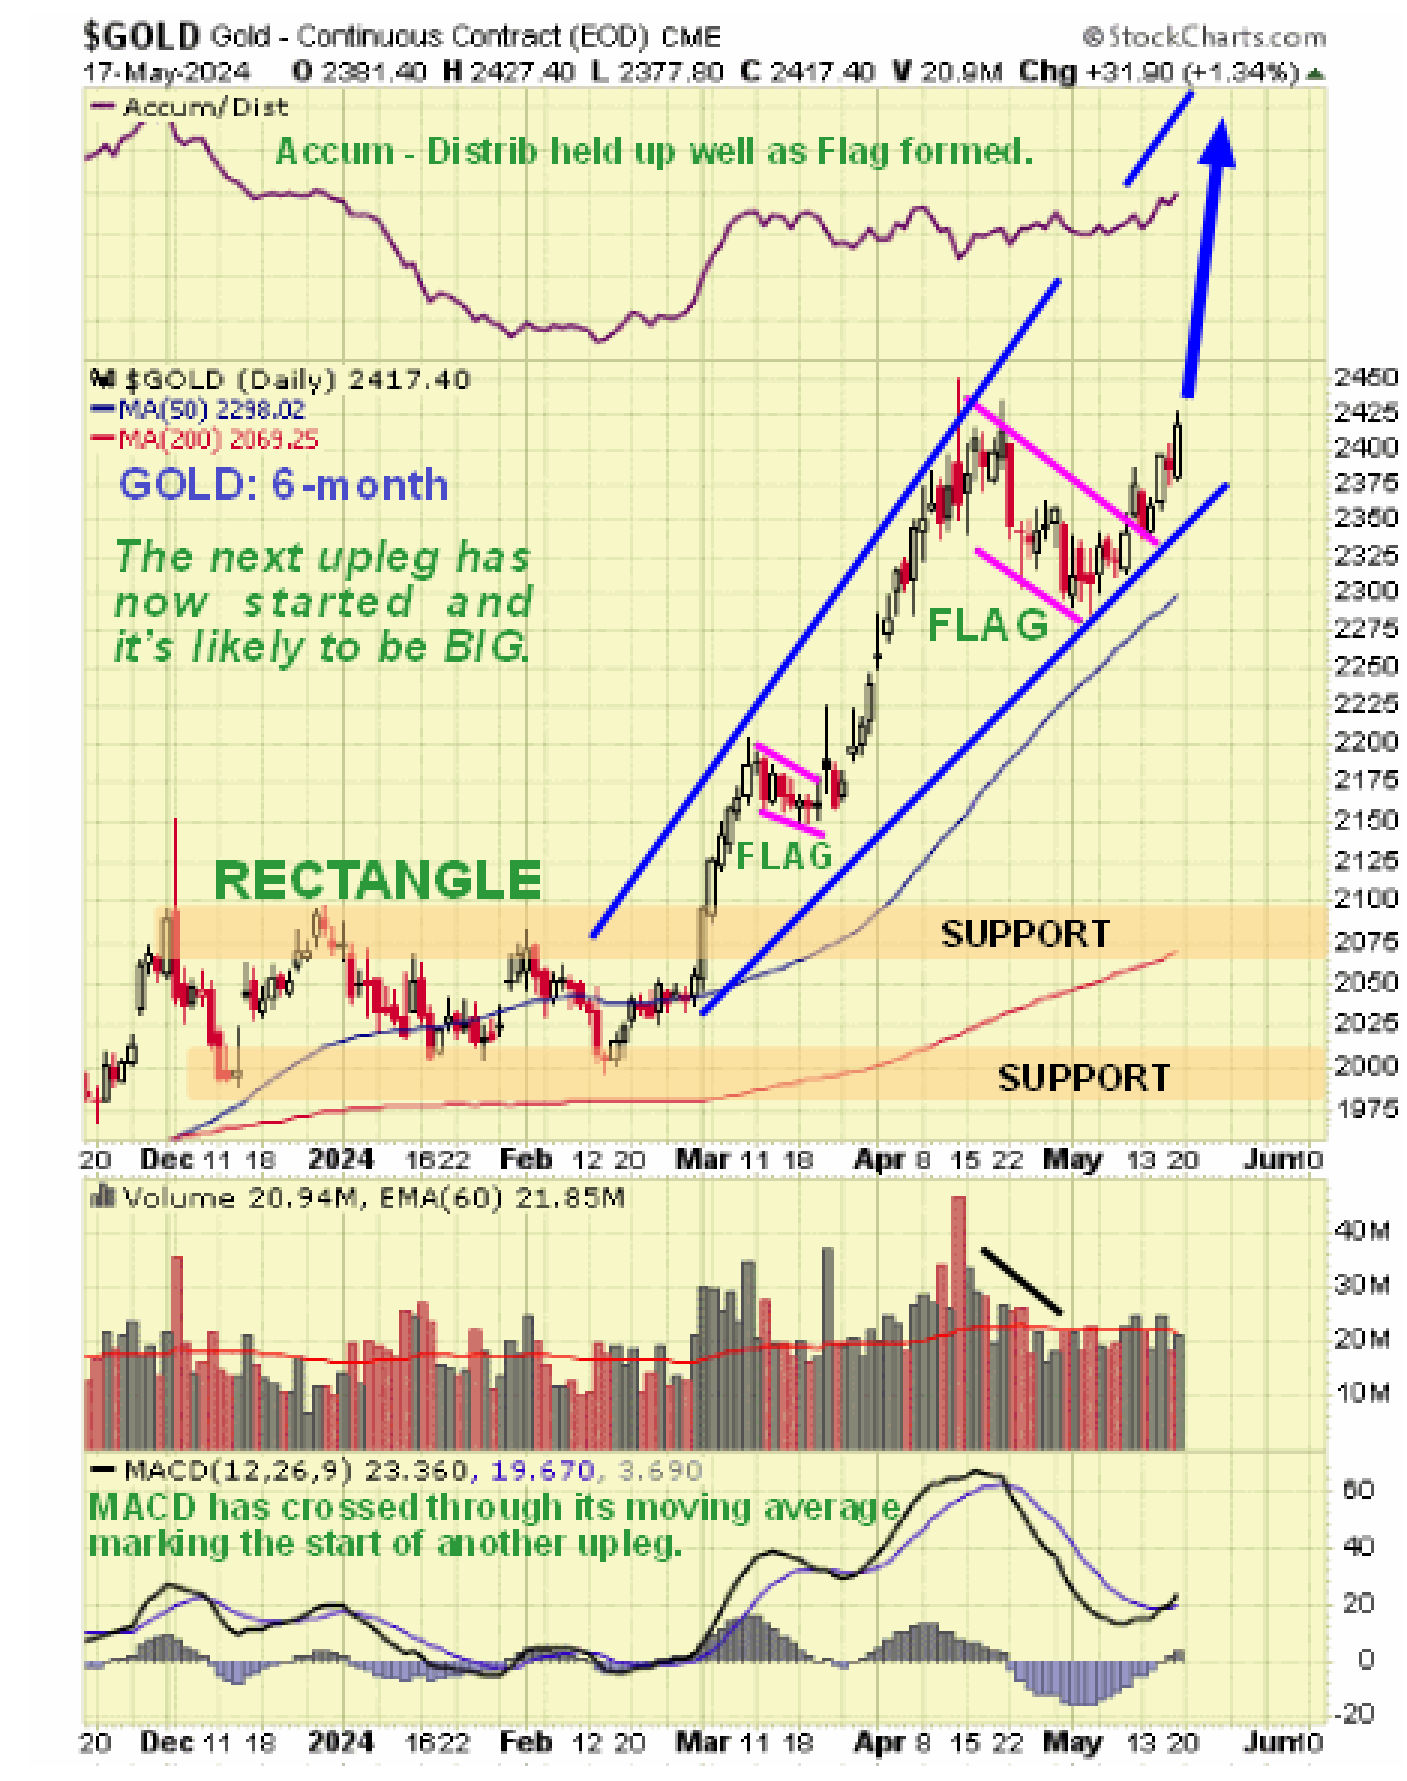
Let’s start by reviewing what happened. Our first chart is the 6-month chart for gold and it’s interesting to see that while silver and PM stocks raced ahead last week, gold’s new upleg has barely gotten started and it has yet to break above the resistance at its early April highs – it will though and when it does it is expected to soar towards the upper rail of the uptrend channel shown and that implies further strong gains by silver and PM stocks in the days and weeks ahead.
 Silver, however, showed no such hesistancy and broke out of its bull Flag and raced ahead, clearing the important psychological $30 barrier almost as if wasn’t there and as we can see on its 6-month chart it looks set for further gains as it has a ways to go before it reaches the upper rail of its uptrend channel. We correctly anticiated this development and bought a raft of 6 SILVER STOCKS POISED TO ADVANCE about a week ago, all of which are up, some substantially like Dolly Varden.
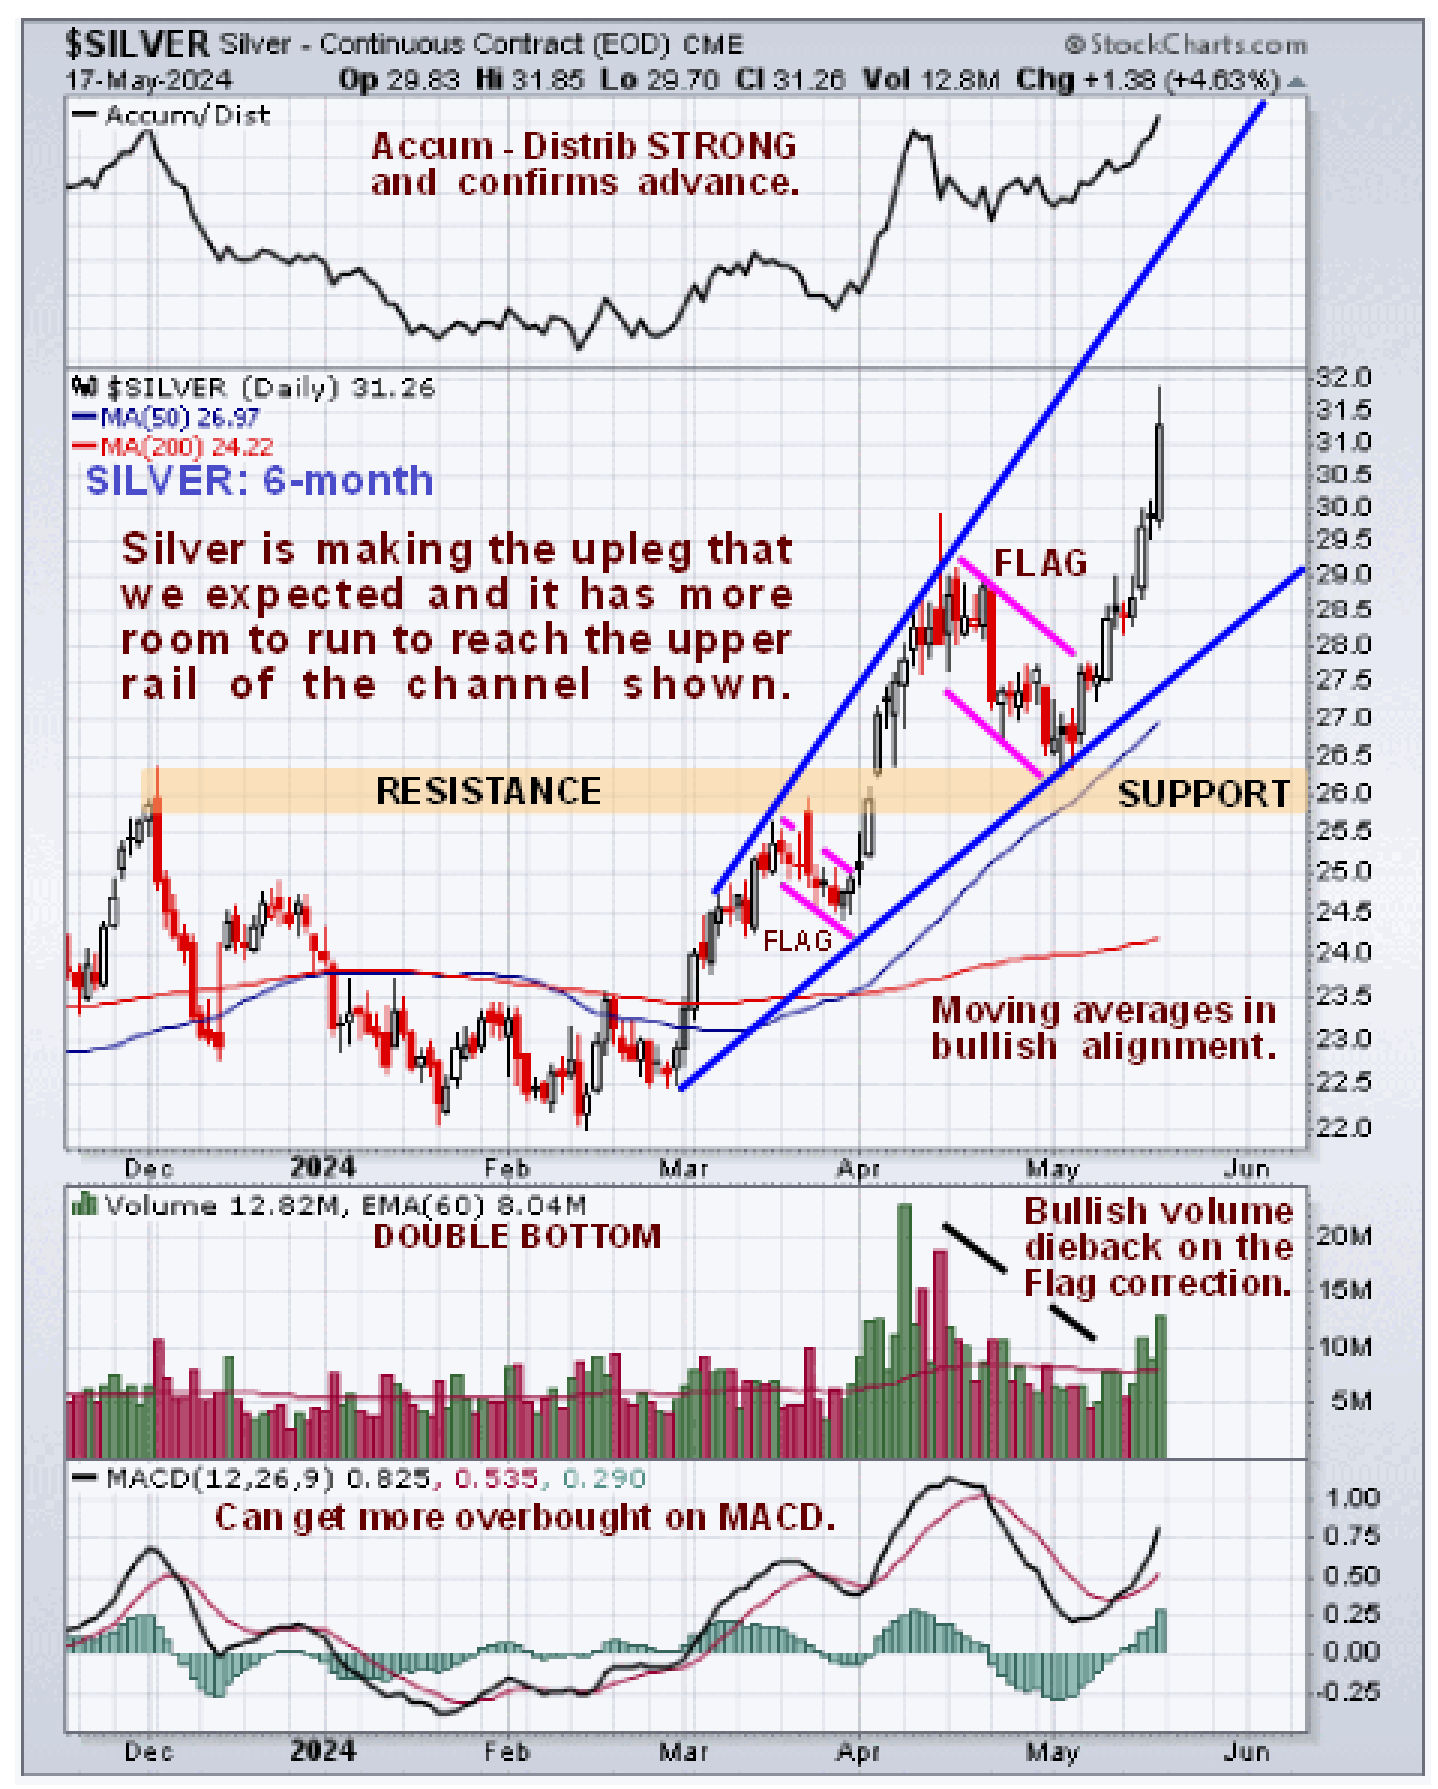 This break above $30 by silver was an important technical milestone for as we can see on the 20-year chart it means that it has cleared the important resistance established at this level back in 2020 and 2021 which means it now has its sights set on its 2011 highs at about $50 as its next major objective…
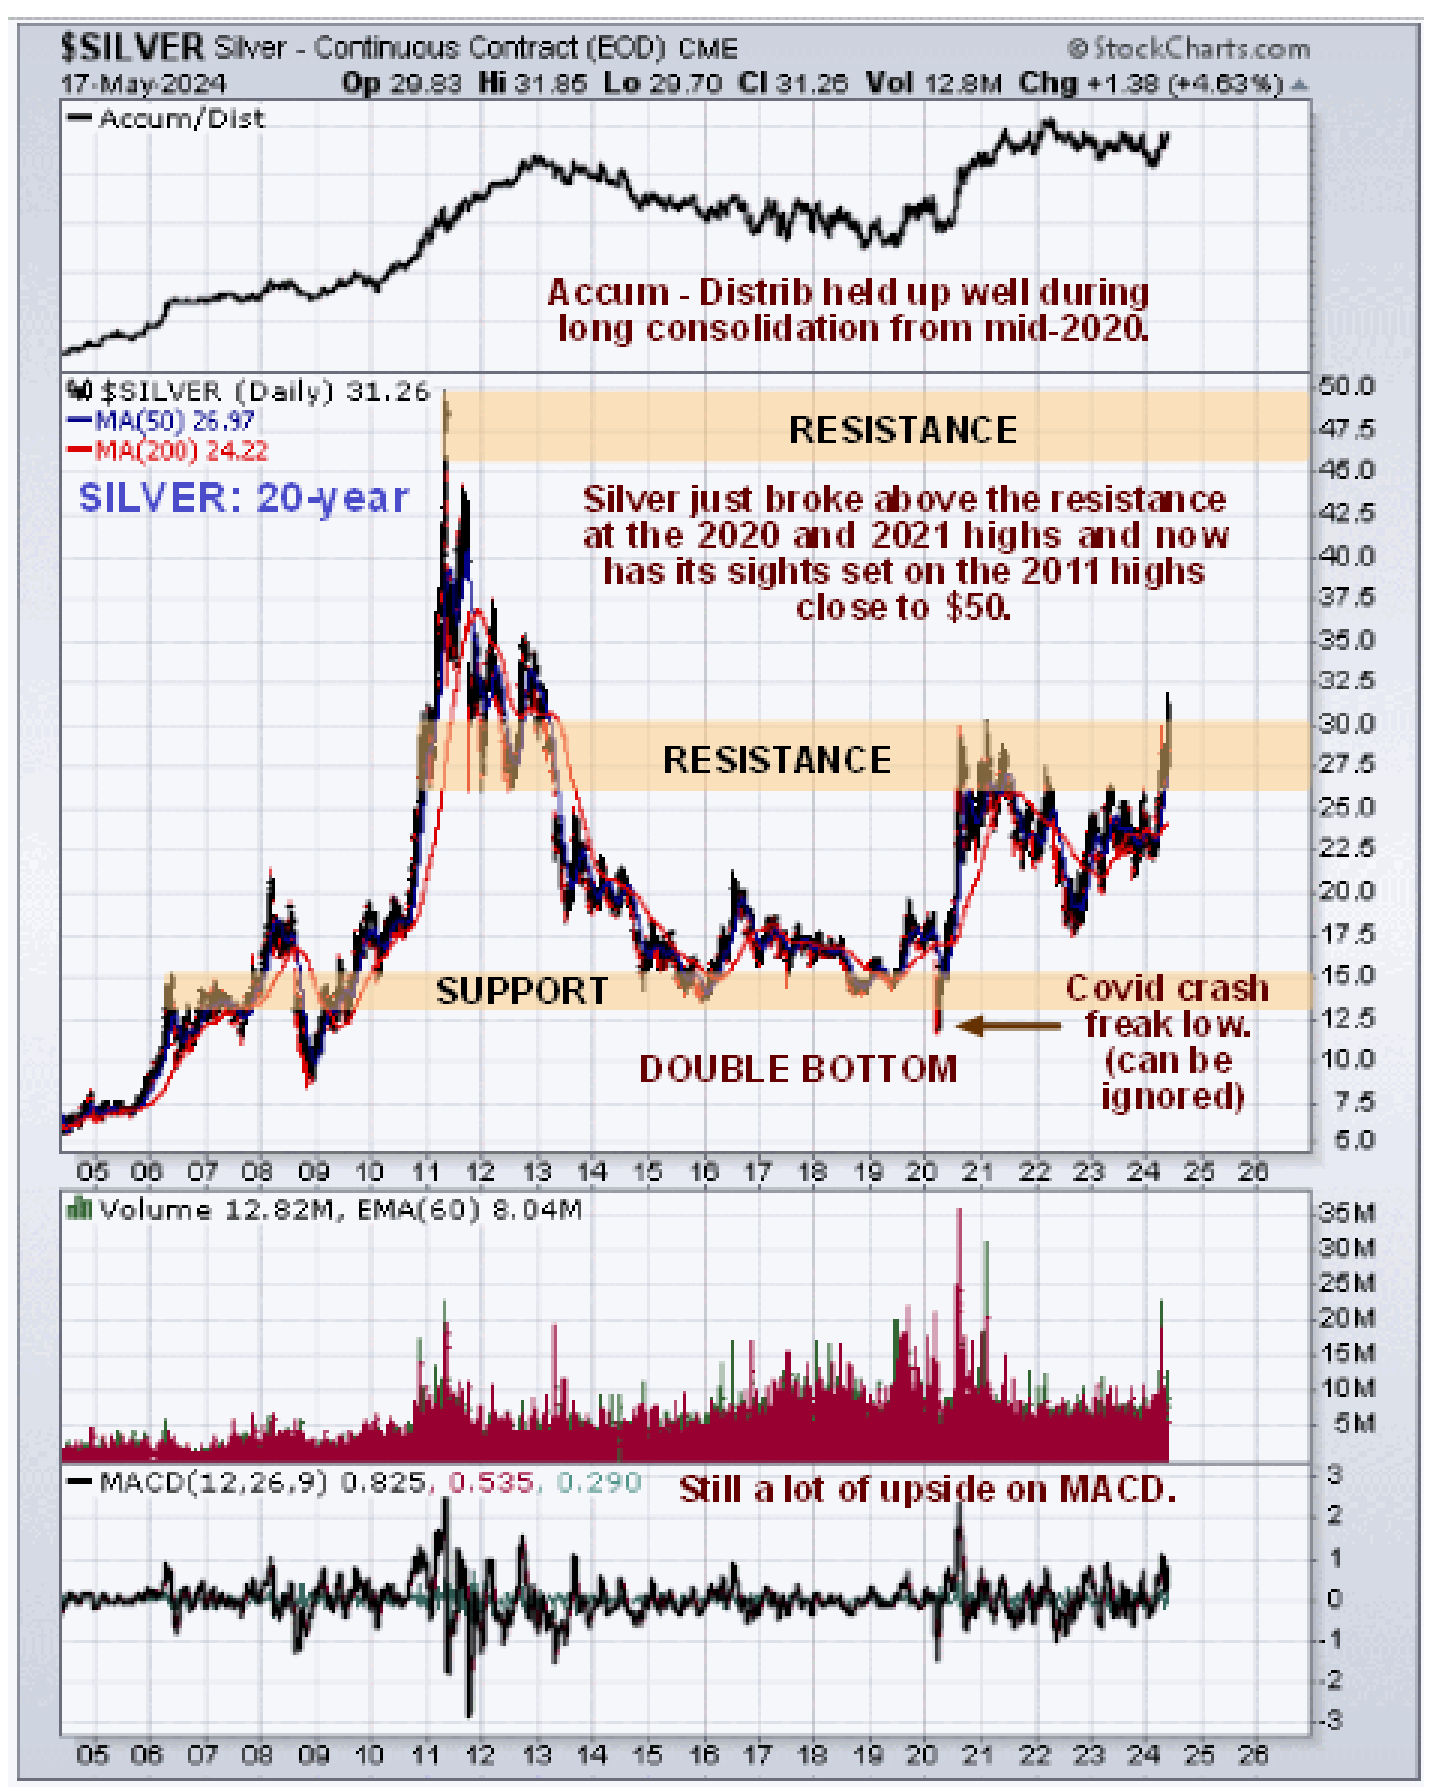 PM stocks meanwhile continued to forge ahead, especially on Friday, building on the breakout from the bull Pennant of 9th May as we can see on the 6-month chart for sector proxy GDX which shows that they have plenty more upside before they arrive at the upper rail of their uptrend channel…
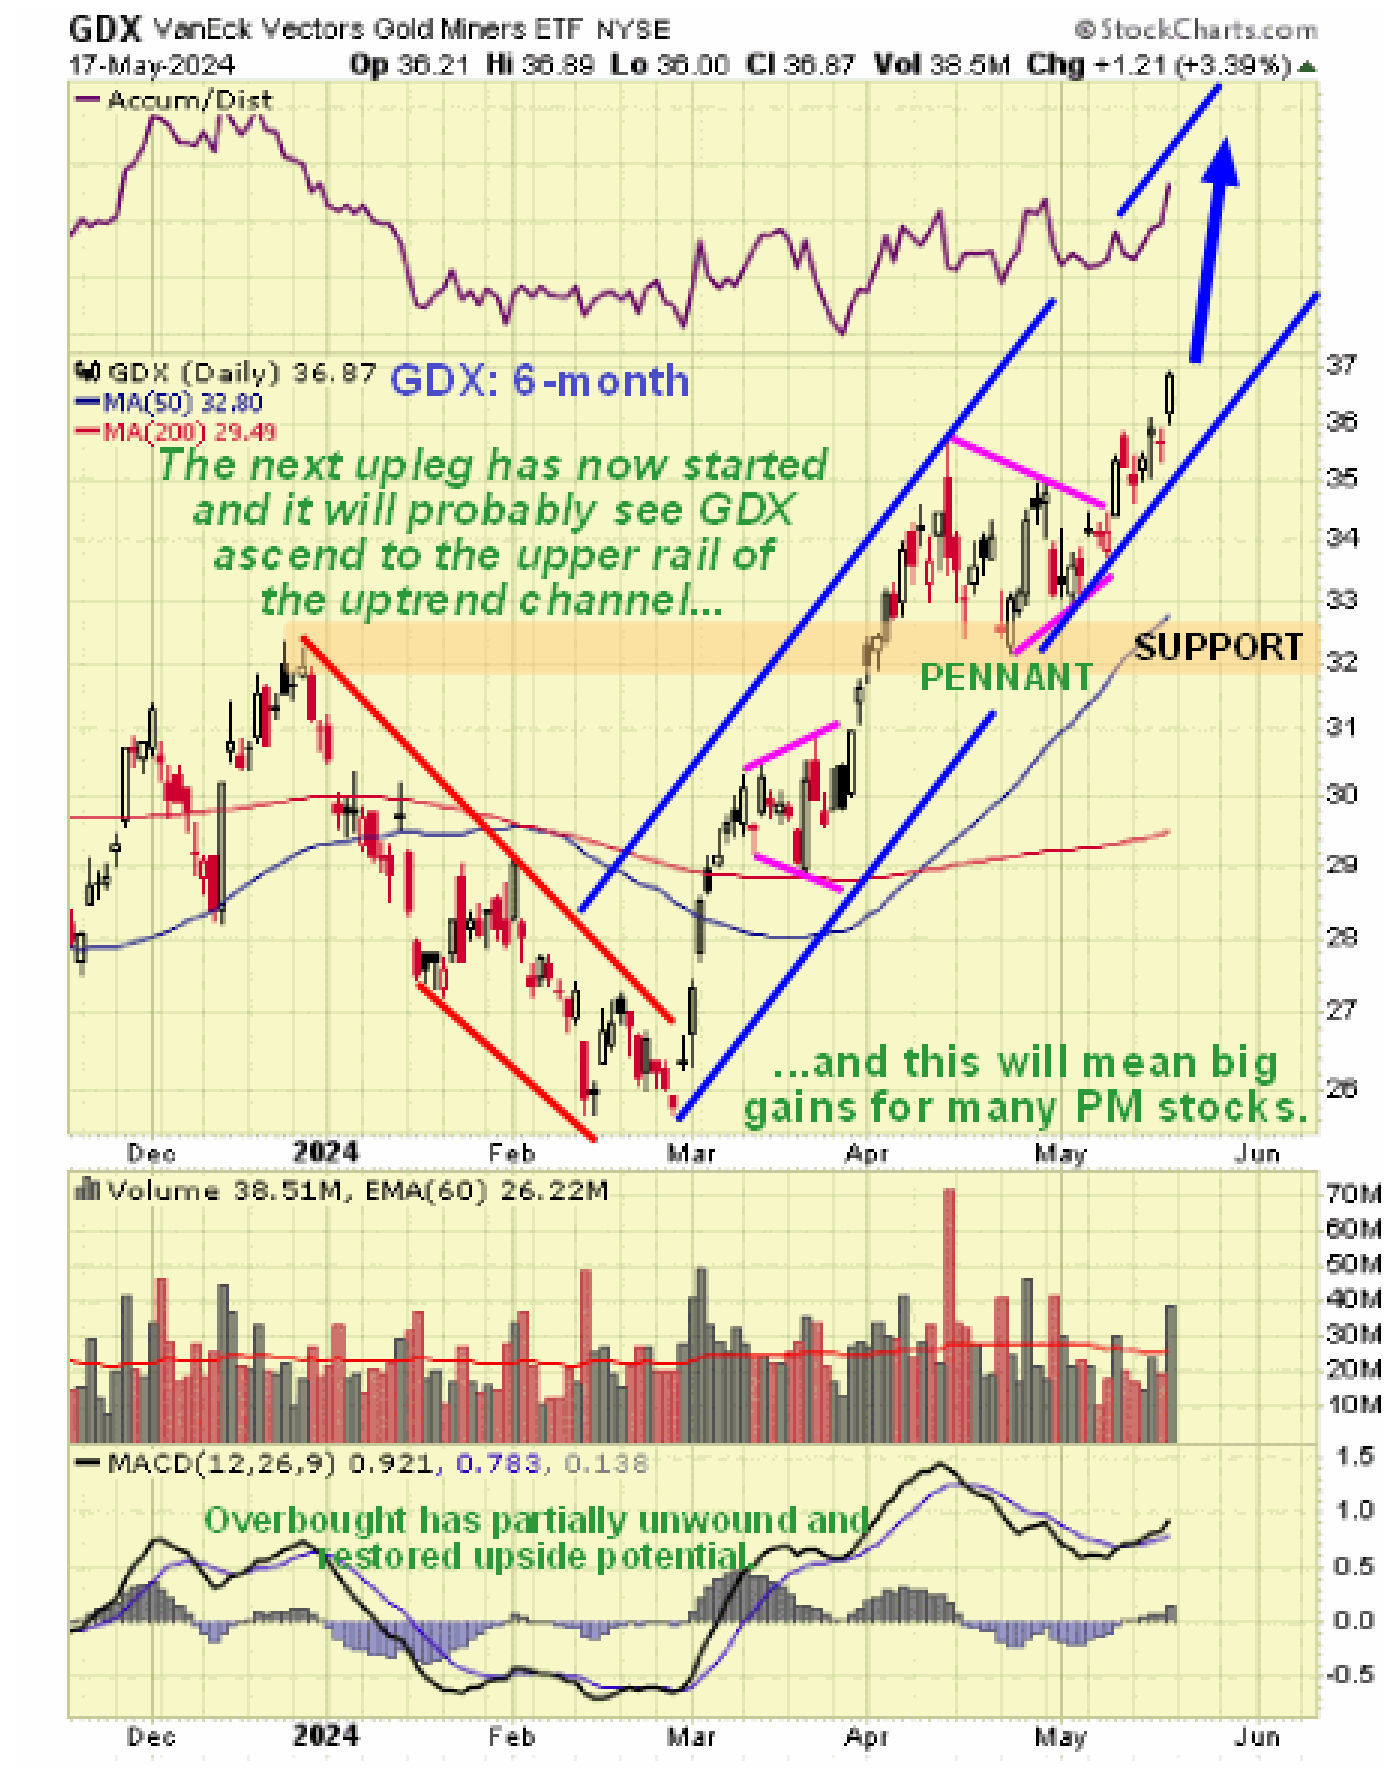
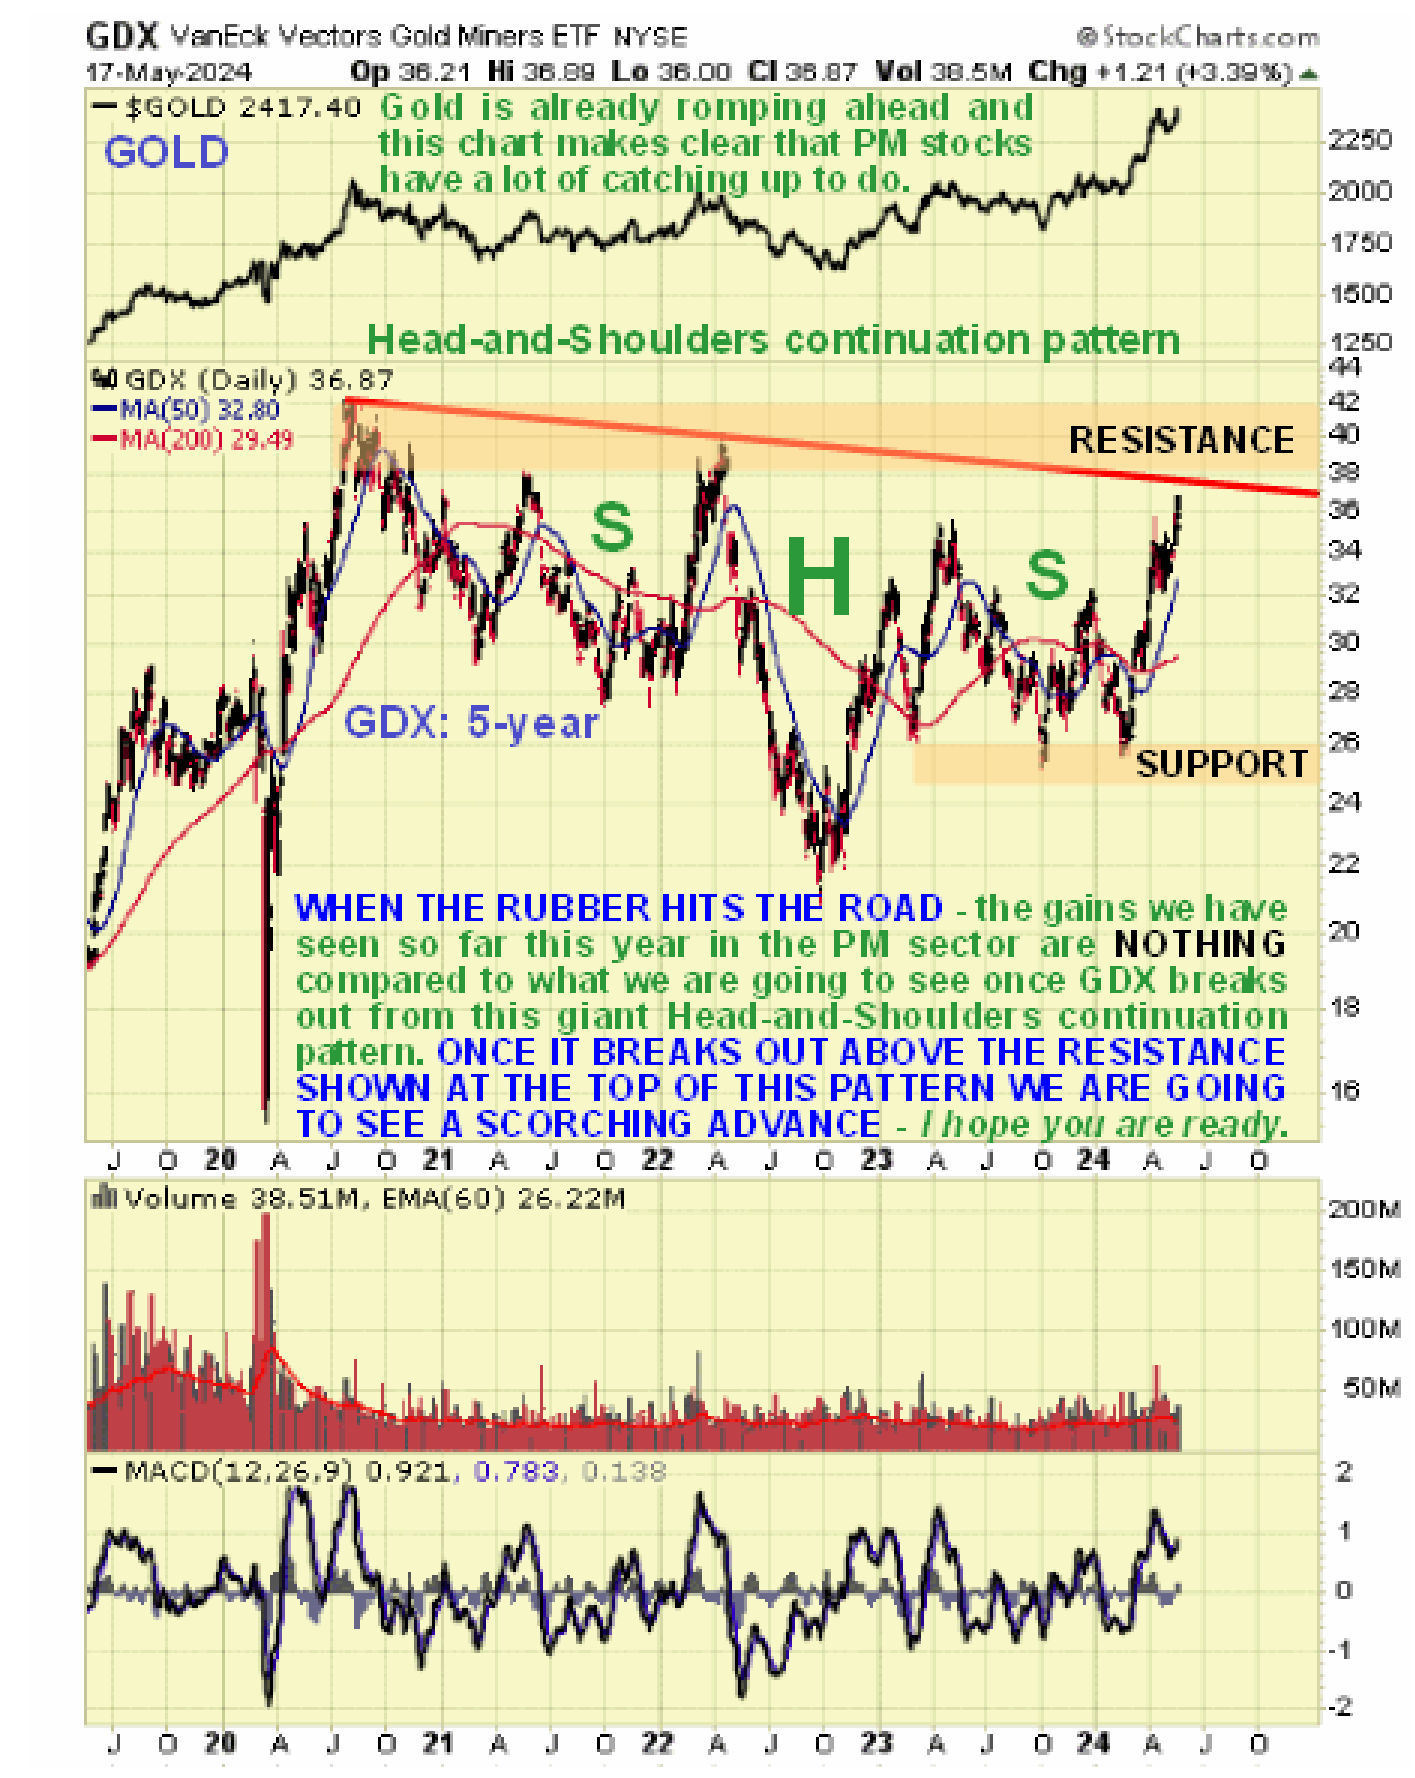
The 5-year chart makes clear the reason for the claim at the start of this article that THE REALLY BIG ACTION HASN’T EVEN STARTED YET which is that, despite the gains so far, GDX is still some way from breaking out of the giant Head-and-Shoulders continuation pattern shown on this chart. The real action will start once GDX breaks above not just the neckline of the H&S pattern (the red line) but above the band of resistance that marks the upper boundary of the entire pattern and dates back to the 2020 highs. Sentiment indicators continue to show that there is still little interest in the sector and a lot of skepticism, which is of course very bullish. This will change and change fast once GDX breaks above the key resistance with a lot of investors coming down off the fence and piling in, driving a robust rally…
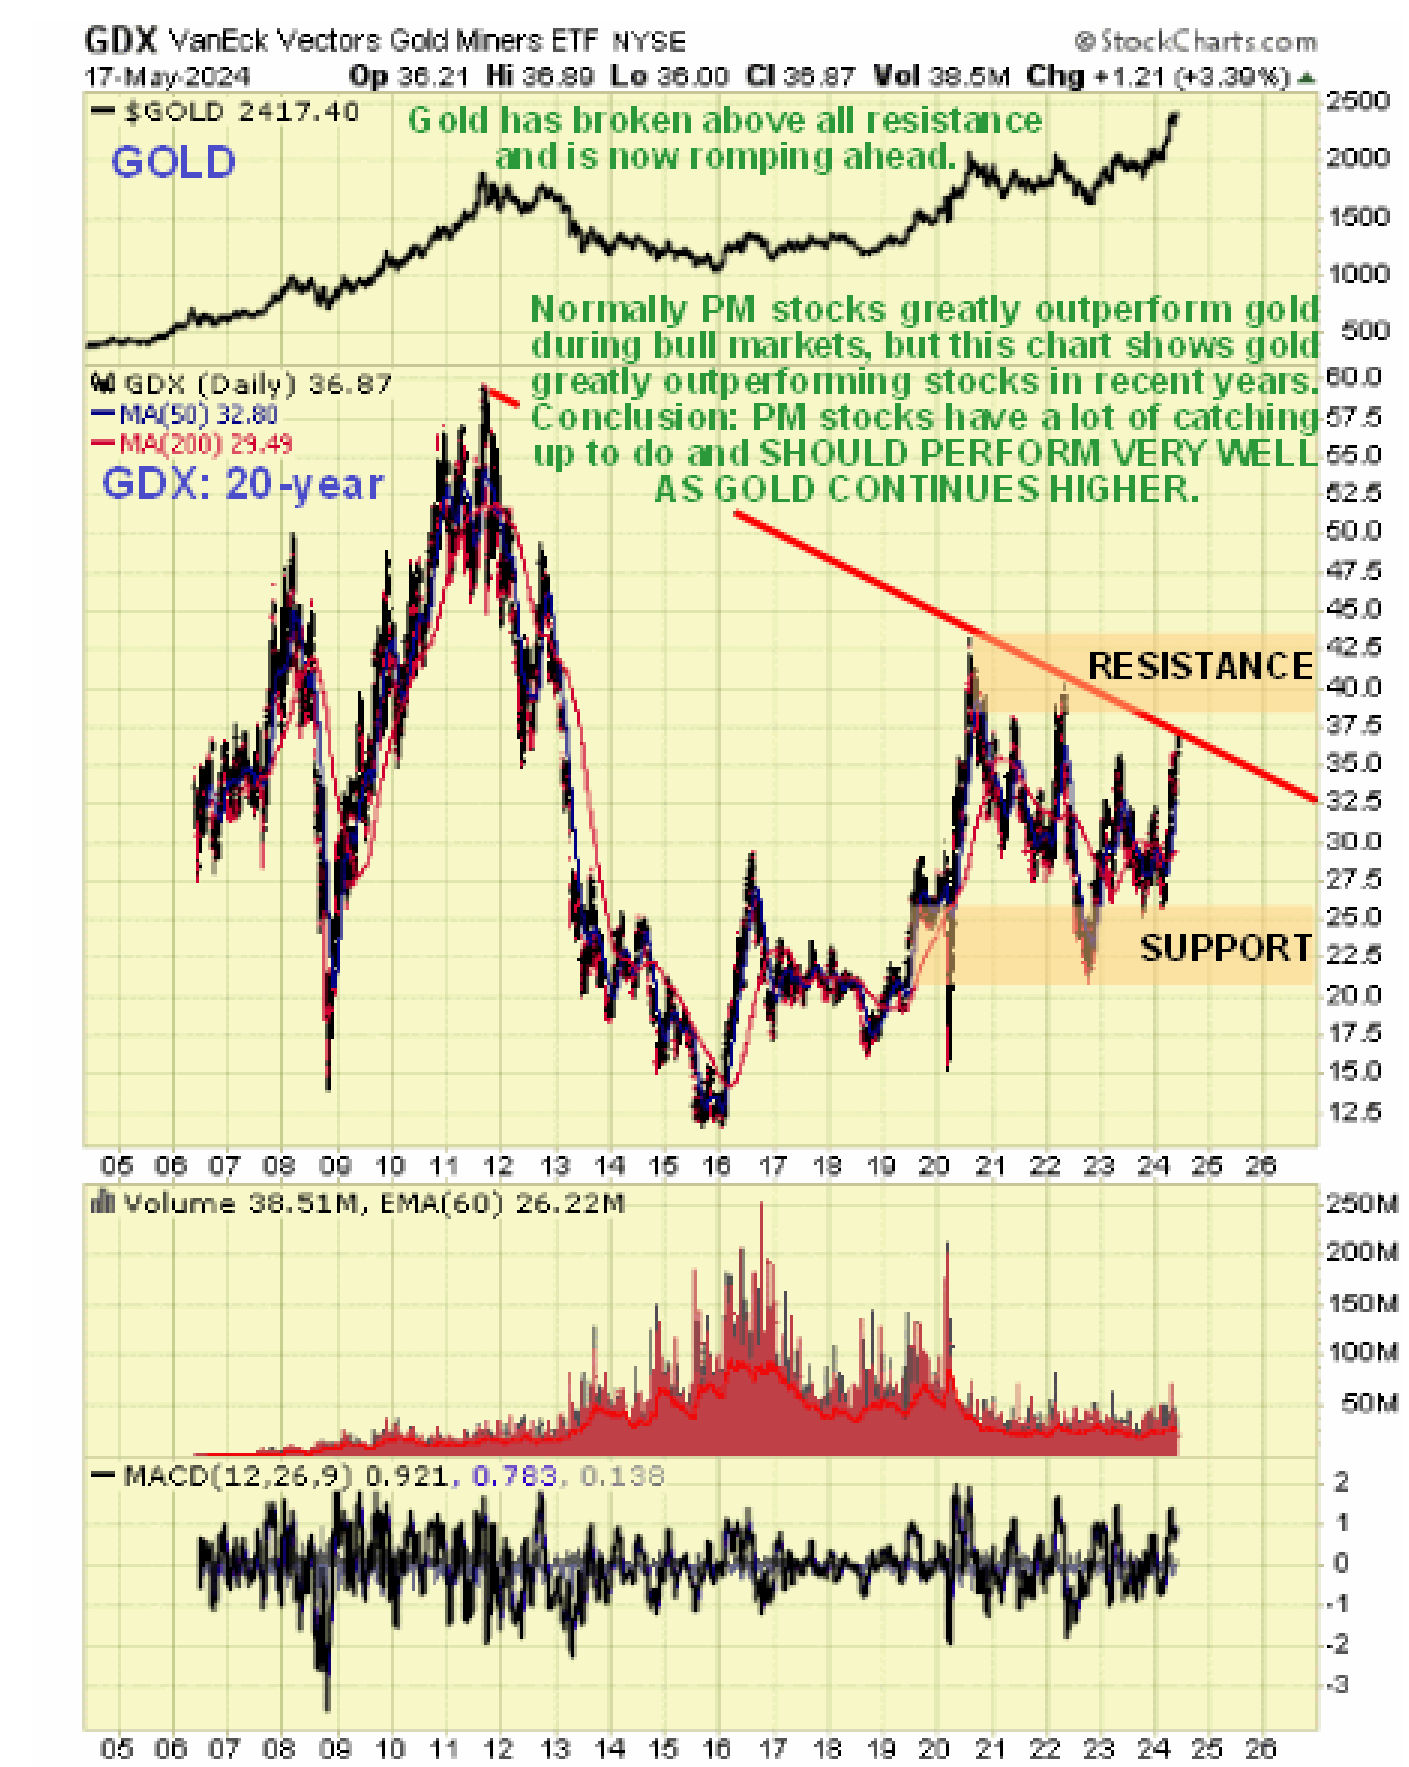
The 20-year chart for GDX is most interesting as it shows very clearly why the PM sector has such huge upside from here. One is that GDX is still way below its 2011 highs and this despite gold having made clear new highs. Gold is shown at the top of this chart and we see that it is romping ahead with a now very big positive divergence relative to PM stocks. This isn’t the way it is supposed to be - traditionally during sector bullmarkets stocks way outperform bullion for the obvious reason that with their high fixed costs mines become vastly more profitable as gold continues to appreciate. What this means is that PM stocks have a lot of catching up to do – and the more gold (and silver) ascend, the more catching up there will be to do. This is why PM stocks are expected to rip higher once GDX overcomes the resistance shown on this chart, and the 5-year earlier.
Lastly we will take a quick look at the dollar because of the increasing likelihood of a dollar collapse which would be a big driver for strong gains not just by gold and silver but across the commodity complex generally.
The massive ruinous debts of the United States are common knowledge and they can only be maintained without a collapse into hyperinflation if the dollar retains its Reserve Currency status. That is imperilled partly because much of the world is tired of being under threat of military intervention or sanctions if they don’t play along with it. This is why the BRICS have formed and are rapidly gaining new members and some of them like China and Russia are so strong militarily that they cannot be attacked, although the US Neocons are trying – with a remarkable lack of success – to wear down Russia in Ukraine and have been “saber rattling” over Taiwan for a long time. The BRICS are already moving to circumvent the dollar and are set to launch a gold-backed currency soon that will push the dollar off its pedestal. In addition, with the US supporting Israel’s genocide of the Palestinians, it has become clear to pretty much the entire world that Israel controls the US to the extent that the US is in a political sense an extension of Israel. The way to “bring Israel and the US to heel” therefore is to destroy the dollar as a global reserve currency and thus remove the source of their power. This is a big reason for the BRICS new currency and also explains the heavy dumping of US Treasuries that is now underway. US Treasuries are toxic garbage that only an idiot would buy and it is understood that the Fed is having to intervene and monetize almost all new Treasuries issued which is massively inflationary and the vast amounts of new money created will destroy the value of the dollar which is expected to “crash and burn” leading to devastating hyperinflation. This alone will lead to gold and silver “doing a moonshot”.
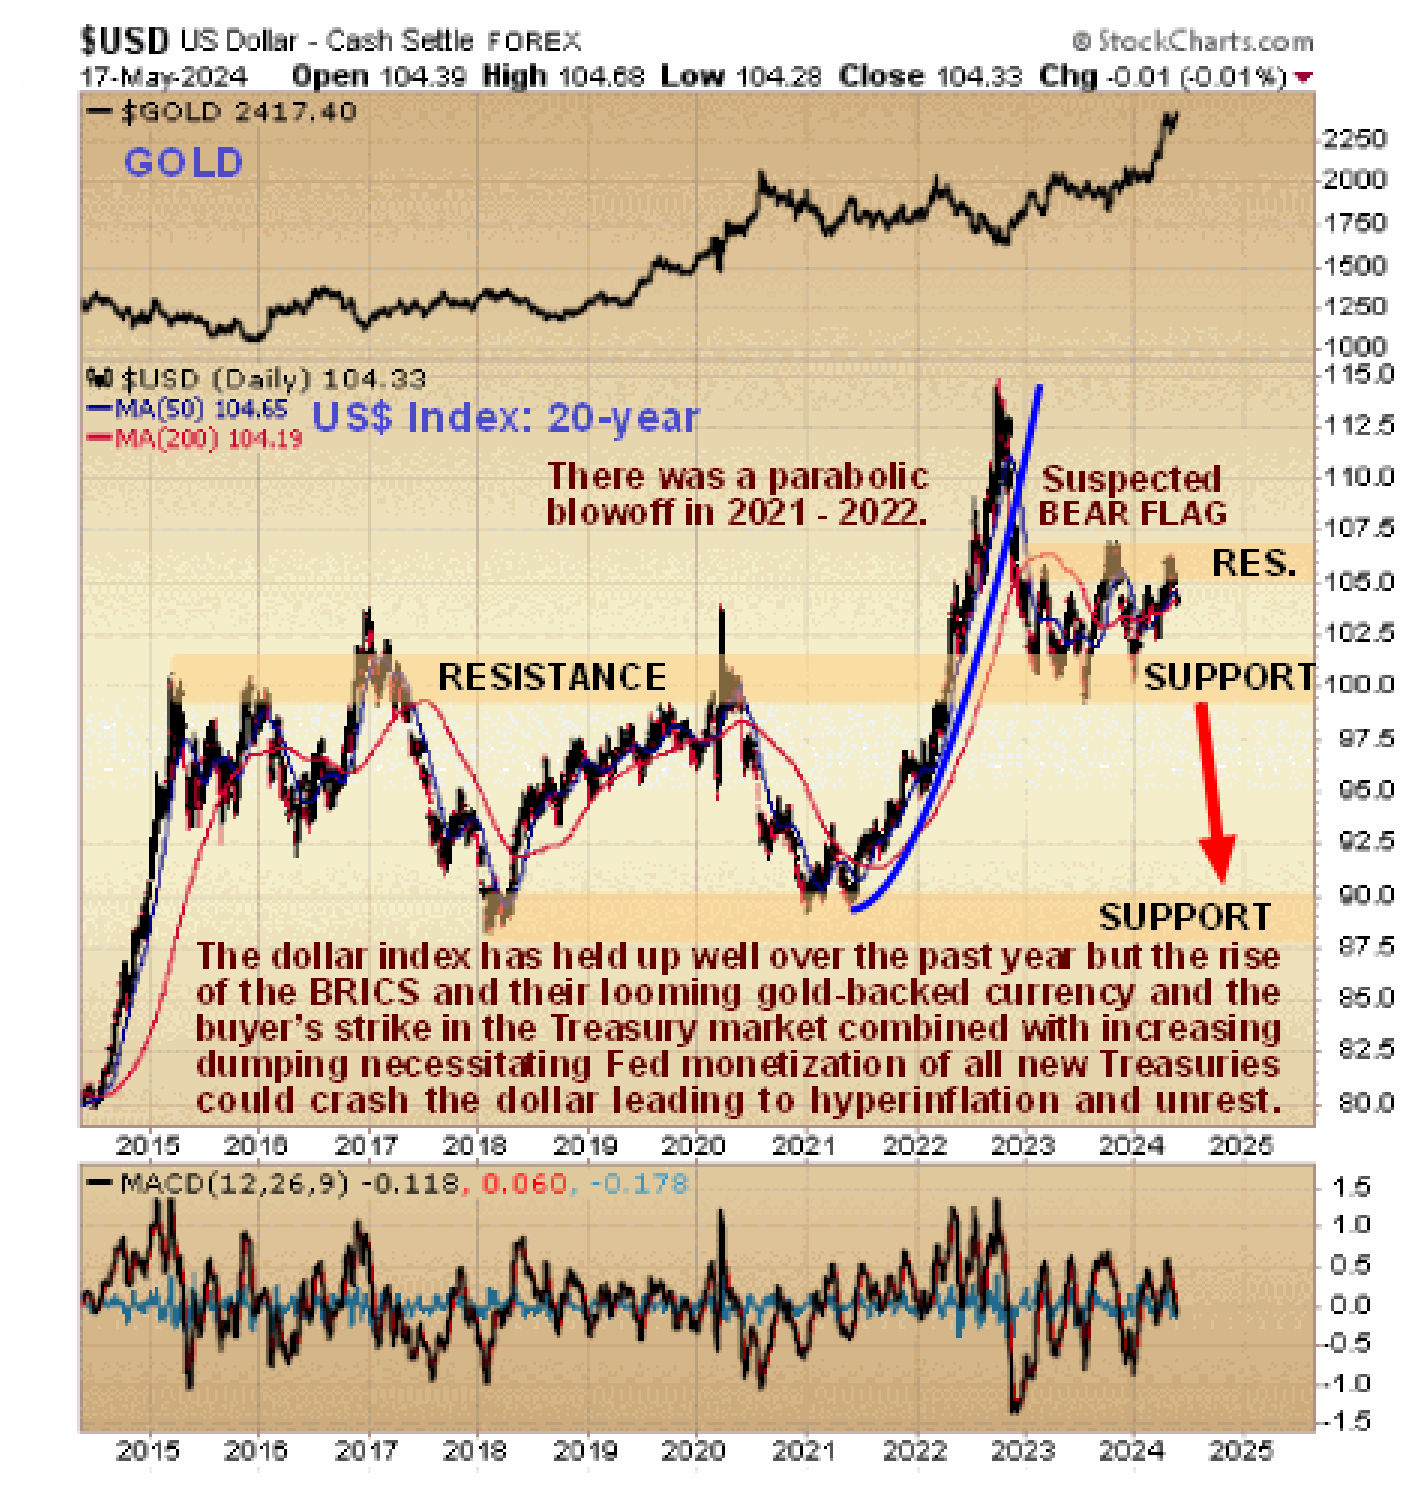
So let’s now take a quick look at a 20-year chart for the dollar index. On it we can see that, so far, it hasn’t collapsed and has actually held up very well in the circumstances. In looking at this chart we should keep in mind that as it is an index it is a measure of the value of the dollar relative to other currencies and since all currencies are losing purchasing power it doesn’t mean that because the dollar index has been more or less moving sideways since early 2023 it hasn’t lost purchasing power – it has, a lot. Going forward, if we see widespread dumping of Treasuries coupled with a buyer’s strike and the Fed aggressively monetising new issue, as looks likely, it means that the dollar and the dollar index will drop and drop hard. This is why the sideways range of the past year or so is suspected to be some sort of bear Flag that will lead to renewed severe decline, as shown, and if it does gold and silver and commodities generally will soar.
*********
share
share
share
share
share

Clive P. Maund’s interest in markets started when, as an aimless youth searching for direction in his mid-20’s, he inherited some money. Unfortunately it was not enough to live a utopian lifestyle as a playboy or retire very young. Therefore on the advice of his brother, he bought a load of British Petroleum stock, which promptly went up 20% in the space of a few weeks. Clive sold them at the top…which really fired his imagination. The prospect of being able to buy securities and sell them later at a higher price, and make money for doing little or no work was most attractive – and so the quest began, especially as he had been further stoked up by watching from the sidelines with a mixture of fascination and envy as fortunes were made in the roaring gold and silver bull market of the late 70’s.
Clive furthered his education in Technical Analysis or charting by ordering various good books from the US and by applying what he learned at work on an everyday basis. He also obtained the UK Society of Technical Analysts’ Diploma.
The years following 2005 saw the boom phase of the Gold and Silver bull market, until they peaked in late 2011. While there is ongoing debate about whether that was the final high, it is not believed to be because of the continuing global debasement of fiat currency. The bear market since 2011 is viewed as being very similar to the 2-year reaction in the mid-70’s, which was preceded by a powerful advance and was followed by a gigantic parabolic price ramp. Moreover, Precious Metals should come back into their own when the various asset bubbles elsewhere burst, which looks set to happen anytime soon.
Visit Clive at his website: CliveMaund.com