The Blindingly Obvious Case For Investing In Gold And Gold Stocks


The operating paradigm has been relatively straightforward in the financial world that we live in. The Federal Reserve (FED) sets monetary policy in terms of interest rates and new money creation, and does so in an attempt to influence the financial markets and keep the economy growing in a non-inflationary manner. Without judging their actions one can observe that we have had three major bubbles in the past 20 years. The schedule below from The Felder Report shows these bubbles clearly. The FED’s response to the Global Financial Crisis (GFC) in 2008 was extreme and resulted in eight years of zero percent interest rates, and the enormous creation of money through their quantitative easing program.
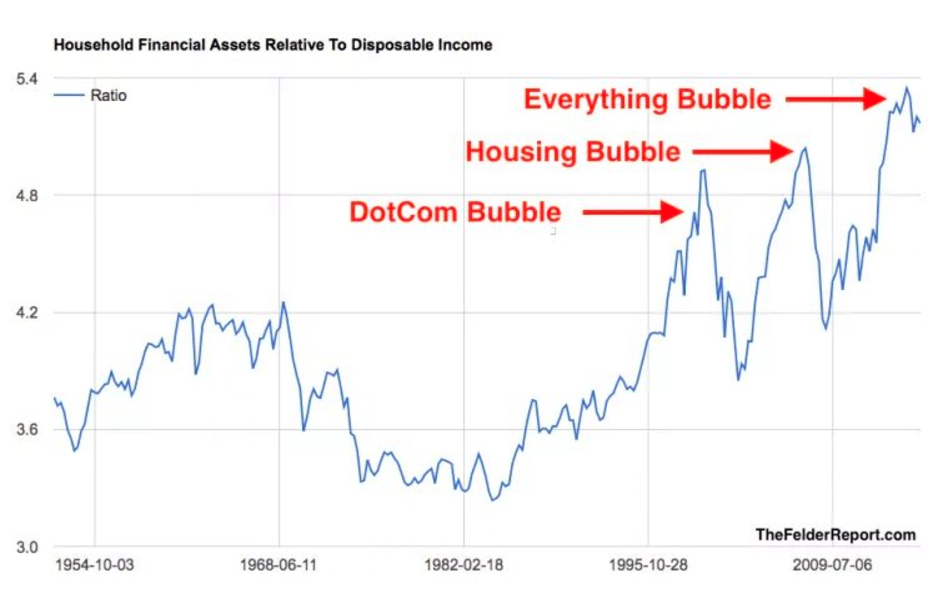
The reason that we are in the “Everything Bubble” today is that the excessive money created by the Federal Reserve and other central banks has flooded into financial assets. When you create a lot of money and put it into circulation it chases the asset classes which have been performing well. With falling interest rates post 2008, the performance of the US stock and bond markets has been strong and so the excess money which has been created has flowed there.
This can be seen in the following charts:
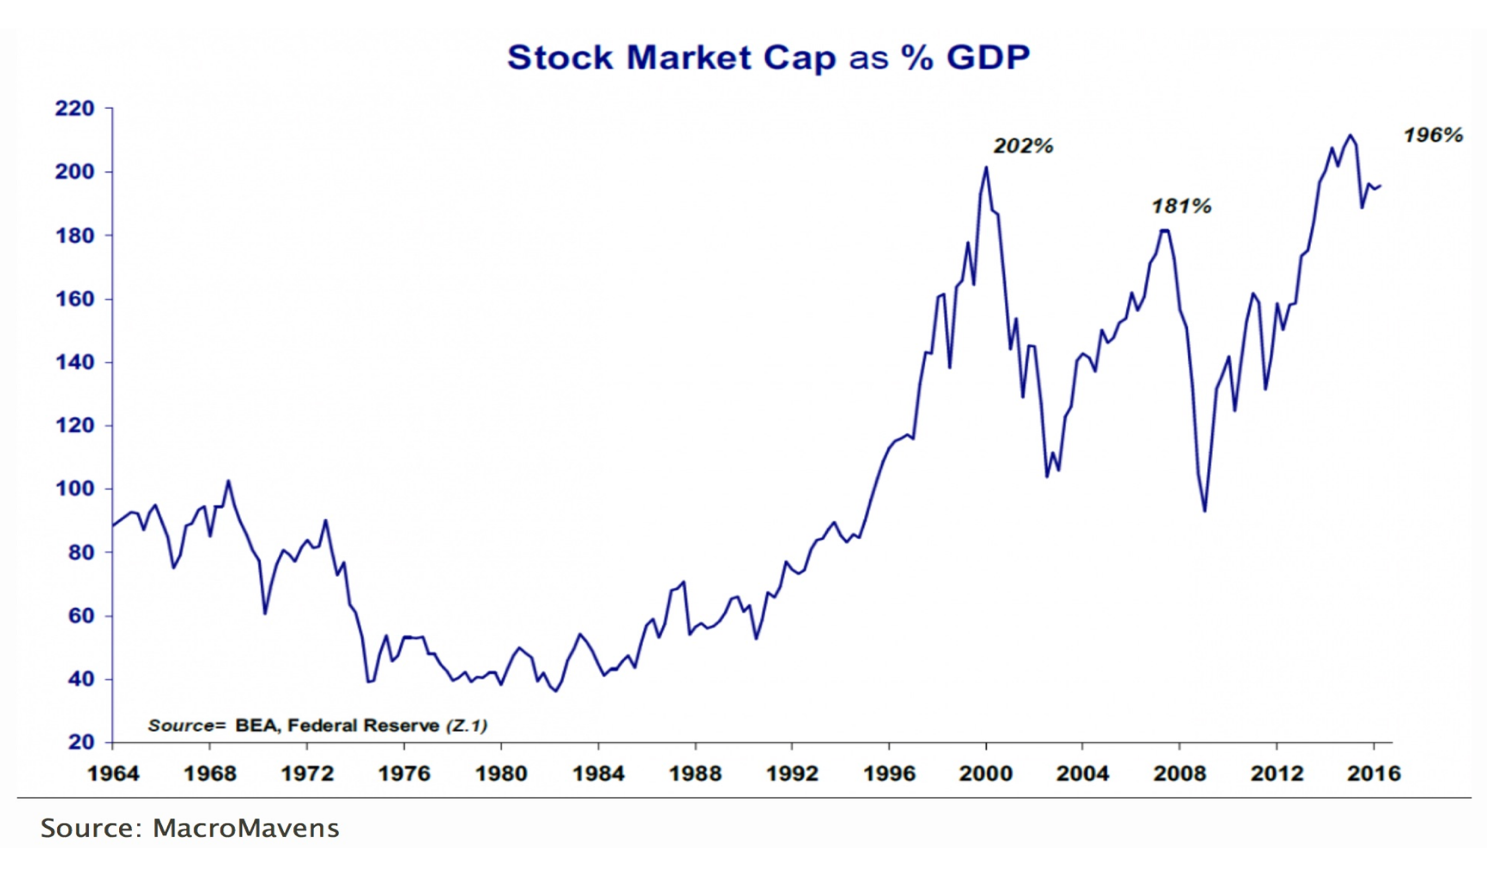
Note how the stock market capitalization as a percentage of GDP exceeds the pre-2008 crash level and is nearly equal to the pre-2000 crash level. This chart does not show it but in 2017 the stock market cap became 213% of GDP exceeding the year 2000 bubble peak.
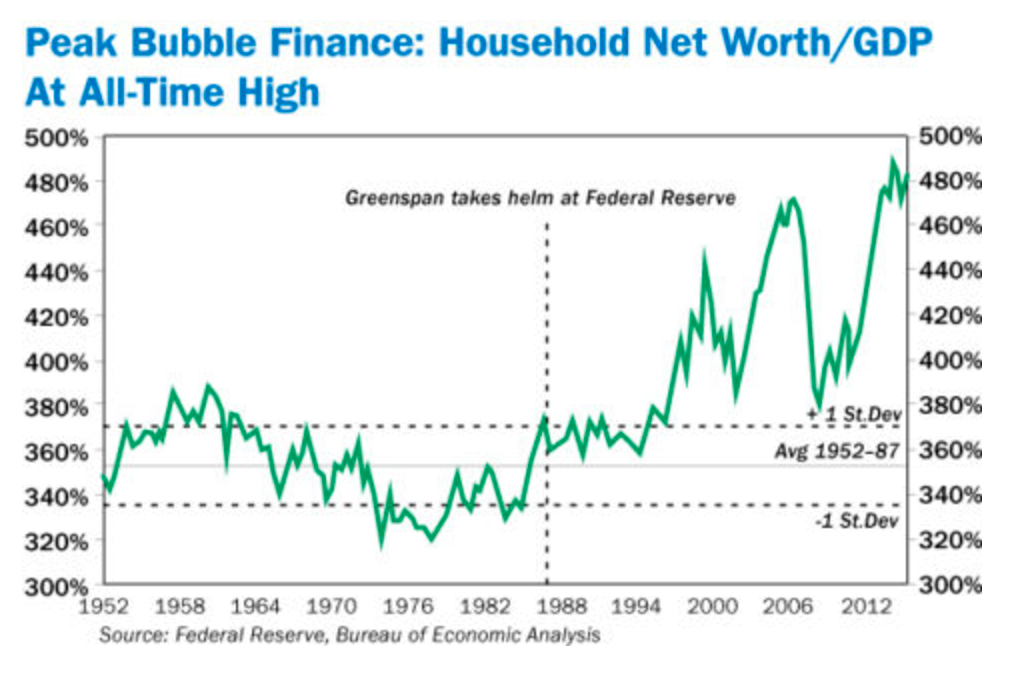
Household Net Worth is also at extreme levels based upon the present bubble like environment for all financial and real estate assets.
And although the FED’s actions since 2008 have led to another monetary bubble, this trend has been in place for a very long time frame, and in fact began when we abandoned the gold standard in 1971. The next chart shows this clearly.

The chart above shows the US National Debt, Money Supply and Consumer Price Index since the country was founded. Note that this schedule does not even show the debt added since 2010 which now brings the U.S. Federal Debt level to $20.0 Trillion. Also, notice how stable the growth was in these indices until President Nixon abandoned the Gold Standard in 1971.
The bottom line is that once a stable currency anchor (gold) was jettisoned the door opened up to monetary debasement and debt based inflation. In ever increasing measure this has become the policy of the world’s central banks.
As the chart below so clearly shows the World’s major central banks have been on a money printing binge since early 2000.
Worldwide Central Bank Balance Sheet Growth (aka money creation)
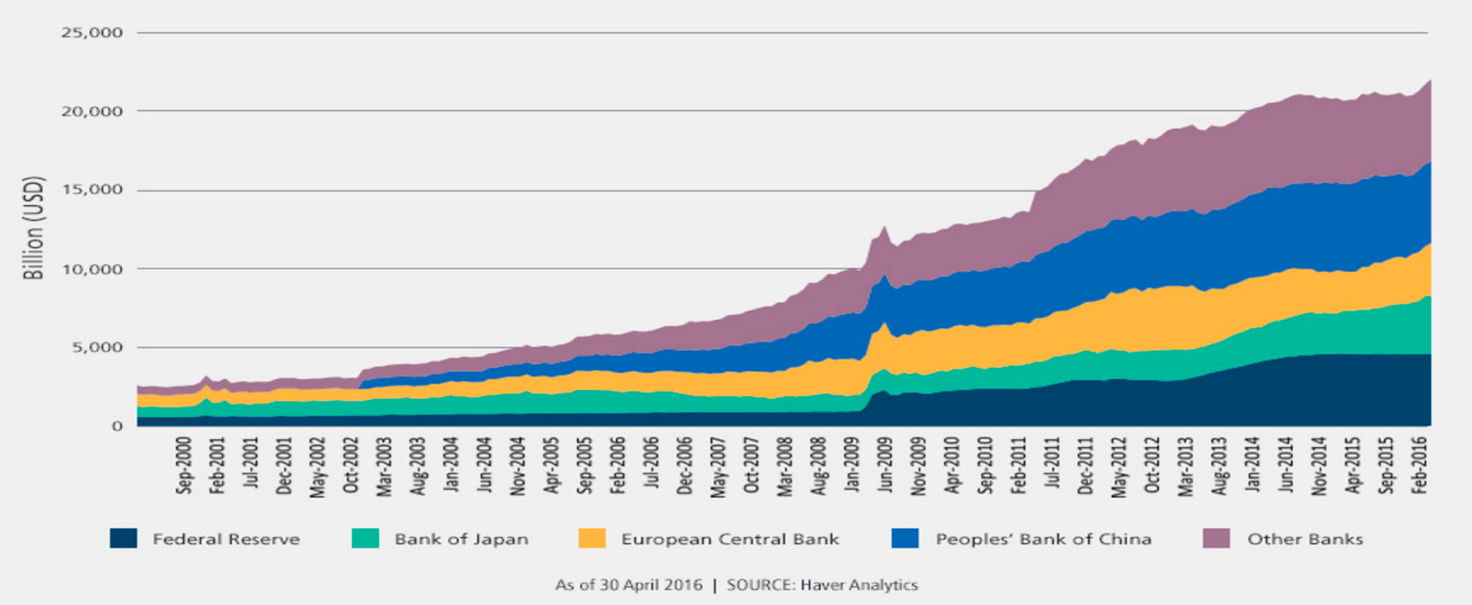
The amount of money created and injected into the world economy to keep the system functioning is staggering. From roughly $2.5 Trillion in 2000 the world wide monetary base grew to $21.5 Trillion in 2016. This represents compound annual growth of 14.4%. Now in theory this would imply annual inflation of 14.4%; however, it has not fully appeared in consumer prices because a large portion of the newly created money has flowed into the stock and bond markets to seek returns and yield.
This helps to account for the record overvaluation in the US stock market which is shown in the chart below:
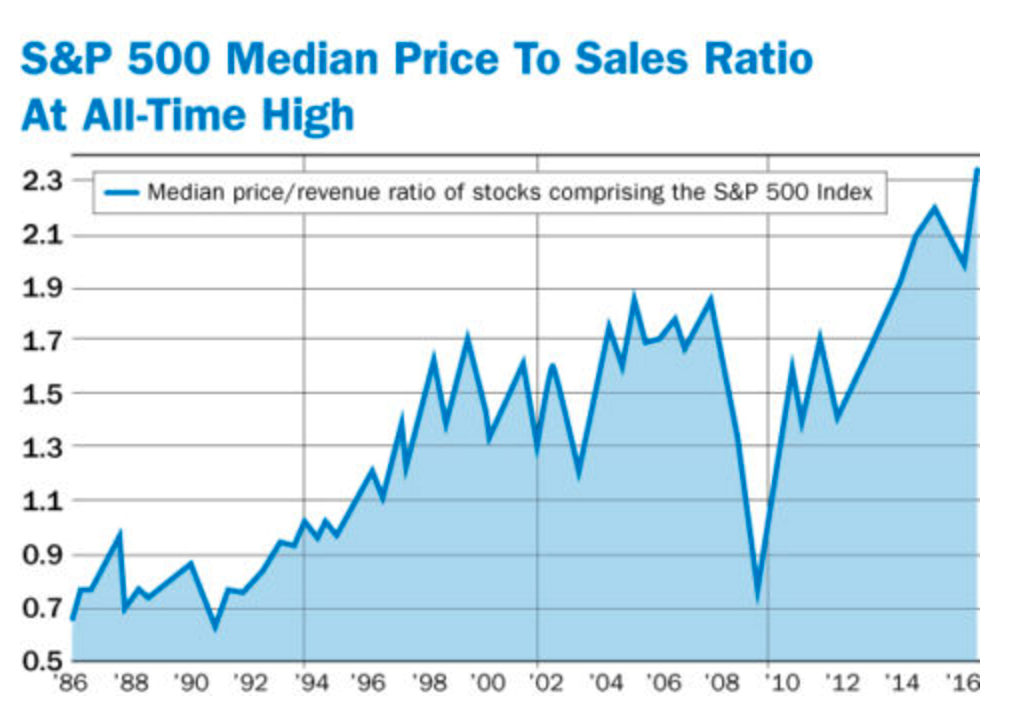
So, to summarize, Governments have created a lot of new money that is not backed by anything other than their promise to keep it valuable. The money supply growth has greatly exceeded the underlying growth in goods and services. Generally speaking, this would lead to inflation; but overcapacity, low money velocity and cheaper prices from China have kept consumer price inflation in check. It also helps that the Government inflation statistics are managed downward by the Government.
To hear Wall Street tell the story investing in gold is a bad investment. Certainly there are periods of time when this has been true. Gold is traditional money that cannot be diluted or printed. Nothing more, nothing less. It does poorly when government issued money is well managed and pays a fair rate of interest. It does much better when government issued money is being diluted and there is no real rate of interest on government money.
Recall from the charts above how the excessive money printing really began in 2000 when the Dotcom bubble burst and interest rates were cut. Note in the chart below how well gold has performed since the excessive money printing began in 2000. Starting in 2000 an investment in gold has crushed the performance of the stock and bond markets. Not surprisingly Wall Street and traditional investment advisors do not talk about this much.
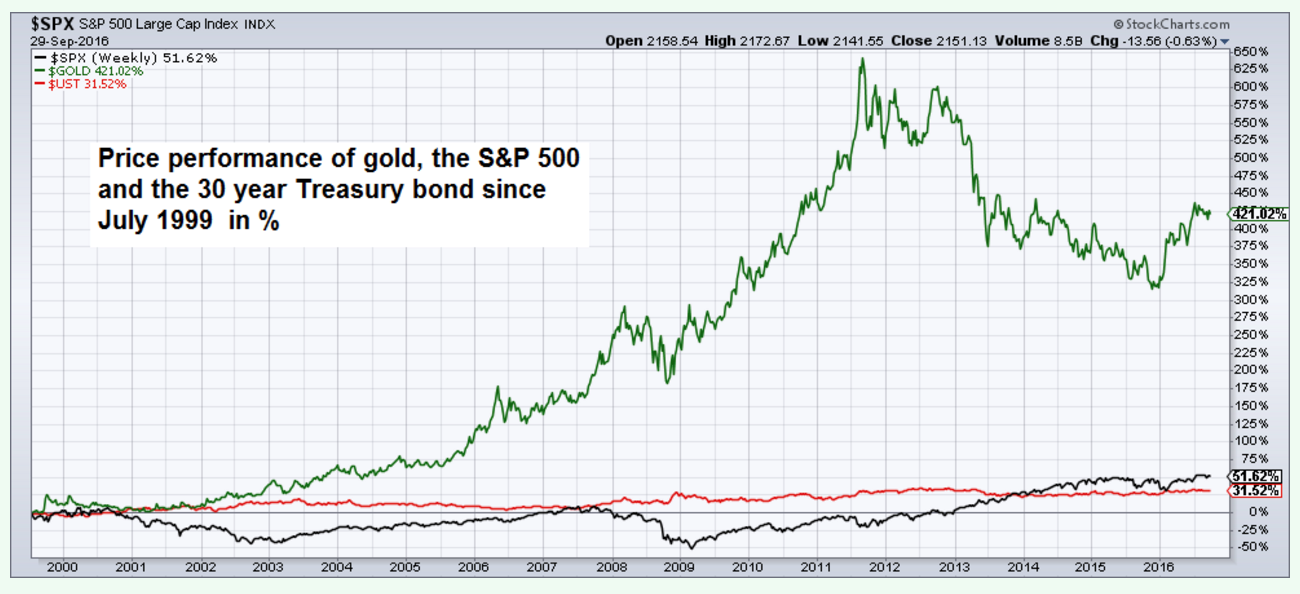
Looking at the chart above one might think that because gold has performed so well that it is overvalued. However, this would not be an accurate conclusion. Gold and the money supply are substitutes for one another. Cash or fiat currency is money. Gold is money. They both have value and they can be easily exchanged for one another nearly anywhere in the world at a published price. Of course that price fluctuates based upon preferences. When we were on a gold standard Pre-1971 it was a relatively straightforward calculation to take the world wide money supply and divide it by the world wide gold supply and arrive at a price for gold. In fact, this is what occurred after World War II at the Bretton Woods monetary conference where the world agreed to a Dollar based gold standard with a fixed gold price of $35 per ounce. This worked well for a time until Governments (particularly the US) figured out that they could deficit spend and dilute their currency. This action is what led to Nixon abandoning the gold standard.
Nevertheless, there is a calculation that was originally used to derive the gold price. It was world money supply divided by total ounces of gold known to be in existence (180,000 tons). The worldwide supply of gold grows slowly, typically at approximately 1.6% per year. Money supply has grown much more rapidly due to government excesses. If the calculation that was used to set up Bretton Woods was used today the derived price of gold would be $15,000 per ounce.
When compared to the money we have printed, and the monetary base, gold has never been cheaper as documented in the chart by Macrotrends presented below:
Gold to Monetary Base

Source: Macrotrends
So, on a relative basis gold is a financial asset which is extraordinarily cheap. In turn, stocks and bonds are financial assets which are extraordinarily expensive. At some point this situation will reverse itself. Because gold is so widely hated and under owned, it will not take much of a change in sentiment to send its price much higher.
The next schedule shows how small gold is as a percentage of global financial assets.
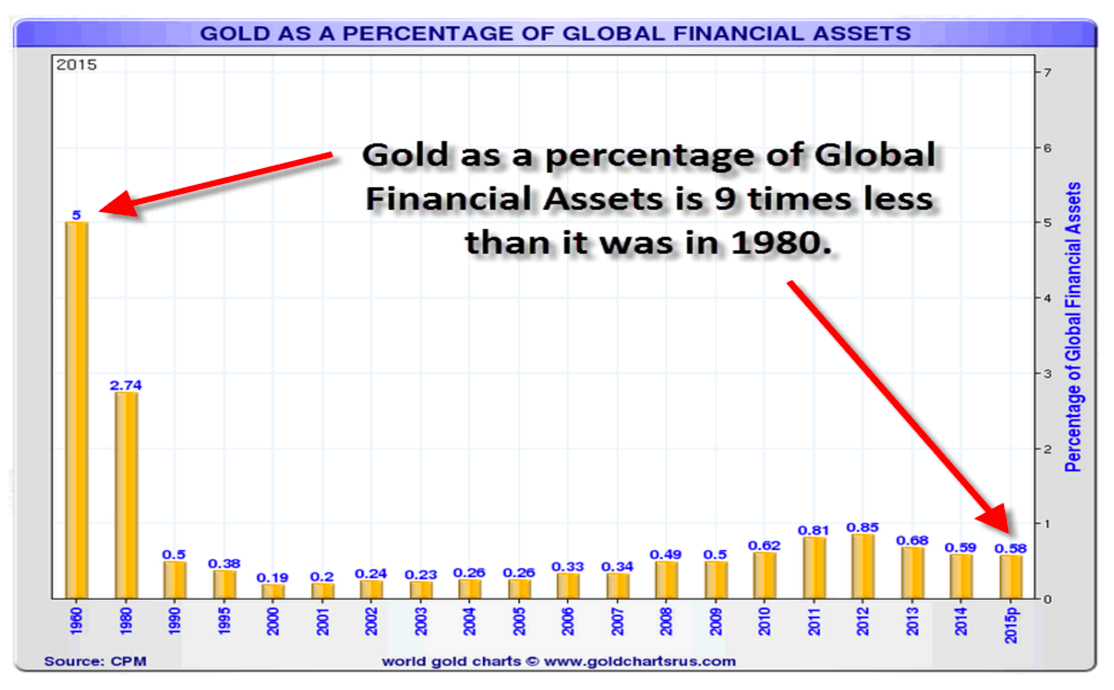
It would not take much of a shift in investor interest to send the gold price much higher.
Another way of looking at this is shown in the following schedule.
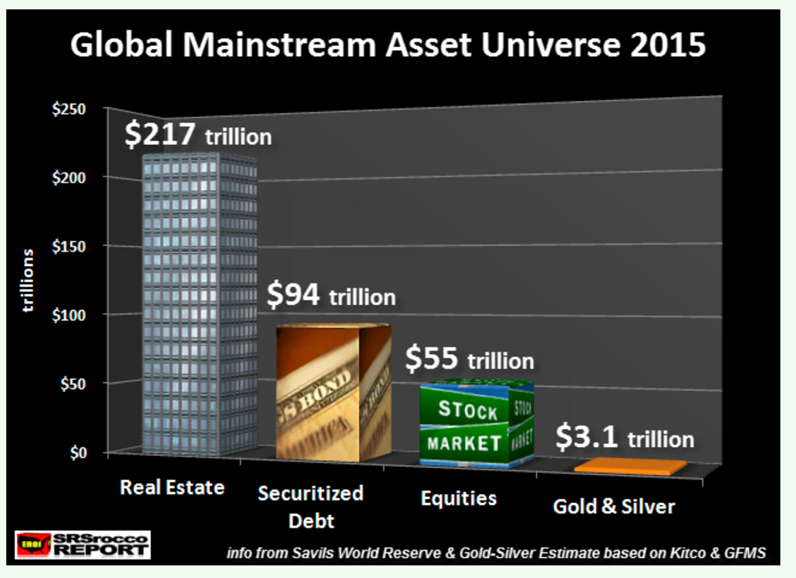
If even 5 or 10% of other asset classes shift to gold the gold price will soar.
The final objection I hear to investing in gold is that is has been in a bear market since 2011. This is true, although in 2016 a significant turnaround occurred. When the excessive money printing began in 2000 gold took notice and multiplied in value through 2011. In 2011 a correction began as the US stock market began to perform well and investors were attracted to stocks versus gold. Also, at this time the US FED implemented “Operation Twist” where they issued short term bonds to purchase long term bonds and drive the long term interest rate to record lows. These low interest rates implied low inflation and investors lost their interest in the gold inflation hedge.
Both of these factors led to a multi-year correction in what had been a very strong bull market for gold and gold equities. Some think that 2011 was the end of the gold bull market, but this does not make sense for several reasons. First, the gold market never got overheated and crazy. Most bull markets end with a blow off tops. That did not occur in gold in 2011. Second, the underlying conditions that had driven the gold bull market have not changed. Money printing has accelerated and debt growth has also accelerated. There has been no adjustment to the excessive valuations of paper assets versus real assets. Until this occurs gold will be undervalued.
So, my strongly held belief is that 2016 was the end of mid-bull correction in gold. During 2016 the price of gold appreciated by 16%, the largest gold mining stock ETF, GDX, appreciated by 52.3% and the fund I manage appreciated by 75.0%.
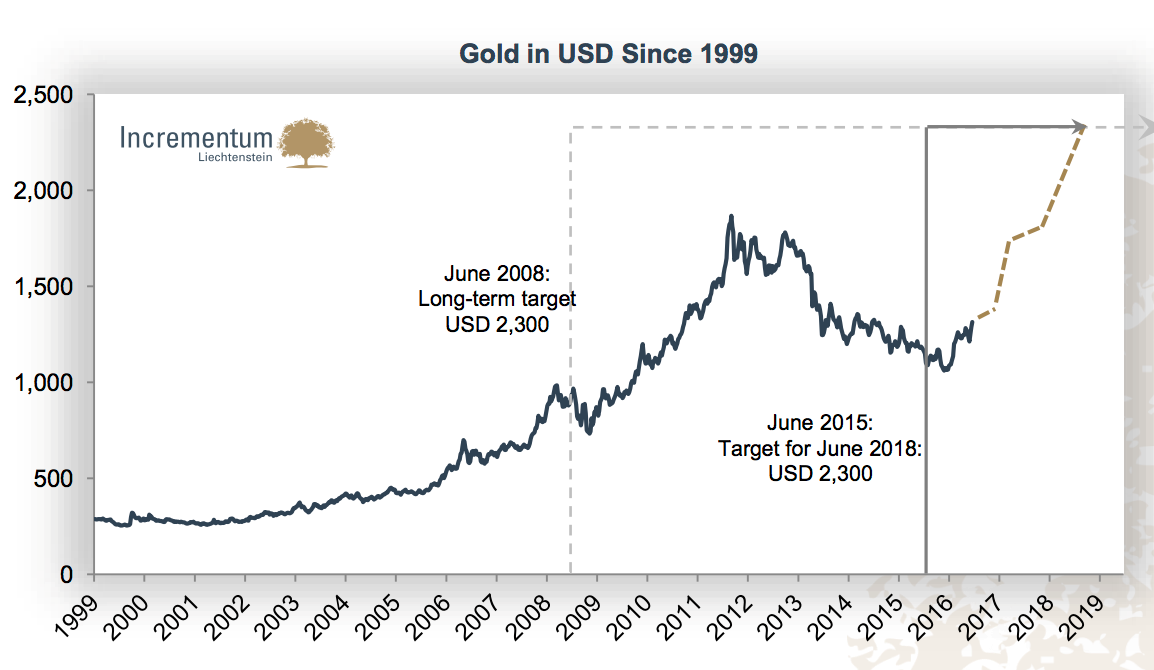
If I am correct in my assessment, that the bull market in gold has entered its next leg higher, then the following schedules show what might happen:
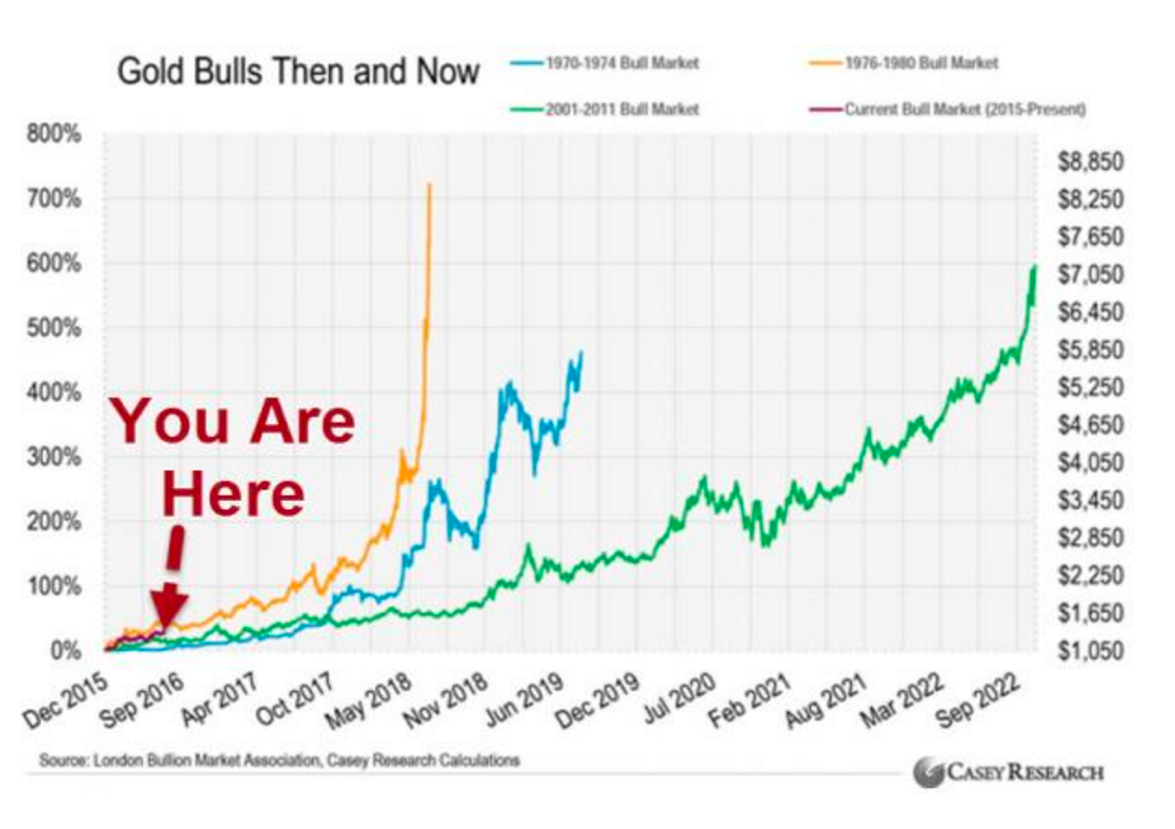
The first schedule shows the price of gold if it follows the performance of previous bull markets.
The second schedule shows the gold share price performance in prior bull markets.
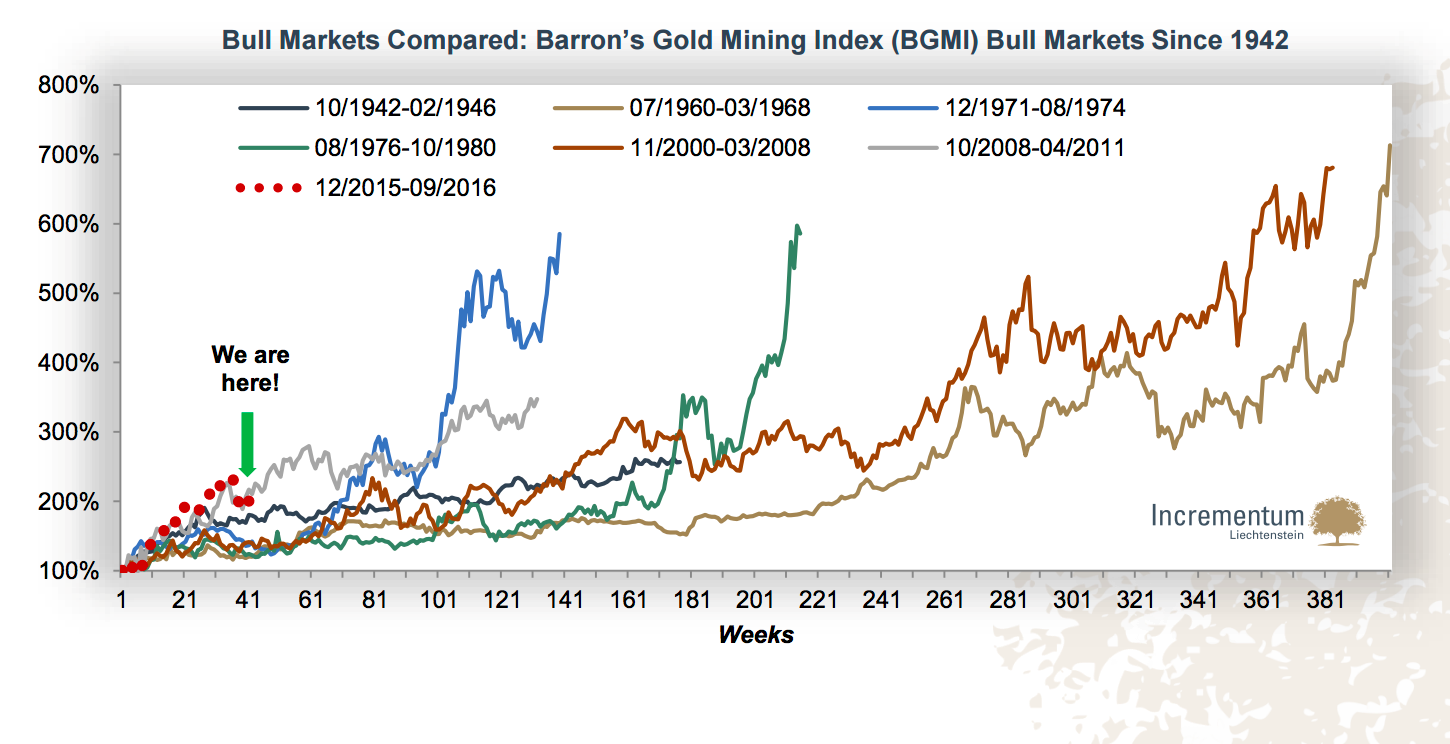
Looking at the second schedule of gold mining stock share performance, note that these bull markets took between 2.5 and 8 years to mature. The worst performing bull appreciated by 250% and the best appreciated by 700%. The average duration was 238 months or 4.6 years. The average appreciation was 524%. So, we are currently 17 months (1.4 years) into this bull market and the major indices are up 50-65%. I believe that the conditions in this bull market make it possible that it will outperform all of the above examples; however, even if it does not there is a lot of upside for investors who are well positioned now.
Conclusion
There is very little value or upside left in the US stock market. The bull market which started in early 2009 is very old. Valuations are stretched and it has all occurred as a result of the government’s policy of printing money and flooding the system with zero percent interest rate money and excess liquidity. The upside in the US stock market is small and the downside is meaningful. John Hussman, estimates that a normal adjustment of values would take the stock market down between 50 and 60%.
In a similar fashion gold is just the opposite. Gold has never been cheaper when compared to the supply of paper money. Gold miners are extraordinarily cheap in today’s environment. The mid-cycle gold bear market which took place from 2011-2015 has beaten the gold mining shares down to the low end of their historical ranges. The upside in the gold mining shares is many multiples of their current price.
As I turn 60 years old next month, I reflect that I have never seen such an asymmetric investment set up. I have been a professional investor for my entire career and I have never been more excited about what is about to happen.
If for no other reason than diversification all investors who hold equities should have an allocation to gold. Gold represents monetary insurance and in a world that has gone crazy with printed money it will do its job of preserving purchasing power when the irrational belief in government managed money comes crashing down as is surely will in the next few years.
********
Lawrence Lepard, Equity Management Associates, LLC


