The Coming Debacle Will Be Magnified By Derivatives Causing Banks To Fail


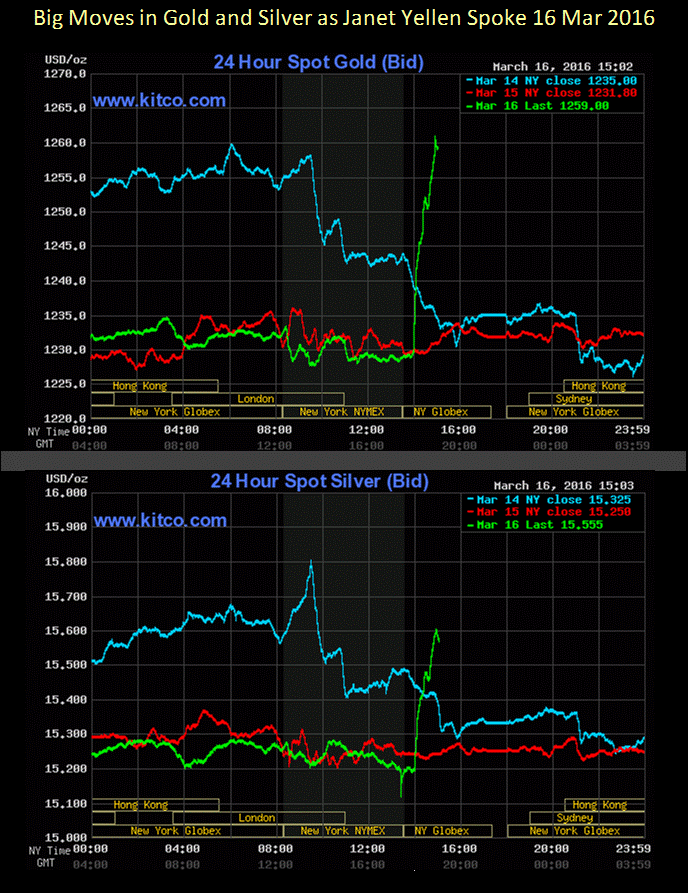
Gold and silver markets showed serious disrespect to Fed Chair Janet Yellen while she was speaking on “monetary policy” Wednesday on CNBC. I couldn’t say exactly what happened, but I liked it.
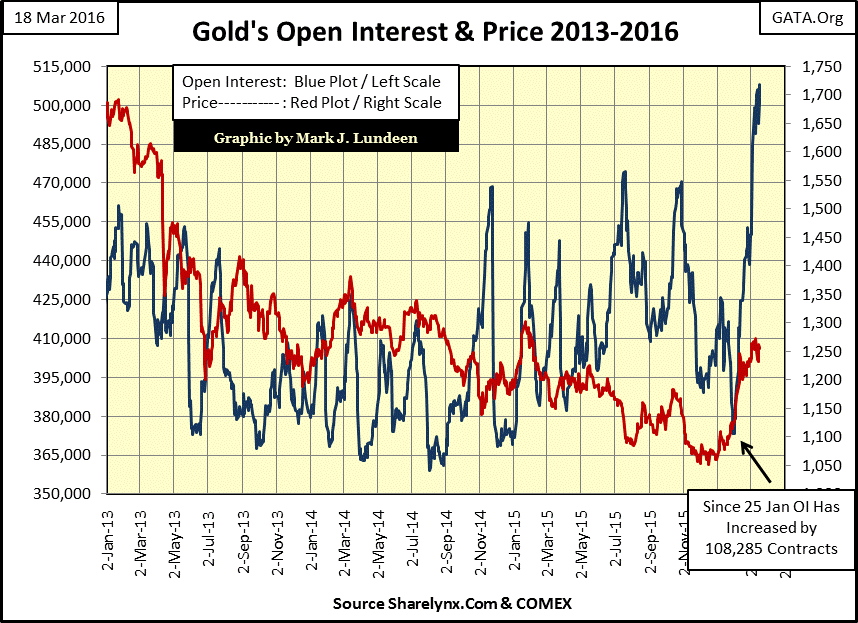
This was particularly impressive as the usual suspects have been continually flooding the market with promises to deliver gold they neither have nor could possibly obtain. As seen below, since January 25th they’ve been flooding the COMEX with an additional 108,285 gold contracts (Blue Plot). Each contract promises to deliver 100 ounces of gold, so actually we are seeing the supply of fictional gold increase by 10,825,500 ounces. Seeing an actual rise in the price of gold under the onslaught of this massive fictitious supply increase (Red Plot) is remarkable.
Gold and its step sum are still behaving bullishly. Seeing gold’s step sum (Red Plot below) beginning to turn down as its price (Blue Plot) holds firm is a very positive sign. Remember, the step sum is just market sentiment, while the price action is market reality. A little fear of rising prices after the past four and a half years of blatant market manipulation is only to be expected.

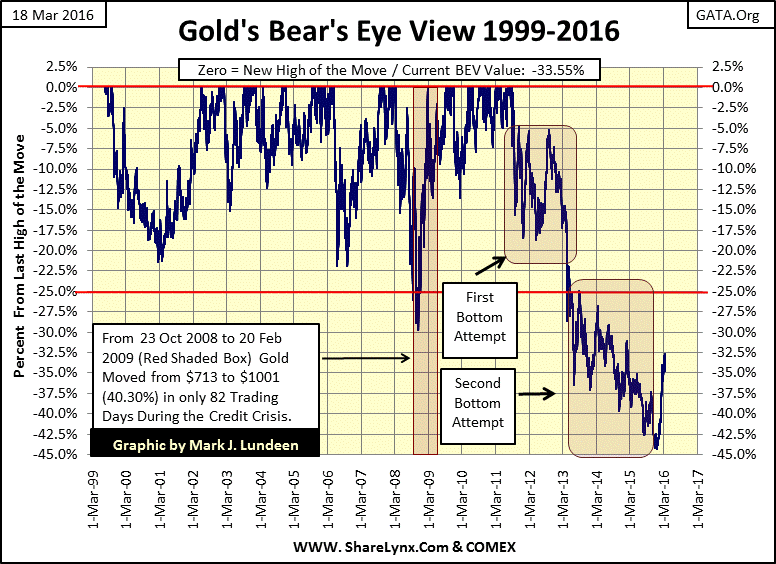
I really like gold’s Bear’s Eye View (BEV) chart below showing its 1999-2016 bull market – and yes gold is still in a bull market. It highlights the gargantuan effort by the “policy makers” to contain the price of gold since August 2011. However since its December 2nd low (BEV -44.24% / $1,053), it’s recouped $209 as of Wednesday (11 BEV points). It goes without saying that for the bulls this means little if this doesn’t continue.
But the main policy tool used in suppressing the price of gold and silver is the banking system. The hand these banks are playing is clearly a bluff on being bearish on the price of gold and silver. This is made clear by the banks’ deteriorating financial positions over the past few decades. How many times has the US Government bailed them out since 1987? Three by my count with a fourth pending. The big banks are insanely leveraged in positions that will one day prove to be foolish speculation. I can’t say exactly when gold will take off but one day it will and you’ll be glad to be holding some (as well as silver) when it does.
That said, so far the recent advance in gold looks really impressive, and should it correct back to its BEV -37.5% line ($1,180) after the gain we’ve seen below, it wouldn’t be a cause of concern. Personally I’d hate to see that happen, but just look at the BEV plot from 1999 to present. Over the past seventeen years when has the price of gold ever gone up so far and fast as it has since early December without a correction? If the price of gold continues advancing as it has for the past three months, it may be an indication of a volcanic price event building. However it’s still too early to be predicting that. We’d first need a rumor of a momentous event, something like a major Wall Street house to fail or being bailed out before I’d begin to think along those lines.
The Dow Jones is doing better than I was expecting. It’s approaching its last all-time high of last May without much of a pause.

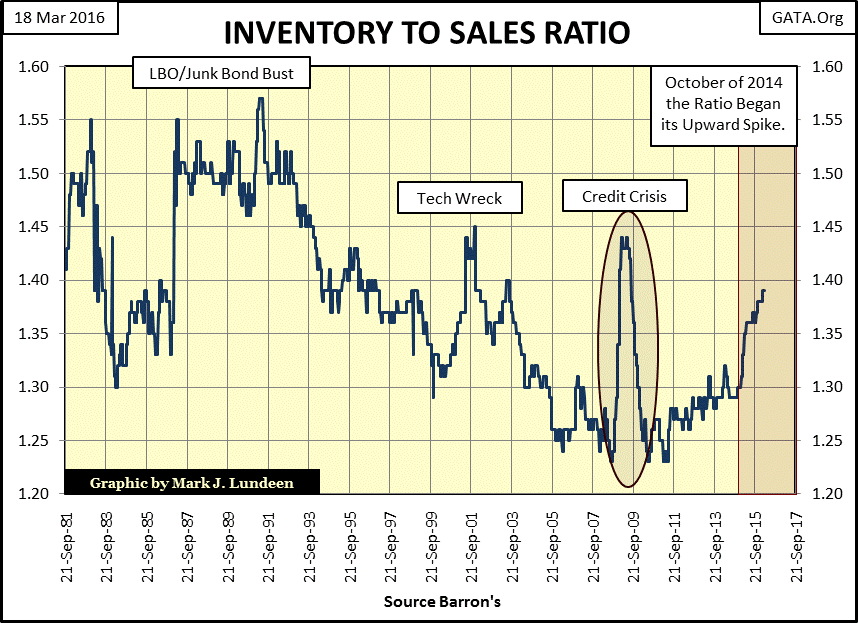
However I still have to wonder exactly why the Dow Jones is rising so briskly. Looking at the rising Inventory to Sales Ratio below, there is good reason to expect a market downturn in the not too distant future. And since 1986 each time the ratio has risen the banking system found itself in need of help from their friends in Washington.
Looking at the Dow Jones’ BEV chart below we see it broke above its BEV -5% line this week and is now approaching its -2.50% line. Last time it broke above the -2.5% line was this past November and the bears used that as an opportunity to sell into market strength. The one thing to keep in mind is that since its lows of February 11th the Dow Jones has advanced 1,942 points for a gain of 12.42% in only twenty-six trading days.
This market action is unlikely to be repeated again over the next twenty-six trading days, so at this point both bulls and bears are now expecting a market correction. The difference is that the bulls are expecting to see the Dow Jones resume its advance to new all-time highs after the correction, while the bears are expecting the correction to result in a decline deeper than its February 11th low. It’s hard to predict what will happen (with the massive manipulation we’ve come to expect over the past few years) but if forced to guess I would have to side with the bears.

Since their 13 Dec 1937 issue Barron’s had published market averages for basic stock groups; the Barron’s Stock Averages (BSA). Over the following fifty years the BSA has changed along with the markets. For example I’ve included the Television Average in the list below, but actually the television average only began to be included in Barron’s 04 April 1949 issue. By the time Barron’s discontinued this data series in October 1988 there were few, if any television manufacturers trading on the NYSE. This is to be expected as financial markets evolve with the economy. When Barron’s first began publishing the Dow Jones Total Market Groups (DJTMG) (the week after their 17 Oct 1988 issue) it had two separate categories for computers; one including and one without IBM. Today the DJTMG doesn’t list computers at all, but publishes a separate digital equipment index.

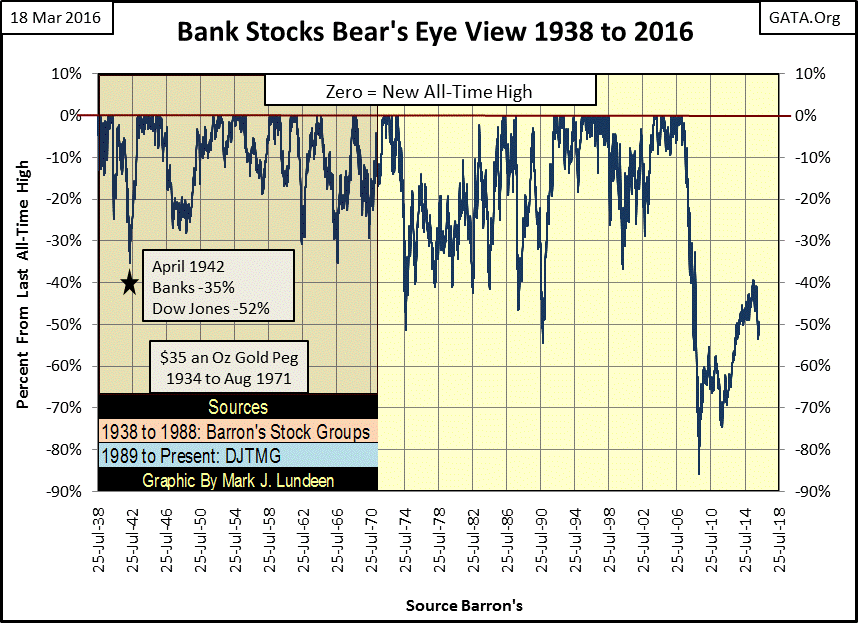
With the sole exception of the gold mining average (relabeled the Barron’s Gold Mining Index: BGMI) the BSA was discontinued. I don’t blame Barron’s; the economy as described by the stock market had been altered beyond recognition over the fifty years spanning 1938 to 1988. Back in 1938 high tech consisted of Radio Corporation of America (RCA) and rail-road equipment (steam locomotives) was still a widely held stock sector. Neither was true by October 1988, but its bank stock average can still be useful when stitched together with the data from the DJTMG, which I’ve plotted below.
From 1938 through 1978 (chart insert) banking stocks were anything but glamorous. Great Depression era banking legislation (Glass Steagall) saw to that. Banks were for taking deposits and making short term commercial loans. Banking wasn’t sexy, but it was profitable for all concerned. All that changed after the US dollar was “liberated” from its Bretton Wood’s $35 gold peg in 1971, and after the repeal of Glass Steagall during the Clinton Administration.

But long before 1971 the $35 gold peg had already become a joke. By the time Professor W.H. Hutt said the following, the US Treasury had already issued more than 100 paper dollars for each ounce of monetary gold it held in reserves.
“How can businessmen coordinate the private sector of the economy effectively when the most important measuring-rod of all; the monetary unit has been left with no reliable defined value? Units of length, volume, and weight have been universally defined with meticulous care; but dollars, lire, francs and pounds have been allowed to change in every significant attribute over time. --- The technique of inflation demands that governments and their agencies shall continuously deceive the public about the fact, the speed and the duration of inflation intended. Ministers of finance have no option but to employ what has been called ‘the necessary untruth.”
- Professor W.H. Hutt: New Individualist Review, 1966 Winter Issue
Note how back in 1966 it was widely accepted that the private sector was controlled by businessmen, not by academics at the Federal Reserve. However in the past fifty years these same academics at the Federal Reserve have now inflated the money supply by printing 5,400 paper dollars for each ounce of monetary gold held by the US Treasury (unverified since 1953), greatly diminishing the role of businessmen and wage earners in the economic life of America.
Before the 1970s future contracts were primarily used for hedging risks associated with agriculture. However even before the dollar was depegged from gold, monetary inflation was already creating instabilities in interest rates and bond yields, currencies and share prices, causing chaos in financial markets. In response to the instabilities created by inflationary money printing, futures exchanges were only too happy to offer future contracts (derivatives) on financial assets, interest rates and currencies to assist commerce in hedging risks introduced by the FOMC’s inflationary monetary policy. It’s painfully apparent that the worse academics and bankers became at managing “monetary policy”, the more opportunity was created for big banks to generate revenue thereby increasing their annual bonuses.
Then Wall Street invented the Mother-of-All- Derivatives: interest rate swaps and credit default swaps. Barron’s 19 August 1985 issue headlined interest rate swaps: the $150 Billion Baby. In truth they were a bit puzzled by them. Little did they suspect that twenty two years later these swaps and other types of derivatives would become ground zero in a market crash which began with sub-prime mortgages. Currently the Bank of International Settlements (BIS) is reporting the notional value of all interest rate swaps at 320 TRILLION DOLLARS, an increase by three orders of magnitude, plus a double since 1985.

The sub-prime mortgage debacle showed what these credit default swaps actually were, a fraudulent insurance scheme in which the underwriters accepted fees and premium payments, but failed to maintain the reserves necessary to honor their counterparty obligations. As it turned out the United States government, at the behest of Treasury Secretary Paulson and Federal Reserve Chairman Bernanke made good on these payments, costing taxpayers many trillions of dollars. People should have gone to prison for fraud. Instead Wall Street was able to pay out the expected end of year bonuses. Looking back at the banking chart above, it’s obvious that since 2007 the game has changed.
From Barron’s 1985 issue above through January 2007, banking stock index steadily increased from about 300 to more than 2,750, fueled largely with revenues generated bundling derivatives with financial assets for the purpose of “hedging risks” that for the most part didn’t even exist prior to August 1971. From the January 2007 peak, the banking stock index crashed all the way down to 399.83, not far above where it had been in 1985. Since then banking stocks have recovered about half of their credit crisis losses, but have begun to decline again since last June.
Here’s a Bear’s Eye View chart of the banking average. I highlighted the span of time when gold was pegged at $35 an ounce (1938-71), a period when the banking stock average never declined more than 35% from a previous all-time high on market downturns. Back in April 1942 the banks were down only 35% during a 52% Dow decline - that’s a big difference. After 1971 the banking stocks began to experience even larger declines than the Dow Jones during times of market distress. Without a doubt, decoupling the dollar from gold and the Clinton era banking deregulation has greatly destabilized the banking system.
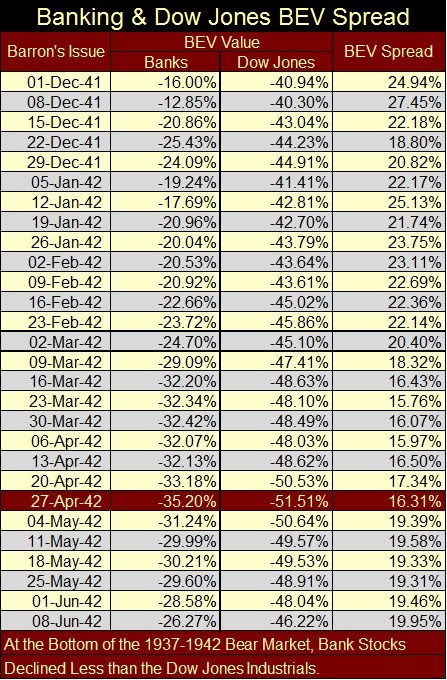
Below I’ve taken a spread of the BEV data from the Banking Average and the Dow Jones from the attack on Pearl Harbor through the bottom of the 1937-42 bear market. The positive spread in the table illustrates the superior performance of the banking stock average during this bear market, when the banks declined just 35% from their last all-time high compared to the Dow Jones 52% decline.
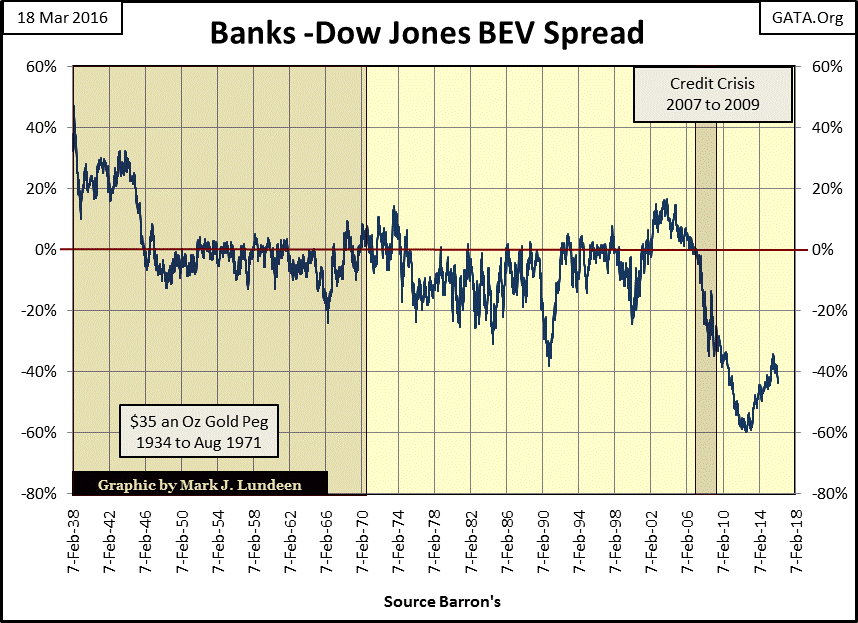
The following chart plots the BEV spread above from 1938 to present. Keep in mind this plot is constructed from BEV data; each new all-time high is equal to 0.00%, and never more. This means that the plot is only a comparison of declines banking stocks endured relative to the Dow Jones. Positive values indicate banking stocks have declined less than the Dow Jones from their respective all-time high, negative values that banking stocks have declined more, and when the plot rests on the red 0.00% line, the banks and Dow Jones are equidistant (whatever that may be) from their last all-time high.
The plot illustrates how banking shares have become more volatile relative to the general market (as defined by the Dow Jones) since the end of the Second World War. This is easily explained. During the Great Depression new legislation (Glass Steagall) and memories of the recent 1929-32 crash had put the Fear-of-God into bankers. They were content just making profits with their traditional functions of recycling dollars flowing between consumers and producers, employers and wage earners, accepting deposits from savers and making loans to viable businesses.
However, after World War Two, inflationary monetary policy and banking deregulation made recycling monetary inflation into the financial markets (creating bull markets) and marketing derivatives by the hundreds of trillions to “hedge” the downside risks in these “bull markets” became Wall Street’s main line of business. Seeing the BEV spread crash to historic lows during and after the credit crisis is an indication of just how profound the current problems in banking must be.
That this metamorphosis in the banking industry was made under the supervision of Washington’s political class and their market regulators best explains the establishment’s current deranged reaction to the prospect of either Senator Ted Cruz or Donald Trump becoming the next President. They must fear the consequences of one of these strong-willed outsiders appointing officials loyal to themselves, (and not to the current clique now in control of Washington’s financial and criminal investigating apparatus) to key positions in the Federal bureaucracy. Small wonder a number of supposedly “conservative” Republicans have publically professed a preference for Hillary Clinton as our next president rather than Donald Trump.
All in all, there is far more reason to be bullish on gold and silver than on financial markets. This summer and autumn should prove to be interesting.
More from Gold-Eagle


