The Dow Jones Dividends And Mr. Bear


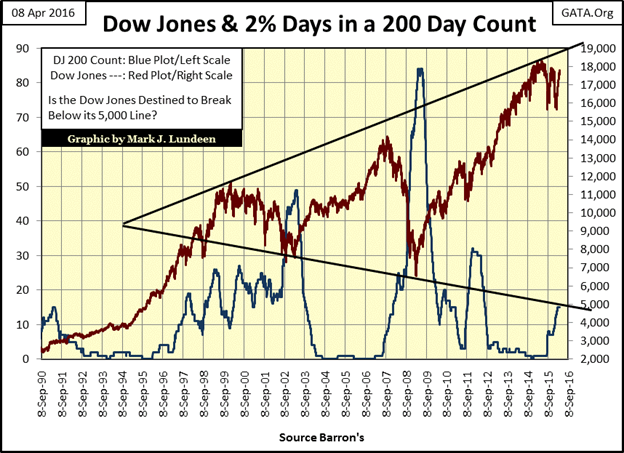
Nothing significant happened last week on Wall Street. The Dow Jones chart below looks identical to the one I could have published last week. And as we haven’t seen any days of extreme market volatility since March 1st , the Dow Jones’ 200 count (Blue Plot below) has remained at 15 for over a month. Come early June the 2% days of last August will start expiring and take the 200 countdown if we don’t see some volatility by then. That doesn’t make me any less bearish, simply because the market is dangerously overpriced and has been for decades.
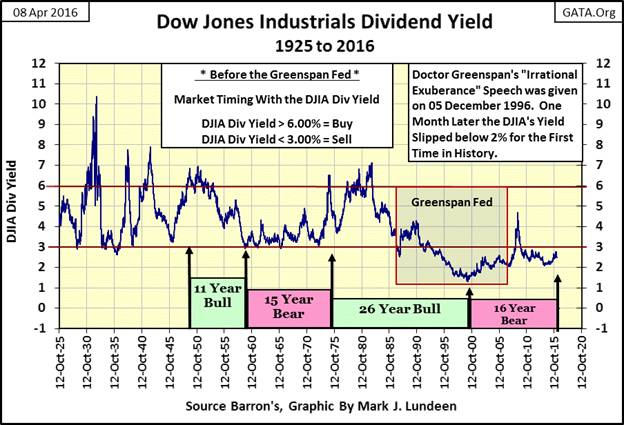
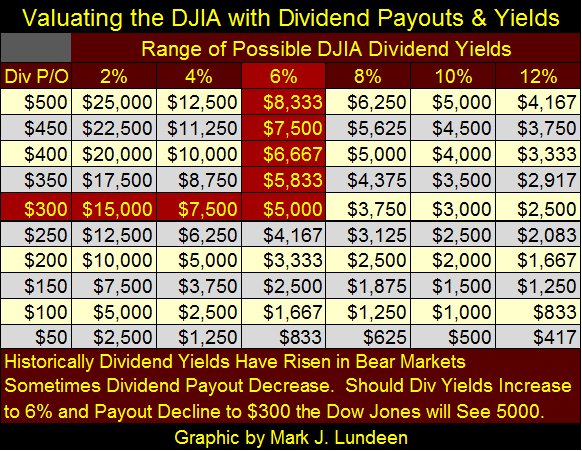
As shown by the two black trend lines on the chart resting on the market highs and lows of the past sixteen years, seeing the Dow Jones break down to 5000, a 72% decline from its recent all-time highs of last May is far from impossible. And the case for a 5000 Dow is bolstered below in my study of the Dow Jones’ and its ninety-year history of dividends. A simple reduction of 30% in the Dow’s dividend payout together with a 6% yield would take the Dow Jones to 5000.
Considering the state of the global economy as a whole, with its insolvent, yet “too big to fail” banking system and bloated government, corporate and individual balance sheets, forecasting a Dow Jones decline of just 72% may be looking at the world through rose-colored glasses. With the Dow Jones closing the week just 4% away from its last all-time high of last May, the bulls appear to still be winning. But why haven’t they yet taken the Dow Jones above its last all-time highs of last May?
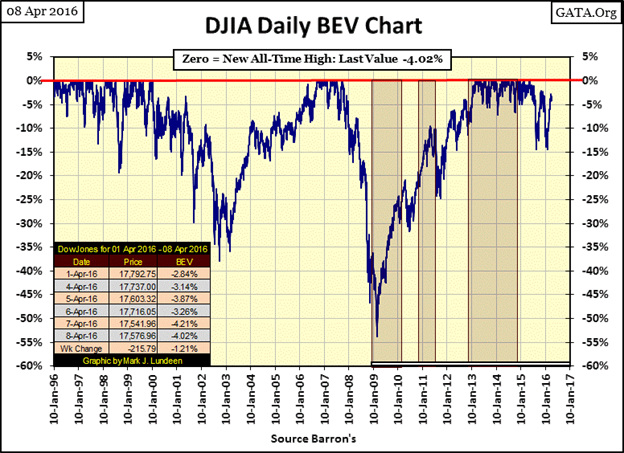
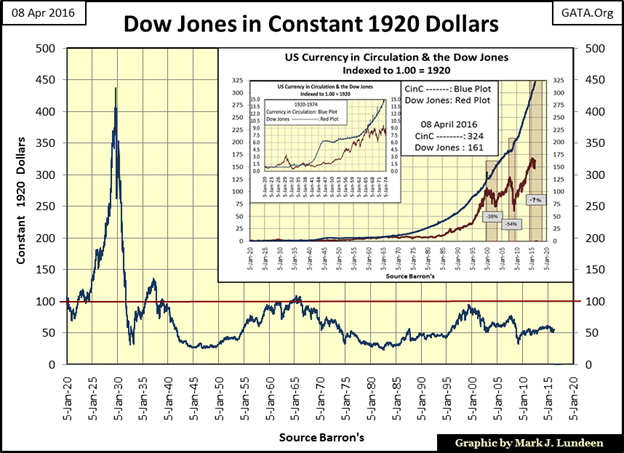
Next is the Bear’s Eye View (BEV) chart for the Dow Jones going back twenty years. Here’s an interesting fact: the high-tech bear market took thirty-four months (January 2000 to October 2002) to decline 38%. The credit crisis bear market took only seventeen months (October 2007-March 2009) half the time to take the Dow Jones down 54%. If it wasn’t for the Fed’s initial QE (marked on the chart with a red box), the credit crisis bear would have been much deeper and more prolonged.
I have to wonder how the next bear market will play out. If the bulls can’t get the Dow Jones to break above its BEV Zero (last all-time high) of last May it would mean the bear market is now ten months old and behaving like the high-tech bear, taking its time to deflate the market. However, there are many massive problems that need to be resolved before we can consider the bear market to be over. And these problems all have a common connection: the debt burden of governments, corporations and individuals have expanded far beyond what the prudent banking practices of decades past would have allowed.
Should the economy turn down and tax receipts, corporate earnings and personal income contract, massive counter party failure is guaranteed to incite panic in the market and possibly take the Dow Jones back below 1000 for the first time since 1982. Impossible? Not when we learn how Mr. Bear prices the Dow Jones using dividends (below).
Former Fed Governor Kevin Warsh said the following at Stanford University’s Institute for Economic Policy Research in January 2012:
“Central banks are now so heavily influencing asset prices that investors are unable to ascertain market values.”
- Kevin M. Warsh: Former Federal Reserve Governor. Comments made to the Stanford University Institute for Economic Policy Research, 25 Jan 2012
But what does that mean, and if so what are the consequences? To best answer those questions we have to go back in history to examine the relationship between asset prices and yields using the Dow Jones dividends and Barron’s Best Grade bond yields.
In the old days, when stocks and bonds were primarily seen as income generating investments, not so much the short-term trading vehicles for capital gains they are today, blue-chip dividend yields were higher than best-grade bond yields for the simple reason income from dividend payouts were riskier than income from bond coupons. Dividend payouts were the means with which a corporation shared its profits with its owners – the shareholders. No profits, no dividend income. Companies could and did cut or eliminate dividend payouts without legal consequences. Bonds, on the other hand, are contracts for debt. Failure to pay a coupon on time is the legal definition of bankruptcy, so a company in financial difficulty would commonly divert funds intended for dividend payouts to service their bond obligations when necessary, like during a bear market.
In the chart below we can see how dividend yields were typically higher than bond yields from 1934 through 1958. Many decades ago investors could use yields to gauge whether the market was cheap or overpriced. When dividend income from higher risk Dow Jones yielded little more than could be obtained from best-grade bonds, the stock market was near the top of a bull market. The prudent thing to do was to sell blue-chip stocks and purchase best-grade bonds to secure a safer source of income. Taking this step also insured that the investor would avoid the pending bear market when the market would once again drive stock values down, thus driving dividend yields back above best grade bond yields.
For decades, this system worked beautifully and was summarized in a market rule-of-thumb that one should exit the stock market when the Dow Jones’ dividend yield nears 3%, and return when its yield had increased to something over 6%. In the chart below following this rule-of-thumb would have enabled investors to have avoided the 1937-42 & 1946-50 market declines (rising dividend yields), while keeping them in the stock market during the market advances seen in WW2 and from 1950 to the late 1950s (declining dividend yield).
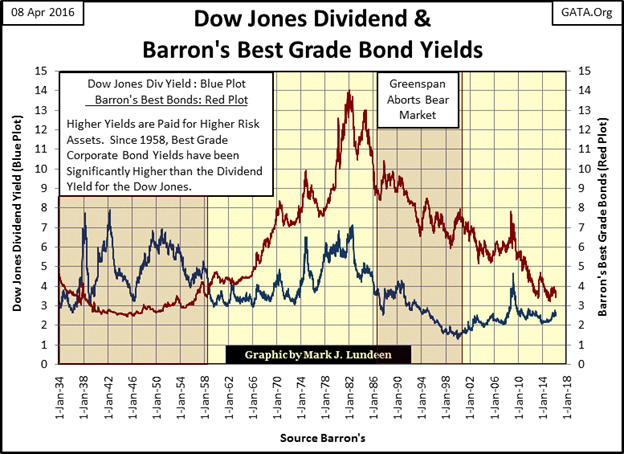
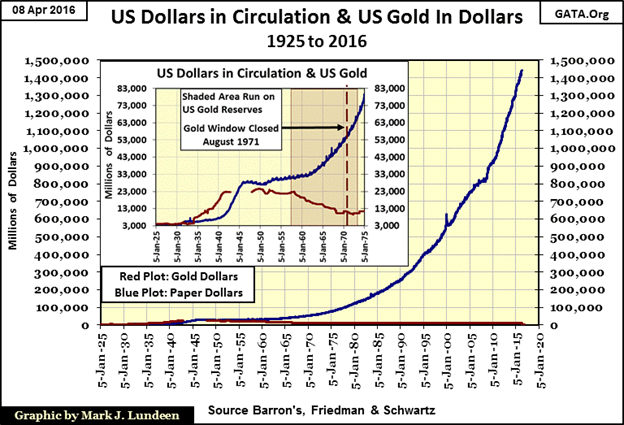
All that changed in 1958, when bond yields rose above the Dow’s dividend yield and have stayed there to this day. It’s easy to understand why; the US Treasury was ignoring the Bretton Wood’s $35 gold peg by issuing paper dollars in excess of what could be backed by the gold reserves held by the US Treasury. In 1958, a run on the US gold reserves began that continued until “Nixon Closed the Gold Window” in 1971 (chart below). In response to the US Treasury’s reckless “monetary policy” of perpetual monetary inflation, the bond market drove bond yields above blue-chip dividend yields as monetary inflation made bonds, with their fixed income, a riskier investment than stocks. Today, with bonds at the end of a four-decade bull market, and the Federal Reserve now actively seeking price inflation in the economy, this has never been truer.
People who actually understand the grotesque levels of monetary inflation inflicted on the dollar since the end of World War Two, as seen in the chart below, fear bonds with their fixed income but love gold, silver and their miners for their potential to appreciate in the years to come.
Since the Great Depression, the stock markets’ redeeming virtue has been its ability to increase its dividend payout over time as evident in the chart below. Since 1925, the Dow Jones has increased its dividend payout from $6.45 to $443, a factor of 68.66.
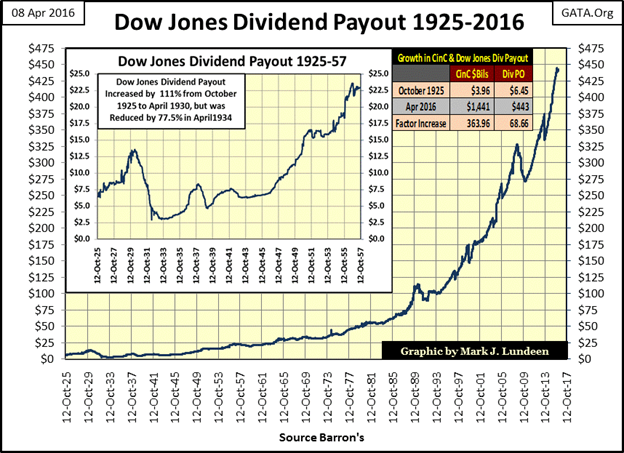
Unfortunately, since 1920 the “policy makers” have increased Currency in Circulation (CinC: paper money circulating in the economy / Blue Plot chart insert below) by a factor of 324 making the gains enjoyed by the Dow Jones over the past century a lot less impressive when compared to its deflated values in the chart below. Valuing the Dow Jones in constant 1920 dollars, the Dow Jones ended the week 50% below where it was in January 1920.
However, the Dow Jones, or blue-chip stocks, in general, don’t have to increase their dividend payouts. In fact, dividend payouts can go down faster than they went up as happened during the Great Depression (chart’s insert above). In the last half of the Roaring 1920s the Dow Jones increased its payout by over 100%, but in the first few years of the depressing 1930s cut its payout by 78%. It was this collapse in dividend payout, coupled with dividend yields rising to double digits that made the early 1930s’ stock market so depressing.
There are actually two methods of valuing the stock market, the one the bulls use is based on emotions; their expectations of future capital gains. Watching CNBC a few hours will demonstrate the technique. Bulls don’t give a sweet rat’s petutti about single digit dividend yields. Dividend income just makes them fill out another line on their IRS Form 1040. What bulls actually want is double digit capital gains, and during bull markets – the bulls are absolutely right!
But Mr. Bear values the stock market mathematically; using the dividend pricing model. For the Dow Jones it goes as follows:
Dow Jones Payout / Dividend Yield = Price of Dow Jones
Even during bull markets the dividend pricing model is in effect, it’s just that the bulls ignore it as they did at the Roaring 1920s top in September 1929 when the Dow’s dividend yield declined to 3.31%. The values seen in the table below are those published in contemporary issues of Barron’s.
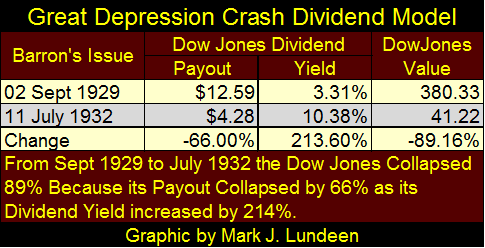
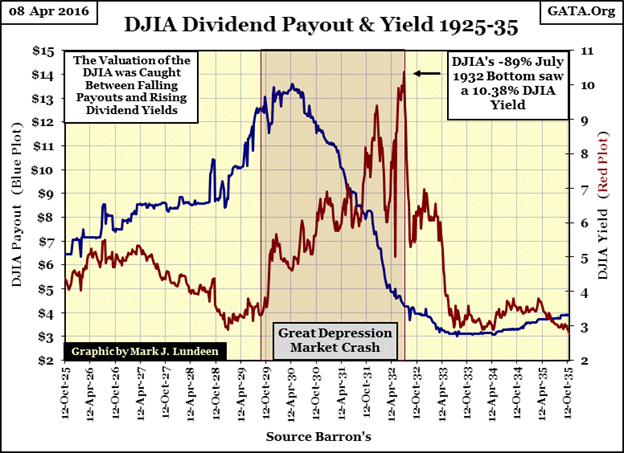
Below is a chart of the Great Depression’s crash as viewed by the Dow Jones dividend payouts and yields. One often repeated canard cited by “market experts” is that rising yields make financial assets more attractive. If the rising yield occurs in the context of a correction in a bull market I agree. But rising yields as seen in bond yields from 1950 to 1981 above, or from 1929 to 1932 when Dow Jones dividend yields increased from 3.3% to double digits below, are only seen during bear markets as capital flees financial assets. Currently with yields for stocks and best grade bonds near or actually below levels several decades ago, the potential for financial ruin in the financial markets seems overwhelming.
For your information, the best year in the history of the Dow Jones occurred from July 1932 to July 1933. From its 08 July 1932 low of 41.22, the Dow Jones increased to 108.67 on 18 July 1933: a 164% surge in value as its dividend yield (Red Plot below) collapsed from 10.38% to 2.97% with no increase in payout. The point being changes in the dividend yield can make or break you. Rising yields are signatures of bear markets, declining yields bull markets. This is true for bonds too.
The yield for the Dow Jones since 1925 is plotted below. On full display is the old time tested rule-of-thumb of buying stocks when the Dow Jones is yielding over 6% and selling when its yield declines down to 3%. However, the Dow Jones hasn’t yielded over 6% since October 1982 – thirty-four years and three Fed Chairmen ago. What happened? Alan Greenspan became Chairman of the Federal Reserve in August 1987.
On March 4th, 1987, five months before Greenspan became Fed Chairman, the Dow Jones was yielding 2.98%. From the start of the 1982-2000 bull market (August 11th, 1982) when it was yielding 7.18% the Dow Jones had advanced a huge 1,480 points (190%) in just five years. By the time Greenspan became Fed Chairman in August the Dow Jones was yielding a historic low of 2.59% after advancing 250% from its lows of August 1982.
Mr. Bear was ready to go to work, and in October 1987, he struck. If you read about the Crash of October 1987, they will say that the new phenomenon of “portfolio insurance,” a computerized derivative scheme which drove every computer on the NYSE into sell only mode was responsible for the crash, and that’s true. But almost always ignored is that the Dow Jones was yielding just 2.59%, which historically meant the stock market was due for a bear market.
But that never happened, because with Alan Greenspan’s new “monetary policy” of perpetual financial asset inflation the yield for the Dow Jones would only rise to 4.51% in October of 1990. By the January 2000 top of the high-tech mania, the Dow Jones was yielding only 1.30%. That the Dow Jones only declined 38% during the “Tech Wreck” bear market, a bear market that failed to bottom with the Dow’s dividend yield even back to 3%, or that the credit crisis 54% bear market (the second deepest bear market decline since 1885) failed to drive the Dow Jones’ dividend yield up to 6% illustrates that market forces are no longer a factor in stock market valuations.
But there is good reason to suspect “policy” is now losing its grip on the stock market. It’s a remarkable observation that ever since 1929, the Dow Jones realizes about one dollar in earnings for every billion dollars of CinC. This billion dollars of CinC to one dollar of Dow Jones earnings ratio isn’t bolted together, but the chart below makes my point that for decades stock market earnings have had a strong inflationary component. This history can be divided into two eras:
- 1929-1980: Earnings and increases in CinC are highly correlated (chart insert)
- 1980-2016: Earnings & market crash when the Dow Jones reaches the point of producing $1 of earnings for every billion dollars in CinC.

Remarkable too is that since 1984 every time these two plots have touched (Red Stars) Wall Street experiences a bear market which required the Federal Reserve to bail out the big banks. The latest attempt by the Dow Jones to produce a dollar of earnings for every billion dollars of CinC failed, and the Dow’s earnings have since turned down even as CinC inflation continues to soar. This is a significant change, one I expect will herald the fourth major bear market since 1982.
But we may not see much downward action in the Dow Jones until the dividend payout for the Dow Jones, (currently at all-time highs) also turns down along with Dow’s now retreating earnings. After all, it’s hard to imagine corporations continuing record payouts to shareholders should their earnings collapse. The impact rising dividend yields, and declining payouts will have on the Dow Jones can be seen in the table below. Currently, the Dow is paying out $443. A 32% decline in payout ($300) and a 6% yield fixes the Dow Jones at 5,000: a 72% bear market decline. If the Dow’s dividend payouts collapse 78% as they did in the Great Depression and we see the same 10% dividend yield as in July 1932; that fixes the Dow Jones at $1000 – a 95% bear market decline.
Most people would say a bear market decline of 95% for the Dow Jones is too pessimistic. But I’m not so sure. Look at the earnings chart above. During the credit crisis, Dow Jones earnings collapsed from record highs ($845) in October 2007 to -$109 just nine months later in August 2008, something not seen since the Great Depression. But unlike the 1930s, the Dow Jones earnings would soon again reach new all-time highs.
Exactly how that happened is something for future market historians to ponder. But what if the “policy makers” had used a hands-off approach from 2008 to 2012? Would the Dow’s earnings, and dividend payouts have recovered and moved on to new all-time highs so quickly? I don’t think so. In the coming bear market, if the “policy makers” and market participants discover their QE4 and QE5 are only contributing to the general chaos consuming financial markets, don’t be surprised to see the Dow Jones once again yielding over 10% and paying out something less than $100. It’s happened before.
Publishing Note: I’m going to take a break from writing. My next article will be out the first or second week in May.
Mark J. Lundeen


