Dow Swoons And Gold Consolidates


TLT (US T-Bond Proxy) Possible Rally Chart
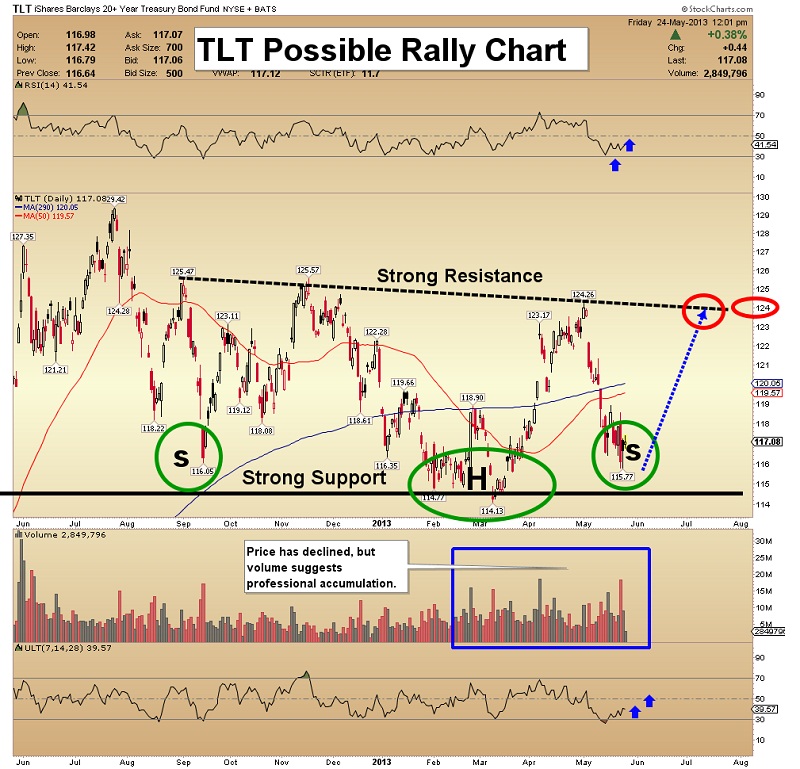
- By late April, the US T-bond had become technically overbought, and the price has now declined for several weeks. The right shoulder of an inverse head and shoulders pattern appears to be forming. That could trigger a strong rally to 124, and maybe all the way to 134.
- Volume patterns indicate that professional investors are buying T-bonds, in size.
- Stock market weakness could also help bonds.
Dow Meltdown Chart
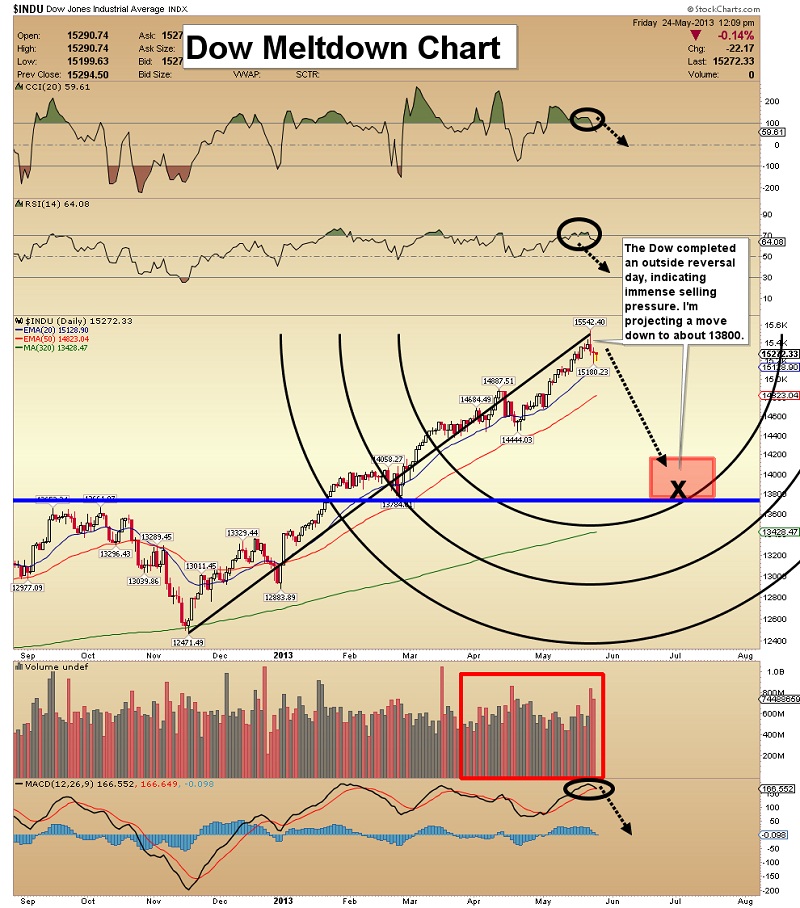
- This week, a number of Fed officials stated their willingness to curtail QE, and many global stock markets experienced a vicious sell-off.
- I expect an initial move down to Dow 13,800.
- News that China’s manufacturing industry slowed substantially is making money managers nervous, and rightfully so.
- Interestingly, while the Dow sold off on Wednesday, the precious metals stocks had a good day.
Gold COT Signals Chart
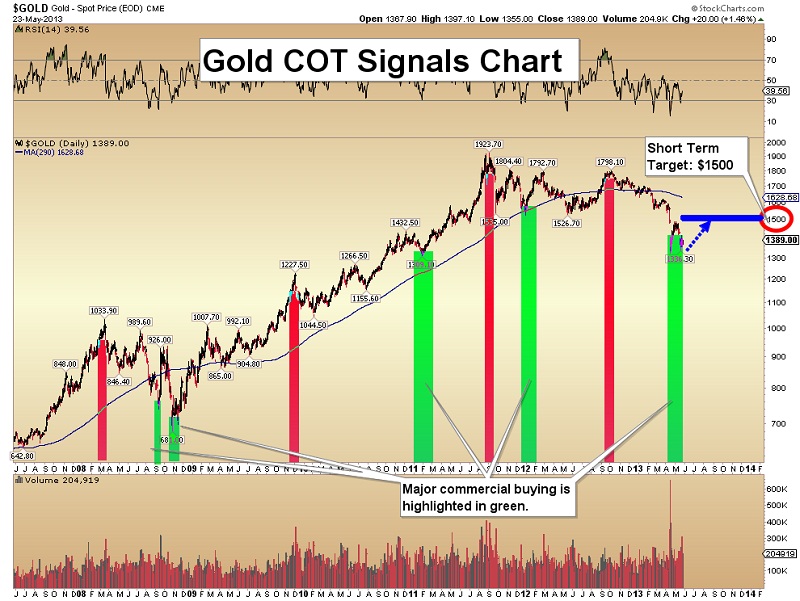
- An interim low could be in place. It’s been about a month since gold fell to the $1320 area, and that low seems fairly solid, for now.
- I see gold moving as high as $1500 before there is one more leg down. That could be a decline to about $1260, which isn’t much lower than the recent move to $1320.
- The most brutal market bottoms offer the greatest opportunity, but that is little comfort to investors at the time of the low. COT data shows the “smart money” commercial traders are now at their lowest net short position since 2008, which is bullish.
Gold $1503 Target Chart
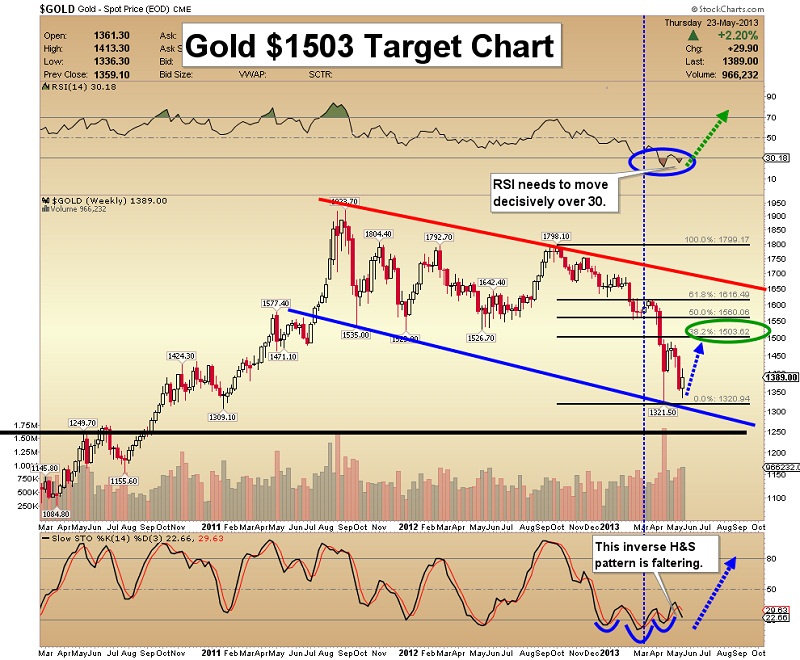
- I have a $1500 target in the intermediate term, because it is a round number that is near a key Fibonacci retracement line. The “Fib” line sits at about $1503.
- Unfortunately, if gold can’t rally to that Fib line, a fast spike down to about $1260 is very likely.
GDX Do Or Die Chart
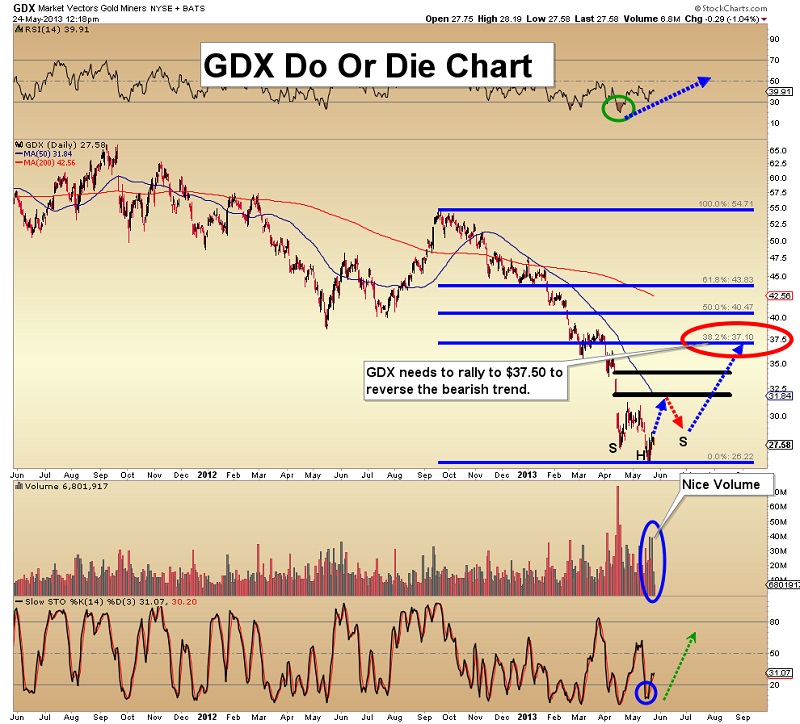
- Volume patterns on senior gold stocks were very encouraging on Monday, with some of the heaviest trading since mid April.
- I believe a small inverse head & shoulders bottom pattern is forming now. I’m projecting a quick move to about $32, followed by a decline back down to the $28 area, to complete that h&s formation.
- If GDX can’t rally to $37.50 fairly quickly, it’s likely to make a new low.
GDXJ Fibonacci Chart
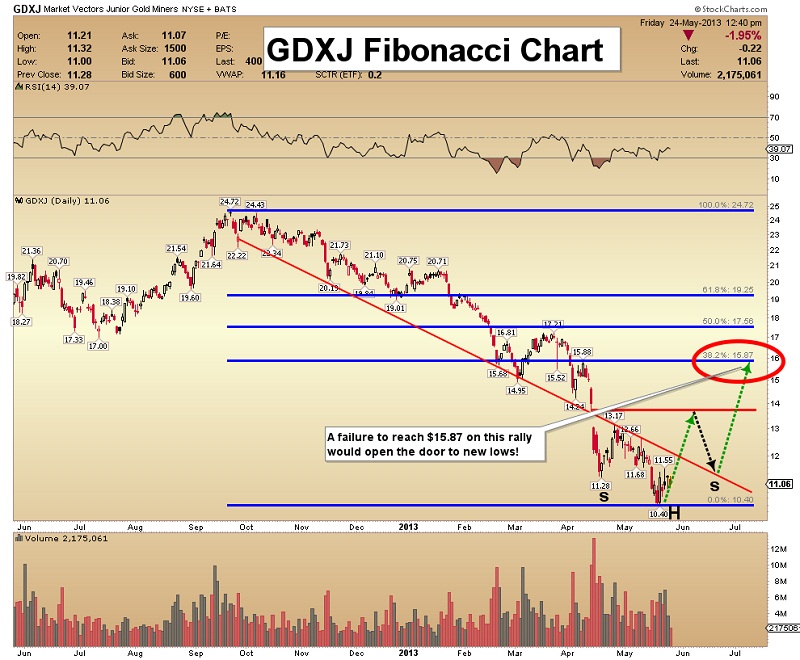
- Volume patterns for the juniors are not very positive, at this point in time. I am waiting for the resistance down channel line to be broken to the upside, and that has yet to happen.
- My own fresh money is going towards the senior stocks for now, but that will change if GDXJ’s trading volume begins to increase more significantly.
Silver Support Zone Chart
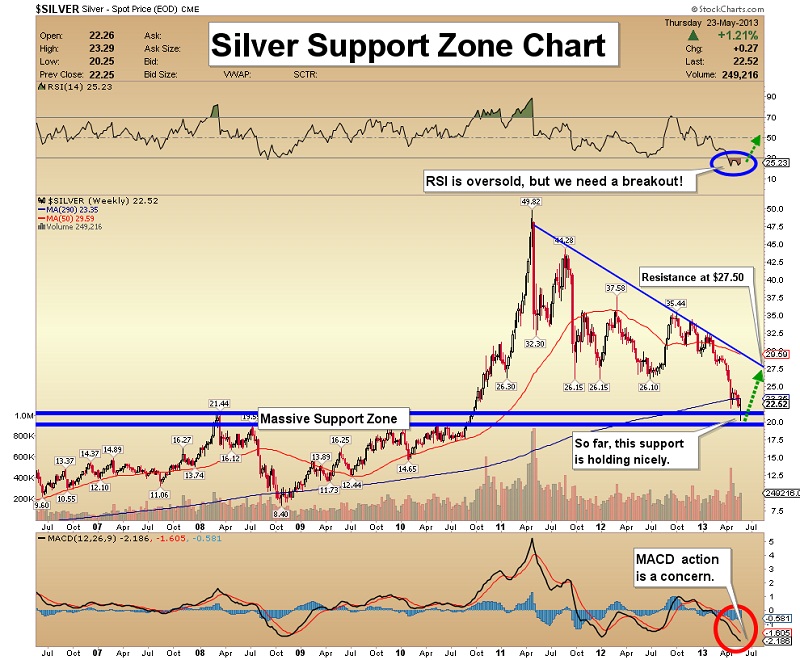
- This week, silver rallied quite impressively. Note the $27.50 target. The $19-$22 area is good support, but the technical indicators need to move higher, before a rally with “teeth” can occur.
- The MACD indicator remains a concern; note the “open mouth” action. Also, RSI needs to break out above 30, which has yet to happen.
- Patience is required! Many gold and silver investors are afraid that the Fed is close to ending QE, but I think a modest tapering is more likely. It may take some time for the current economic “boom” to recede, but when it does, QE is likely to be ramped up significantly.
- If the Fed has to come back with even more QE, that could lead to new highs in the silver market. This won’t be a quick process, but it’s quite likely to happen!
Unique Introduction For Gold-Eagle Readers: Send me an email to [email protected] and I'll send you 3 of my next Super Force Surge Signals, as I send them to paid subscribers, to you for free. Thank-you!
Stay alert for our Super Force alerts, sent by email to subscribers, for both the daily charts on Super Force Signals at www.superforcesignals.com and for the 60 minute charts at www.superforce60.com
About Super Force Signals:
Our Super Force signals are created thru our proprietary blend of the highest quality technical analysis and many years of successful business building. We are two business owners with excellent synergy. We understand risk and reward. Our subscribers are generally successful business owners, people like yourself with speculative funds, looking for serious management of your risk and reward in the market.
Frank Johnson: Executive Editor, Macro Risk Manager.
Morris Hubbartt: Chief Market Analyst, Trading Risk Specialist.
A Leading Market Timing Service
We Take Every Trade Ourselves!
Weekly Market Update Excerpt
Morris Hubbartt
Super Force Signals
422 Richards Street
Vancouver, BC V6B 2Z4
Canada


