Ewave Analysis Of Major Markets


Gold

Gold had a bit of wild ride in the overnight session, reaching a low of 1093.40, and then rallying to a new high for the move of 1118.90!
The drop from yesterday’s day session high of 1108.40 to the overnight low of 1093.40, is corrective looking on the Intraday Chart, so we expect gold to keep moving higher in a series of nested impulsive waves.
If this analysis is valid, then we expect the gold rally to accelerate sharply higher in the days ahead.
Here’s a look at a longer term daily chart:
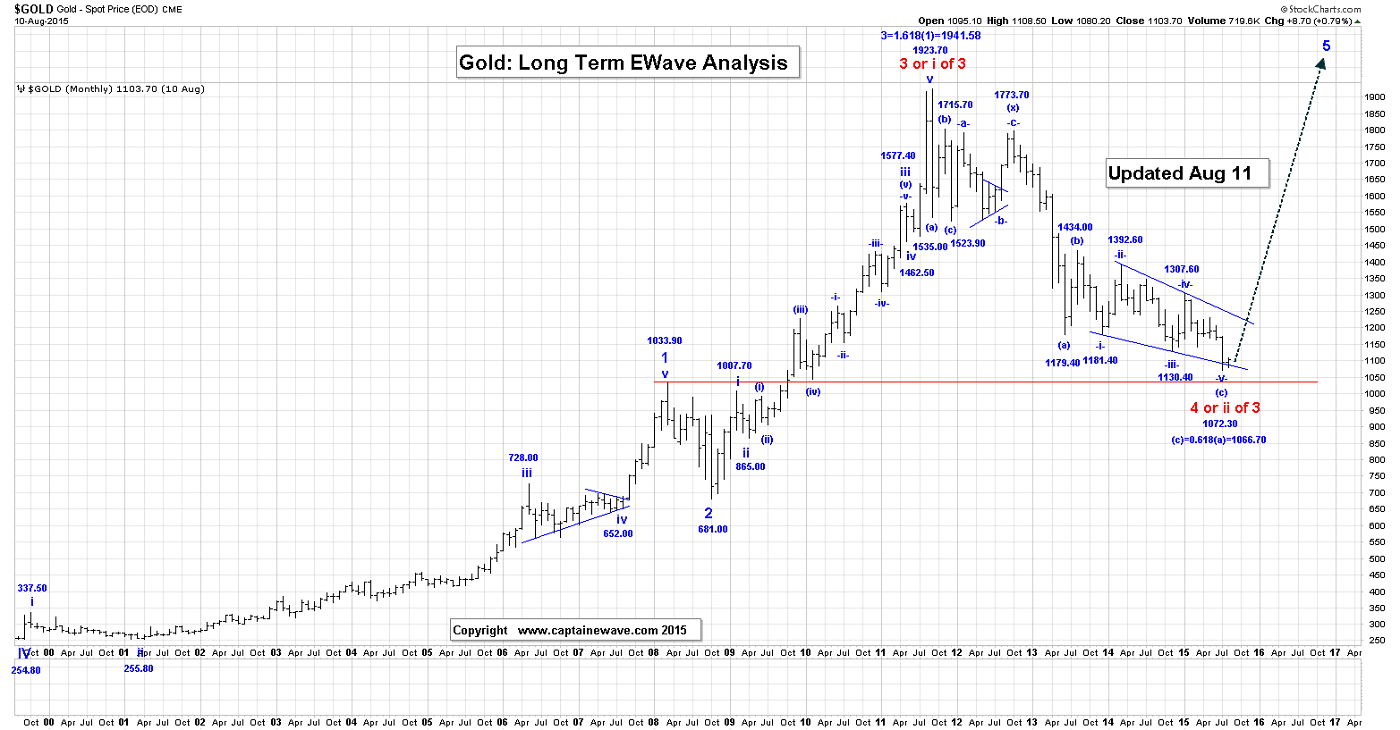
It’s likely some kind of geopolitical event that creates the huge C wave rally, but our job is not to figure that out. We focus on the wave structures.
Our current wave analysis for the early stages of wave C is as follows:
-i- =1104.90;
-ii- = 1079.30;
-iii-:
.i. = 1102.70;
.ii. = 1080.30;
.iii.:
^i^ = 1093.90;
^ii^ = 1082.10;
^iii^:
*i* = 1098.90;
*ii* = 1089.10;
*iii* higher has begun.
We will start providing some projections for all of these nested impulsive wave sequences in a day or so. Our next targets are the 1131.40 and 1141.60 lows!
We are now long 20 positions, risking to 1072!!
CRUDE OIL

Crude reached a high of 45.32 in the overnight session, before moving lower. At the time that this Post is being written crude has dropped to a low of 43.79.
As we mentioned in yesterday’s End of Day Post, we are still expecting crude to drop to our minimum target of 42.41 to complete what we believe to be is a major low in wave b.
The rally to 45.32 in the overnight session has challenged our red downtrend line that we have on our Daily Chart.
Only a break and close above this line about now would suggest that we are turning higher.
Here’s a longer term look at the Crude chart:

We plan to be long at our assumed bottom!
We will buy 5 positions at 42.35, with 42.00 puts as our risk protection.
S&P500

The S&P futures were down in the overnight session, about 12 points on the surprise Chinese Yuan devaluation story.
This drop does not change our current thinking and we are expecting one more push higher to at least the 2114.24 high to complete wave ^c^ and all of wave .ii.
Our preferred Option count looks like:
.i. = 2063.52;
.ii.:
^a^ = 2114.24;
^b^ = 2067.91;
^c^ rally is now, with a minimum target of 2114.24.
Only a break above the 2132.82 high would suggest that Option 1 is back in play. We plan to short 3 positions at 2115.00, risking to 2133.00
We plan to short 3 positions at 2115.00, risking to 2133.00 and 3 more at 2063.00. If we get filled on our 2063.00 positions, we will advise of a lower stop location.
USDX
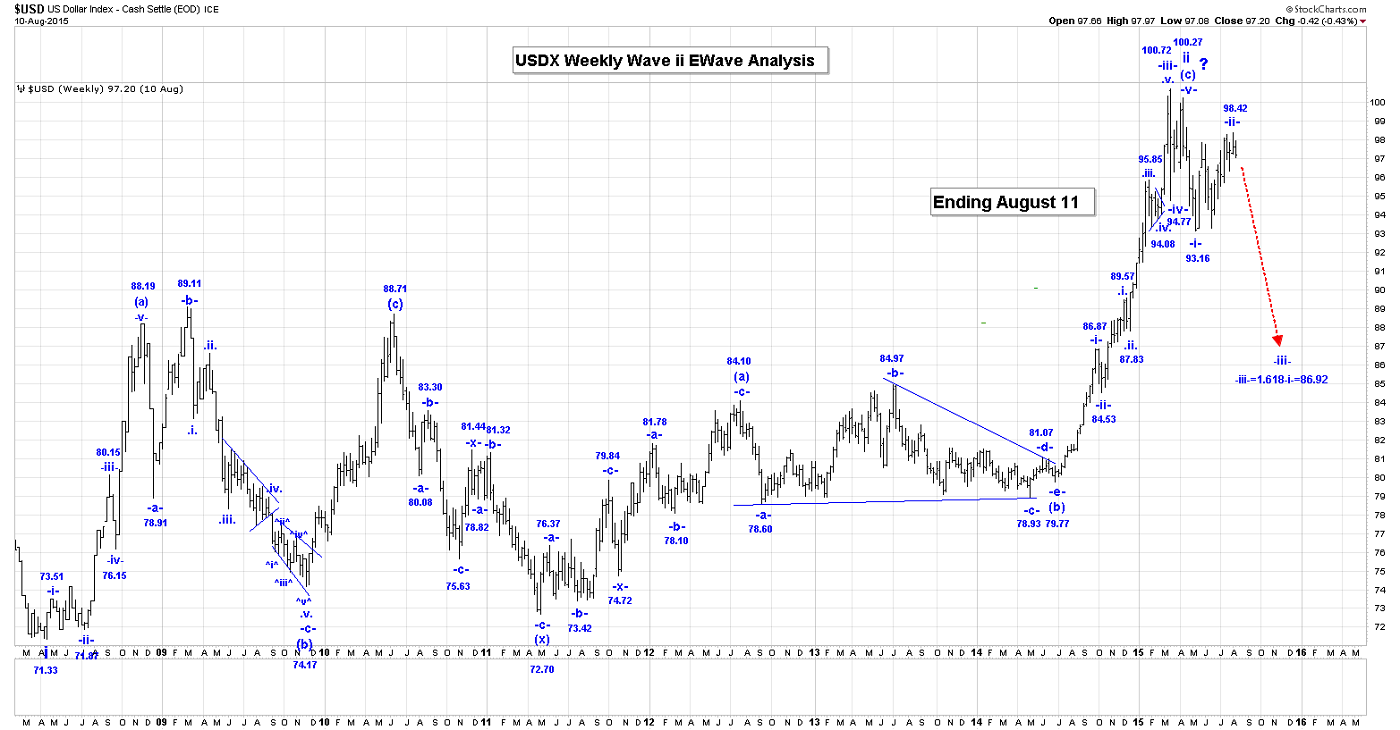
The USDX had an interesting overnight session, with the Chinese Yuan news, but that movement just seems to support our current thinking.
In the overnight session we reached a high of 97.64, before turning lower heading back to 97.06 level, at the time that this Post was being written.
On the Intraday Chart, the rally from 97.08 to the overnight high of 97.64 looks corrective, which is bearish and suggests lower prices ahead.
We note that 61.8% retracement of the drop from 97.97 to 97.08 is 97.63, which is just 1 tick from the overnight session high. It looks to us that the USDX is about to drop sharply lower as wave .iii. and is subdividing as we have shown below:
.i. = 97.58;
.ii. = 97.97. Note our 50% retracement was 98.00.
.iii.:
^i^ = 97.08;
^ii^ = 97.64;
^iii^ drop is next.
Projections for the end of wave .iii. are:
.iii. = 1.618.i. = 96.59
.iii. = 2.618.i. = 95.74.
We were filled this AM on 5 additional short positions at 97.05 and have moved our stop on all positions to 97.98.
We are short 10 USDX positions, risking to 97.98!!
NATGAS
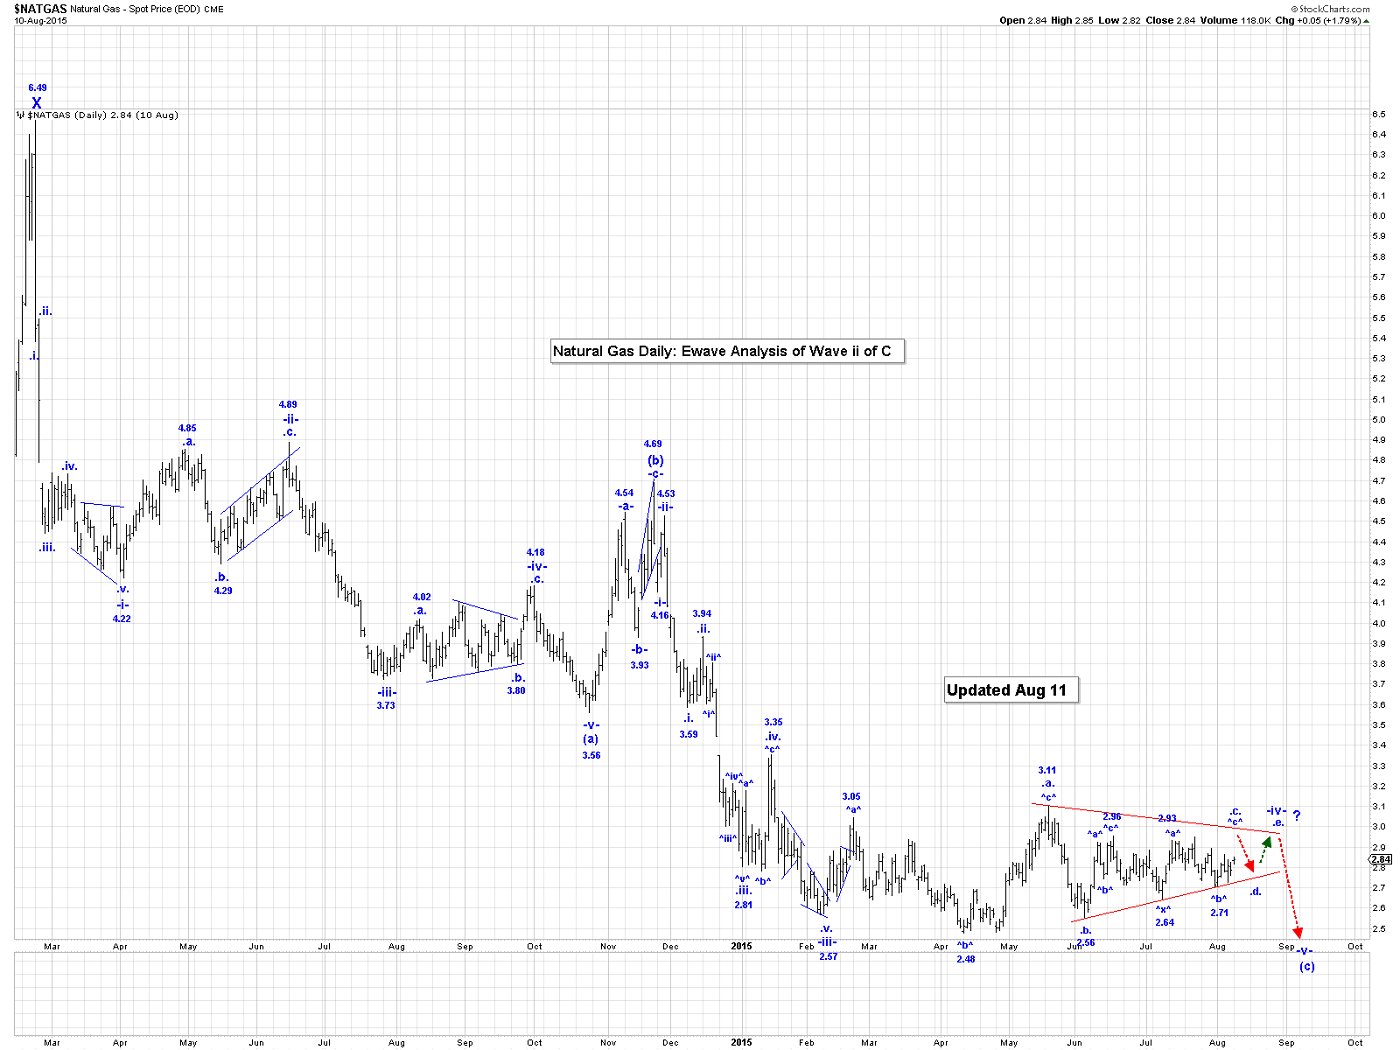
NG was lower in the overnight session, reaching 2.80834. On the Intraday Chart the drop from 2.8515 to 2.8034 is corrective, which we is bullish, so we expect this market will continue to grind higher in our second wave ^c^ of .c.
Our current wave -iv- triangle count looks like:
.a.= 3.11;
.b. = 2.56;
.c.:
^a^ = 2.92;
^b^ = 2.44;
^c^= 2.96;
^x^ = 2.64;
^a^ = 2.9324;
^b^ = 2.7074, if complete;
^c^ rally to at least the 2.96 high, to complete all of wave .c.
Our projection for the end of our second wave ^c^ is:
^c^ = ^a^ = 3.00.
.d. and .e. to go to complete all of this wave -iv- triangle.
HUI/GDX/XAU
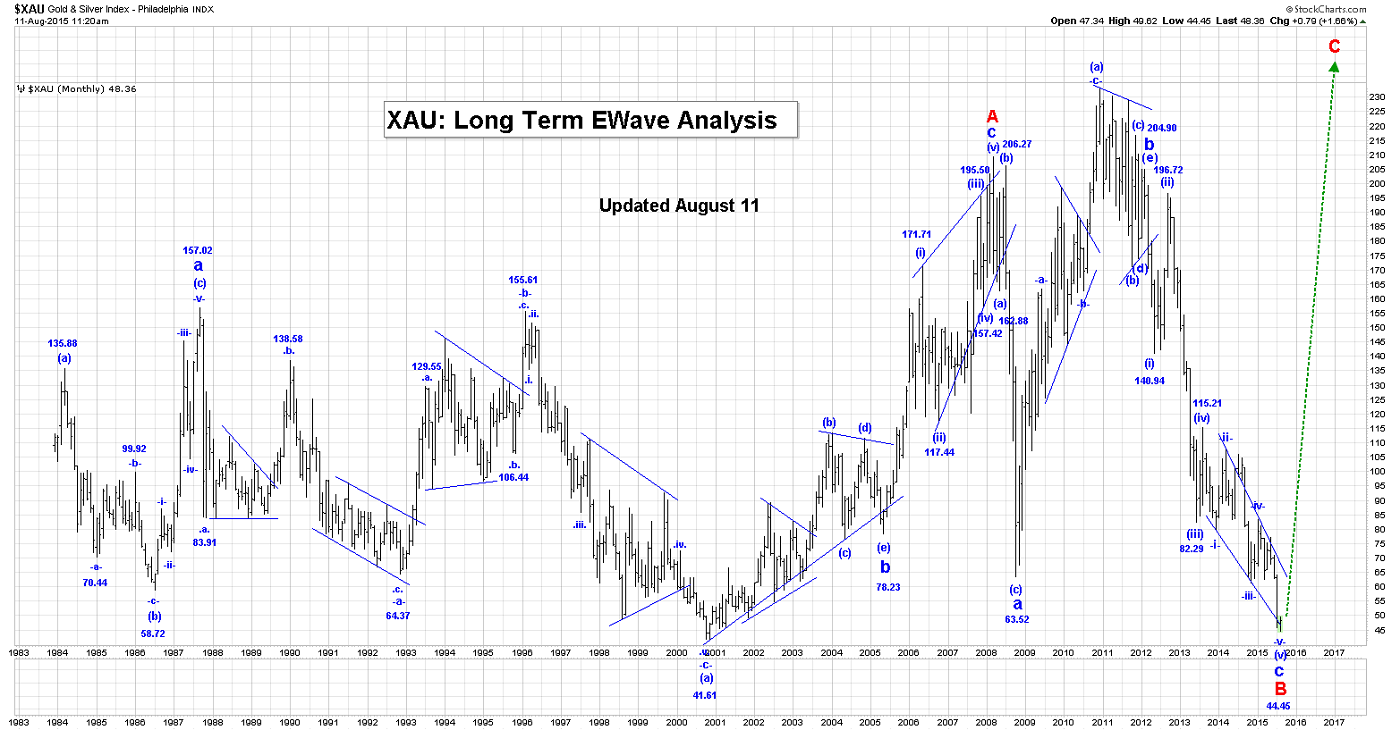
With gold moving higher, we expect the rally in all gold stocks and indices to continue!
We will likely have our new 10 Min GDX count available later today or for tomorrow’s Morning Post for subscribers.
For a week or so, when gold indices collapsed, we started accumulating gold stocks and the GDX and XGD.
Some of these gold stocks are up 20% already! We hope readers did the same as the Captain, and accumulated!
It is not too late to buy, and we continue to suggest that the GDX, and all gold stocks be accumulated at these levels.
We are long the GDX, ABX, KGC, NEM, CRJ, and TSX:XGD with no stops!
CRB INDEX

It’s very difficult for gold stocks to rally in a sustained way without an accompanying rally in most commodities. Gold stocks like inflation, and a rising CRB index suggests inflation is present.
We have added a long-term quarterly bars CRB index to our chart list…and include it here now. All Ewave signposts point to an impending “mega rally” in the CRB index. And that’s truly great news for gold stocks!
********
Email: [email protected]
Website: www.captainewave.com
Risk: CAPTAINEWAVE.COM IS AN IMPERSONAL ADVISORY SERVICE. AND THEREFORE, NO CONSIDERATION CAN OR IS MADE TOWARD YOUR FINANCIAL CIRCUMSTANCES. ALL MATERIAL PRESENTED WITHIN CAPTAINEWAVE.COM IS NOT TO BE REGARDED AS INVESTMENT ADVICE, BUT FOR GENERAL INFORMATIONAL PURPOSES ONLY. TRADING STOCKS DOES INVOLVE RISK, SO CAUTION MUST ALWAYS BE UTILIZED. WE CANNOT GUARANTEE PROFITS OR FREEDOM FROM LOSS. YOU ASSUME THE ENTIRE COST AND RISK OF ANY TRADING YOU CHOOSE TO UNDERTAKE. YOU ALSO AGREE TO BEAR COMPLETE RESPONSIBILITY FOR YOUR INVESTMENT RESEARCH AND DECISIONS AND ACKNOWLEDGE THAT CAPTAINEWAVE.COM HAS NOT AND WILL NOT MAKE ANY SPECIFIC RECOMMENDATIONS OR GIVE ADVICE TO YOU OR ANY OF ITS CLIENTS UPON WHICH THEY SHOULD RELY. CAPTAINEWAVE.COM SUGGESTS THAT THE CLIENT/MEMBER TEST ALL INFORMATION AND TRADING METHODOLOGIES PROVIDED AT OUR SITE THROUGH PAPER TRADING OR SOME OTHER FORM OF TESTING. CAPTAINEWAVE.COM, ITS OWNERS, OR ITS REPRESENTATIVES ARE NOT REGISTERED AS SECURITIES BROKER-DEALERS OR INVESTMENT ADVISORS EITHER WITH THE U.S. SECURITIES AND EXCHANGE COMMISSION OR WITH ANY STATE SECURITIES REGULATORY AUTHORITY. WE RECOMMEND CONSULTING WITH A REGISTERED INVESTMENT ADVISOR, BROKER-DEALER, AND/OR FINANCIAL ADVISOR. IF YOU CHOOSE TO INVEST WITH OR WITHOUT SEEKING ADVICE FROM SUCH AN ADVISOR OR ENTITY, THEN ANY CONSEQUENCES RESULTING FROM YOUR INVESTMENTS ARE YOUR SOLE RESPONSIBILITY.
ALL INFORMATION POSTED IS BELIEVED TO COME FROM RELIABLE SOURCES. CAPTAINEWAVE.COM DOES NOT WARRANT THE ACCURACY, CORRECTNESS, OR COMPLETENESS OF INFORMATION AVAILABLE FROM ITS SERVICE AND THEREFORE WILL NOT BE LIABLE FOR ANY LOSS INCURRED. DUE TO THE ELECTRONIC NATURE OF THE INTERNET, THE CAPTAINEWAVE.COM WEBSITE, ITS E-MAIL & DISTRIBUTION SERVICES AND ANY OTHER SUCH "ALERTS" COULD FAIL AT ANY GIVEN TIME. CAPTAINEWAVE.COM WILL NOT BE RESPONSIBLE FOR UNAVAILABILITY OF USE OF ITS WEBSITE, NOR UNDELIVERED E-MAILS, OR "ALERTS" DUE TO INTERNET BANDWIDTH PROBLEMS, EQUIPMENT FAILURE, OR ACTS OF GOD. CAPTAINEWAVE.COM DOES NOT WARRANT THAT THE TRANSMISSION OF E-MAILS, OR ANY "ALERT" WILL BE UNINTERRUPTED OR ERROR-FREE. CAPTAINEWAVE.COM WILL NOT BE LIABLE FOR THE ACTS OR OMISSIONS OF ANY THIRD PARTY WITH REGARDS TO CAPTAINEWAVE.COM DELAY OR NON-DELIVERY OF THE CAPTAINEWAVE.COM NIGHTLY EMAILS OR "ALERTS". FURTHER, WE DO NOT RECEIVE ANY FORM OF PAYMENT OR OTHER COMPENSATION FOR PUBLISHING INFORMATION, NEWS, RESEARCH OR ANY OTHER MATERIAL CONCERNING ANY SECURITIES ON OUR SITE OR PUBLISH ANY INFORMATION ON OUR SITE THAT IS INTENDED TO AFFECT OR INFLUENCE THE VALUE OF SECURITIES.
THERE IS NO GUARANTEE PAST PERFORMANCE WILL BE INDICATIVE OF FUTURE RESULTS. NO ASSURANCE CAN BE GIVEN THAT THE RECOMMENDATIONS OF CAPTAINEWAVE.COM WILL BE PROFITABLE OR WILL NOT BE SUBJECT TO LOSSES. ALL CLIENTS SHOULD UNDERSTAND THAT THE RESULTS OF A PARTICULAR PERIOD WILL NOT NECESSARILY BE INDICATIVE OF RESULTS IN FUTURE PERIODS. THE RESULTS LISTED AT THIS WEBSITE ARE BASED ON HYPOTHETICAL TRADES. PLAINLY SPEAKING, THESE TRADES WERE NOT ACTUALLY EXECUTED. HYPOTHETICAL OR SIMULATED PERFORMANCE RESULTS HAVE CERTAIN INHERENT LIMITATIONS. UNLIKE AN ACTUAL PERFORMANCE RECORD, SIMULATED TRADES DO NOT REPRESENT ACTUAL TRADING. ALSO, SINCE THE TRADES HAVE NOT ACTUALLY BEEN EXECUTED, THE RESULTS MAY HAVE OVER OR UNDER COMPENSATED FOR THE IMPACT, IF ANY, OF CERTAIN MARKET FACTORS SUCH AS LACK OF LIQUIDITY. YOU MAY HAVE DONE BETTER OR WORSE THAN THE RESULTS PORTRAYED. NO REPRESENTATION IS BEING MADE THAT ANY ACCOUNT WILL OR IS LIKELY TO ACHIEVE PROFITS OR LOSSES SIMILAR TO THOSE SHOWN. NO INDEPENDENT PARTY HAS AUDITED THE HYPOTHETICAL PERFORMANCE CONTAINED AT THIS WEBSITE, NOR HAS ANY INDEPENDENT PARTY UNDERTAKEN TO CONFIRM THAT THEY REFLECT THE TRADING METHOD UNDER THE ASSUMPTIONS OR CONDITIONS SPECIFIED HEREAFTER. WHILE THE RESULTS PRESENTED AT THIS WEBSITE ARE BASED UPON CERTAIN ASSUMPTIONS BELIEVED TO REFLECT ACTUAL TRADING CONDITIONS, THESE ASSUMPTIONS MAY NOT INCLUDE ALL VARIABLES THAT WILL AFFECT, OR HAVE IN THE PAST AFFECTED, THE EXECUTION OF TRADES INDICATED BY CAPTAINEWAVE.COM. THE HYPOTHETICAL RESULTS ON THIS WEBSITE ARE BASED ON THE ASSUMPTION THAT THE CLIENT BUY AND SELLS THE POSITIONS AT THE OPEN PRICE OF THE STOCK. THE SIMULATION ASSUMES PURCHASE AND SALE PRICES BELIEVED TO BE ATTAINABLE. IN ACTUAL TRADING, PRICES RECEIVED MAY OR MAY NOT BE THE SAME AS THE ASSUMED ORDER PRICES.


