Expect Dow Jones Above 22,000 In The Coming Weeks


Not unexpected, the Dow Jones Index made new all-time highs on the last three trading days of the week. The number of BEV Zeros the Dow has made since the November election increases weekly. Since the elections, there have been 169 NYSE trading sessions, of which 42 (25% or 1 in 4) have seen the Dow Jones close at a new all-time high. Looking at all the BEV Zeros in the plot below, since last October, it’s been a hot market.
However, it’s also been a long time since the Dow Jones has seen a double-digit correction (Jan/Feb 2016), or when it found itself 5% or more from a last all-time high (last summer). This won’t go on forever, and the market may be more than just a little shocked when it realizes that it takes a 1,082 point decline before the Dow Jones corrects just 5%.
Look at the table below. It takes a 2,164 point decline before the Dow Jones sees a double digit correction. That will freak out everyone at CNBC. But what’s freaking me out is that the Dow Jones now finds itself at the door step of breaking above 22,000.
The Dow Jones step sum chart below looks very positive. Since March, its step sum has fallen behind the rising price plot, creating a bull box. Now it appears the step sum (market sentiment) is once again becoming as positive as the Dow Jones’ rising price plot. Just looking at what I see below, I expect the daily advances for the Dow Jones to begin overwhelming the daily declines in the weeks ahead of us (a rising step sum plot). That will close the bull box and should give the Dow Jones a nice little boost upward as this happens.
But after it does, what then? It’s too early for us to think of that. Let’s see how far above 22,000 the Dow Jones can go before it tops out.

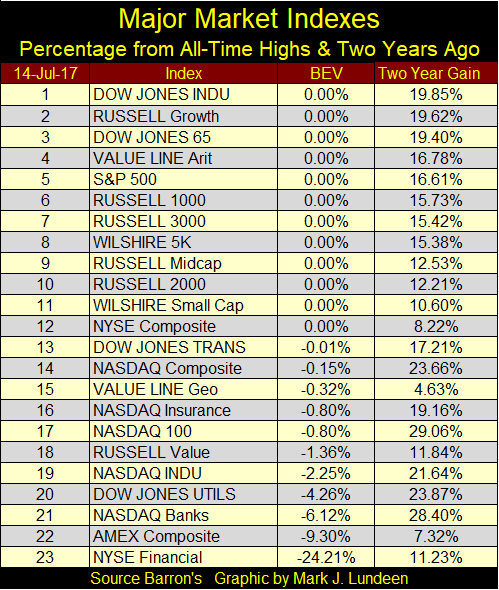
It’s not just the Dow Jones that’s been making history since the November elections. The other major indexes are doing very good too. At the close of this week’s trading, twelve of the major market indexes I follow also closed at new all-time highs, and most of the rest are just a whisker from making one.
But the gains seen in the past two years are less than I’d expected. Maybe we shouldn’t read too much into that as the only important point to make of this data is that these indexes are going up.
But the question is how much longer can an advance that began in March 2009 continue? Maybe longer than any of us can imagine. That said, I’m still curious about what happens come September / October. We’ll see another “debt crisis” in the US Treasury if Congress doesn’t raise the Treasury’s debt ceiling. That’s usually a hard time for the stock market.
But if they do raise the debt ceiling (as they always do), how can having a national debt increase to over 20 trillion dollars not also be described as a debt crisis? What is the government spending all this money on? They don’t tell us, as they know we wouldn’t approve.
This is a bad situation, where ahead of us all is a dark alley where one day Mr Bear will greet everyone with a great big bear hug. But when?
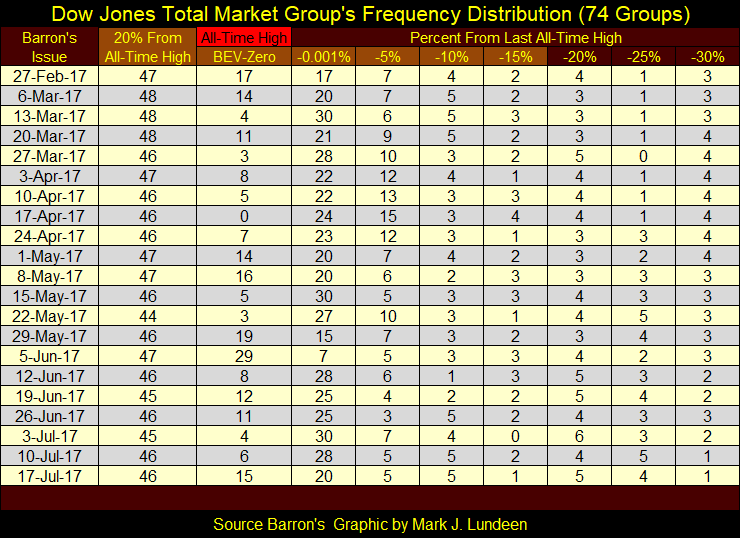
Let’s look at the Dow Jones Total Market Groups (DJTMG); first the new all-time highs. Keep in mind that currently there are 153 groups in the DJTMG, of which I only use 74 in the series below. I can’t help it. Since 1988, there have been many changes to this market series, each creating complications in my files and in my life. I finally said to heck with it. Just because the Dow Jones Inc. makes a change, doesn’t mean I have to follow. So, since 1992 it’s been 74 groups, and 74 groups it’s going to stay! It’s still good data.
This week, the DJTMG groups I follow saw 15 new all-time highs, and as you can see in the table in the chart below, it saw 29 not all that long ago, in Barron’s June 5th issue. This series should peak, and then decline as a bear market approaches. Seeing a 29 just a few weeks ago, two and a half years after it last saw a 29 in December 2014, is a bit unusual. Obviously the “policy makers” aren’t willing to allow their market bubble to deflate; not yet anyways.
I know I must make some people groan with my talking about the “policy makers” doing this and the “policy makers” doing that. But that’s the way it is.
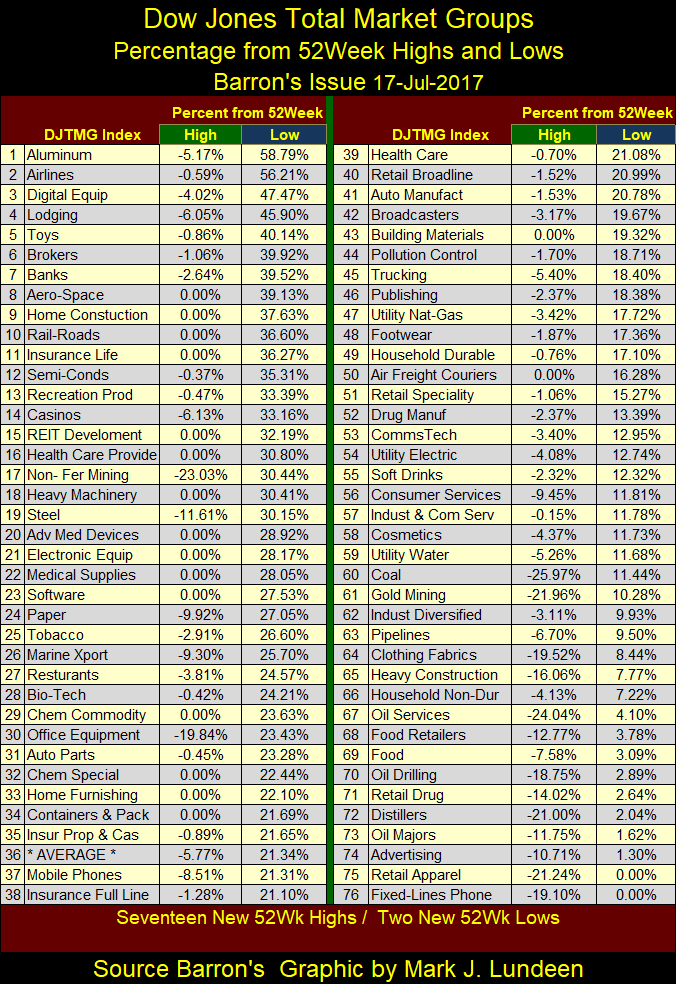
Here’s the DJTMG’s 52Wk High & Low performance (76 groups / don’t even ask!). I bring to your attention #40: Retail Broadline. I keep seeing news about store closings for Sears, J.C. Penney’s, Best Buy and Walmart. I can drive around my community and see all the store closings and empty strip malls. Retail in July 2017 is in a horrible situation.
So, how can the DJTMG’s Retail group be only 1.52% from its 52Wk high, and up 21% from its 52Wk Low with all these store closings? I expect it’s a “policy” thing.
Also, Amazon has become the all-consuming beast in retail; a beast that’s doing to Walmart, what Walmart did to everyone else in retail.
But then, Amazon’s Jeff Bezos is just someone who people enjoy doing nice things for. First, Wall Street gives him $300 million to purchase the dying Washington Post so it can continue maligning President Trump, then the CIA gives him a $600 million dollar contract for cloud services. I’m not surprised the US Post Office is also giving Jeff’s retail business a $1.46 subsidy on every box it ships; wouldn’t you for Jeff?
https://www.wsj.com/articles/why-the-post-office-gives-amazon-special-delivery-1499987531
This is the world we live in.
And I expect there are lots of economic statistics, published by the government for public consumption; statistics that are never questioned by the financial media that are as divorced from reality as the DJTMG’s Retail Broadline group below. The same can be said for #41 (Auto Manufactures) and #42 (Broadcasting), and most likely many other groups in the table. But as long as the stock market continues going up, all is right with the world – right?
Here are the DJTMG’s top 20, or the number of groups above within 20% of their last all-time highs. The top 20 has been stuck in the mid to low 40s since last July. It can’t go up, and won’t go down. Technically speaking, the top 20 is stuck, and since 1992, that hasn’t happen very often.
Here is the frequency table where I derive the new all-time highs and the top 20 data for the DJTMG. There’s some churning between the groups in the BEV Zero to the -5% columns, but the top 20 column for the most part is stuck between 44 and 48 since February; really since last July.
What do I make of this? Looking at the past twenty-five years in the chart above, it appears that our “bull market” is being managed by the usual suspects.
But if you’re in the market and making money, why should you care? Well, you shouldn’t. I’m a big bear on the stock market, but short term I’m pretty bullish. So if you’re making money, keep doing what you’re doing. Just remember, its times like this when it makes more sense to look for reasons to sell, than to find reasons to buy more of what you have.
Moving to gold and its step sum, it appears that contrary to what I said last week, both the price of gold and its step sum are in the early phases of reversing to the upside.

But the increase in the price of gold seen above is only from a one day advance, seen on Friday (today / table below). After a big decline that lasted a few trading weeks, seeing a one day bounce is not unexpected. So, it’s good seeing gold getting a nice bounce, but I’m still expecting lower gold prices in the days and maybe weeks to come.
I hope I’m wrong. No one would be happier than me seeing gold close over $1270 on Friday next week. But markets work in cycles. I’m looking at gold’s step sum in the table below, and since June 9th (25 trading days ago) it’s remained around 242 the entire time as the price of gold has fallen $50. It’s a bear box.
Until the bulls, once again, are able to get more out of their advancing days than the bears in their declining days, this pattern isn’t going to change. So, I’m still short term bearish on gold.

The story the Dow Jones’ step sum is telling us in the table above is completely different. Like gold, it’s step sum has been stuck between 439 to 443 for weeks, but the Dow Jones has been advancing. And now it appears its step sum will break above 443 next week. If this happens, the Dow Jones most likely is entering into a period where it will see more advancing days than decliners IN AN ADVANCING MARKET.
If this happens, and it should, it won’t be hard for the Dow Jones to break above 22,000 in the weeks to come.
Mark J. Lundeen


