Forex Trading Alert: U.S. Dollar Declines Against Major Currencies


Earlier this week, the U.S. currency erased some losses against the euro, yen and Swiss franc. However, the greenback moved lower against the British after data showed that construction output in the U.K. rose at the fastest rate since August 2007 in January, suggesting that the economic recovery is continuing. The U.S. dollar also declined against its Australian counterpart after the Reserve Bank of Australia left rates on hold at 2.5%. What impact did these numbers have on major currency pairs? If you want to know our take on this question, we invite you to read the following part of this Forex Trading Alert.
In our opinion the following forex trading positions are justified - summary:
-
EUR/USD: none
-
GBP/USD: none
-
USD/JPY: none
-
USD/CAD: none
-
USD/CHF: none
-
AUD/USD: long (stop-loss order: 0.8728 and an upside target: slightly below 0.9075)
EUR/USD
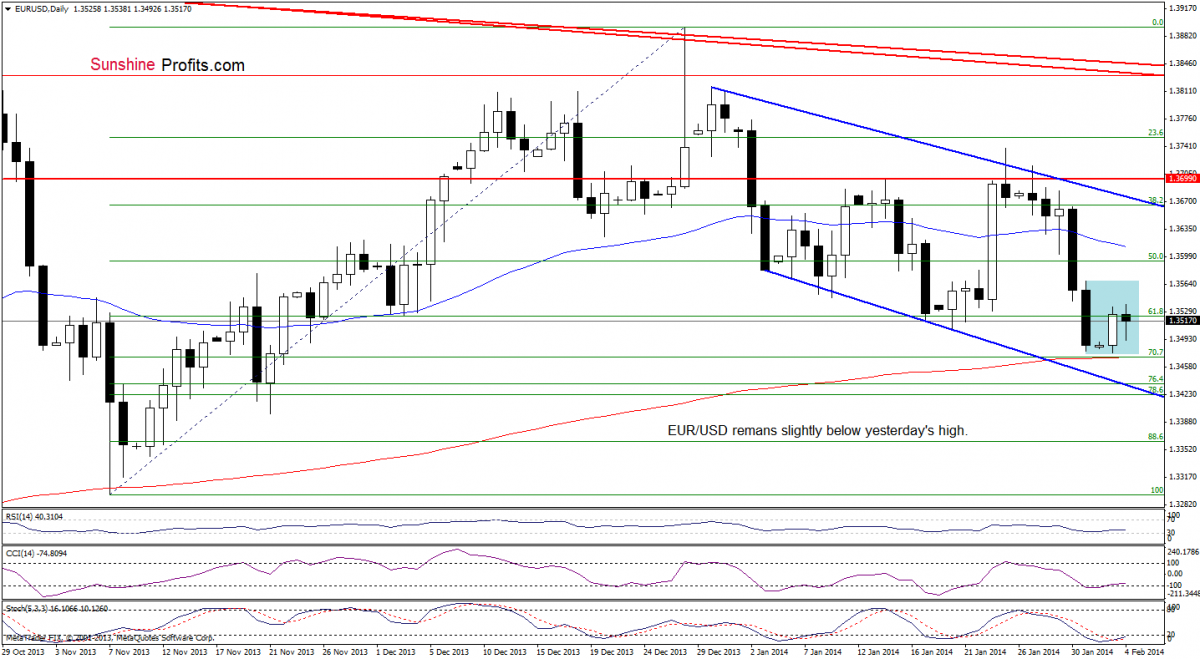
Looking at the above chart, we see that the situation hasn’t changed much as EUR/USD remains slightly below yesterday’s high. As you see on the daily chart, recent days have formed a consolidation (marked with blue). From this perspective, it seems that as long as the pair is trading in this area, further gains and declines seem limited. Please note that the lower border of this formation is reinforced by 70.7% Fibonacci retracement level and the 200-day moving average. Additionally, the CCI and Stochastic Oscillator generated buy signals, which will likely trigger an upward move (and a breakout above the upper line of the consolidation range) in the coming day (or days).
Very short-term outlook: mixed with bullish bias
Short-term outlook: mixed
MT outlook: mixed
LT outlook: bearish
Trading position (short-term): In our opinion no positions are justified from the risk/reward perspective.
GBP/USD
Quoting our last Forex Trading Alert:
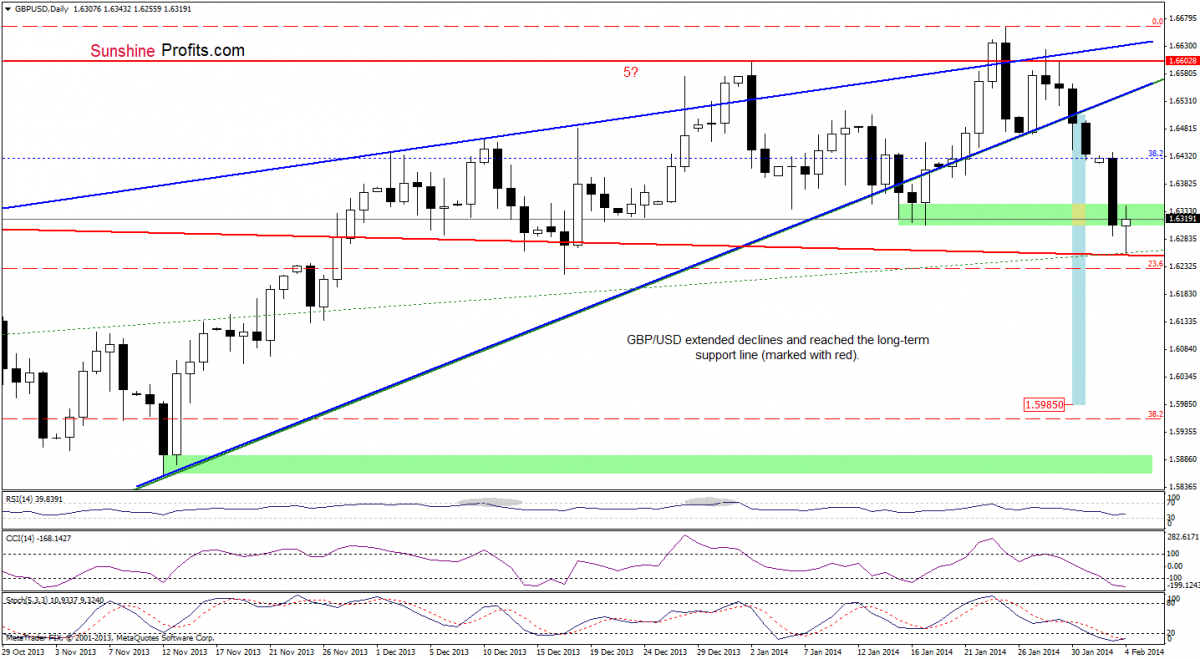
(…) the breakdown below the lower border of the rising wedge, (…) triggered a sharp decline that took GBP/USD to its first downside target. (…) If this support level (…) is broken, we will see further deterioration and the next target for the sellers will be the long-term declining support line (marked with red). (…) Please note that the latter (bearish case) is reinforced by the position of the indicators.
On the above chart, we see that GBP/USD reached its next downside target - the long-term declining support line (marked with red) and rebounded earlier today. If this strong support line encourages the buyers to push the order button, we will likely see a corrective upswing and the first upside target will be yesterday’s high. However, if it is broken, we will see further deterioration and the next target for the sellers will be around 1.5985 where the price target for the breakdown below the lower border of the rising wedge is. Such price action might make us consider opening short positions. Nevertheless, taking into account the position of the indicators (which are oversold), it seems that the first scenario is more likely in the coming day (or days).
Very short-term outlook: bearish
Short-term outlook: mixed with bearish bias
MT outlook: mixed
LT outlook: mixed
Trading position (short-term): In our opinion no positions are justified from the risk/reward perspective.
USD/JPY
In our last Forex Trading Alert, we wrote:
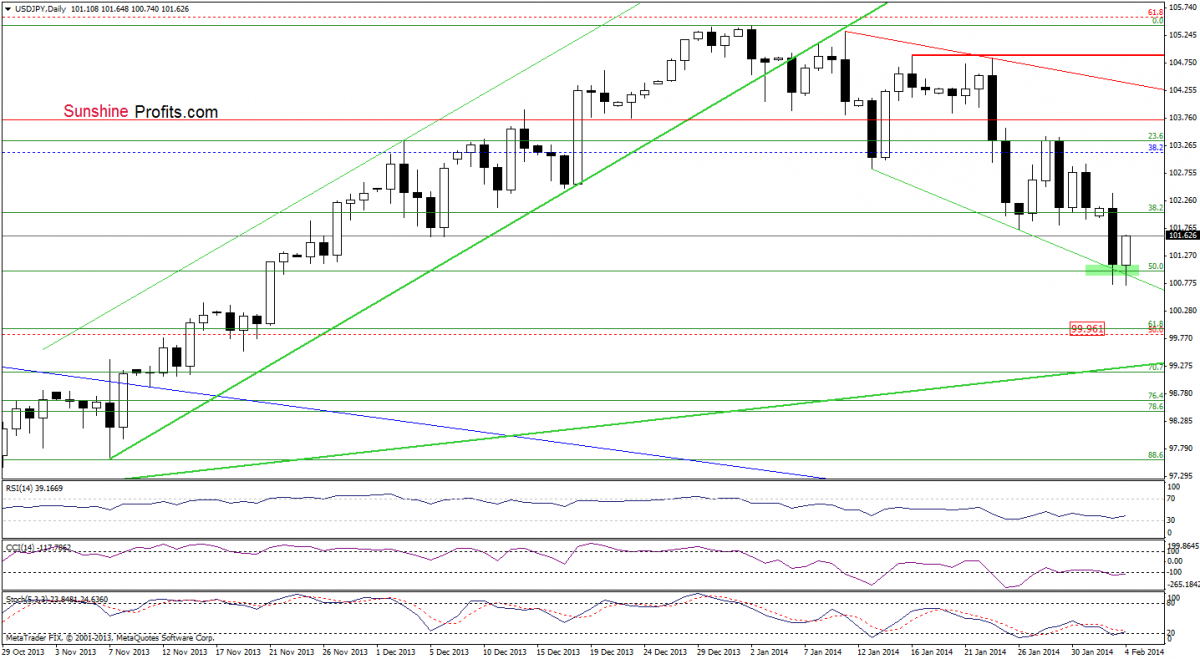
(…) the pair broke below the January low and almost reached the 50% Fibonacci retracement level. (…) USD/JPY also reached the declining support line (marked with green) based on recent lows. If this support zone encourages buyers, we may see a corrective upswing.
As you see on the above chart, we noticed such price action earlier today. USD/JPY rebounded after two small drops below the support zone. Despite this drop, the buyers didn’t give up and managed to push the exchange rate higher. Please note that, the CCI and Stochastic Oscillator are close to generating buy signals, which is a positive signal. Nevertheless, we should keep in mind that the pair remains below the previous lows and the size of an upward correction is still quite small. Therefore, it seems justified to wait for further improvement (for instance a comeback above the previous low) before opening long positions.
Very short-term outlook: bearish
Short-term outlook: mixed with bearish bias
MT outlook: bullish
LT outlook: bearish
Trading position (short-term): In our opinion no positions are justified from the risk/reward perspective.
USD/CAD

On the above chart, we see that the situation has deteriorated slightly as USD/CAD declined below the upper line of the rising trend channel once again. As you see on the daily chart, we saw similar price action yesterday, but the pair quickly invalidated the breakdown. Although this was a positive sign, as it turned out earlier today, the improvement was only temporary. From this perspective, what we wrote in our last Forex Trading Alert remains up-to-date.
(…) the breakdown is not confirmed at the moment. It seems that if the pair closes the day below this strong support line, we will likely see further deterioration and the first downside target for the sellers will be around 1.0952 where the Jan.22 low is. On the other hand, if the buyers managed to push the exchange rate above this line once again, we may see an upswing to Friday’s high. Nevertheless, taking into account sell signals generated by the indicators it seems that the first scenario is more likely.
Very short-term outlook: mixed with bearish bias
Short-term outlook: bullish
MT outlook: bullish
LT outlook: bearish
Trading position (short-term): In our opinion, if the pair closes the day below the upper line of the rising trend channel and declines below the Jan. 27 low at 1.1030, we might consider going short.
USD/CHF

Looking at the above chart, we see that the situation hasn’t changed much as USD/CHF remains in a consolidation range (marked with blue) slightly below the upper line of the trend channel. From this perspective, what we wrote in our last Forex Trading Alert is still up-to-date also today.
(..) an invalidation of the breakout above this support/resistance line is a bearish signal – especially when we factor in the position of the Stochastic Oscillator, which generated a sell signal (…) it seems that further deterioration is just around the corner, and the downside target for the sellers would be the lower border of the trend channel, which intersects with the previously-broken short-term support/resistance line (marked with dark blue) at the moment.
Very short-term outlook: mixed with bearish bias
Short-term outlook: mixed
MT outlook: bearish
LT outlook: bearish
Trading position (short-term): In our opinion no positions are justified from the risk/reward perspective.
AUD/USD

Quoting our last Forex Trading Alert:
(…) in our opinion, the first signal of an improvement will be a breakout above the short-term declining resistance line based on the Oct.23 and Jan.13 highs (marked with dark blue) and an increase above the very short-term blue rising resistance line.
As you see on the above chart, we see that AUD/USD rebounded sharply and broke not only above the resistance zone created by December lows and the Jan.22 high, but also above the 23.6% Fibonacci retracement level (based on the entire Oct.-Jan. decline) and the short-term declining resistance line. This is a strong bullish signal. Please note that with this upswing, the pair reached the very short-term blue rising resistance line. If it is broken, we will likely see further improvement and the next upside target will be the 38.2% Fibonacci retracement level, which corresponds to the Jan. 13 high. Looking at the position of the indicators, we see that they still support the bullish case.
Very short-term outlook: bullish
Short-term outlook: mixed with bullish bias
MT outlook: bearish
LT outlook: bearish
Trading position (short-term): In our opinion, opening long positions is a good idea: stop-loss order: 0.8728 and an upside target: slightly below 0.9075. The above is not an investment / trading advice and please note that trading (especially using leveraged instruments such as futures or on the Forex market) involves risk.
Thank you.
Nadia Simmons
Forex & Oil Trading Strategist
* * * * *
Disclaimer
All essays, research and information found above represent analyses and opinions of Nadia Simmons and Sunshine Profits' associates only. As such, it may prove wrong and be a subject to change without notice. Opinions and analyses were based on data available to authors of respective essays at the time of writing. Although the information provided above is based on careful research and sources that are believed to be accurate, Nadia Simmons and his associates do not guarantee the accuracy or thoroughness of the data or information reported. The opinions published above are neither an offer nor a recommendation to purchase or sell any securities. Nadia Simmons is not a Registered Securities Advisor. By reading Nadia Simmons’s reports you fully agree that he will not be held responsible or liable for any decisions you make regarding any information provided in these reports. Investing, trading and speculation in any financial markets may involve high risk of loss. Nadia Simmons, Sunshine Profits' employees and affiliates as well as members of their families may have a short or long position in any securities, including those mentioned in any of the reports or essays, and may make additional purchases and/or sales of those securities without notice.


