Gold Achieves Our Forecast High for This Year


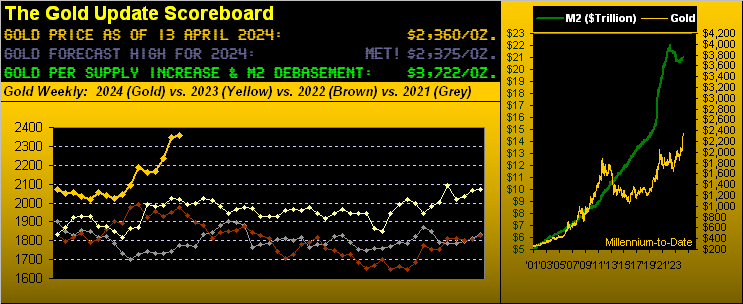
This past Tuesday 09 April at precisely 07:15 GMT, Gold tapped our 2375 forecast high for this year. As we reminded you valued readers a week ago, such call made back on 30 December was couched as “conservative”. And indeed this past week, Gold reached up past “conservative” to another All-Time High yesterday (Friday) at 2449 only to then plunge -98 points (-4.0%) in just five hours — its ninth-largest intraday points drop in history — toward finally settling at 2360.
“Well congrats anyway, mmb. Now are you forecasting a higher, aggressive price for this year?“
We shan’t so do, Squire, having already staked our claim. Still, so as to keep eyebrows raised, let’s reprise that which we herein penned upon making the 2375 call:
“…whenever Gold has had a five-day run into Christmas of better than +1.0%, its average maximum price increase (as measured from the settle of the last trading day before Christmas) through the ensuing year is +23.9%. That average comes from seven qualifying occurrences during 2001 through 2022: and now for 2023 we’ve an eighth occurrence. Thus applying that +23.9% average maximum increase to Gold’s 2065 settle this past 22 December would bring 2557 during 2024 … However: because a) we fully comprehend that “average” is not “reality” and more importantly that b) cash management drives at least some degree of capital preservation … we’ve decided to lop off one standard deviation of that average, which then conservatively forecasts +15.0% above 2065 — thus 2375 — for 2024’s high. Anything beyond that is gravy.”
And with Gold having further ascended to 2449, another portion of giblets for the gravy already is warranted. Whilst we’re not predicting it, 2557 from here at 2360 (+8%) doesn’t seem all that untoward timewise, given we’ve not even completed the year’s first quadrimestris (a little Latin lingo there), albeit Gold remains considerably stretched technically above its BEGOS Markets valuation.
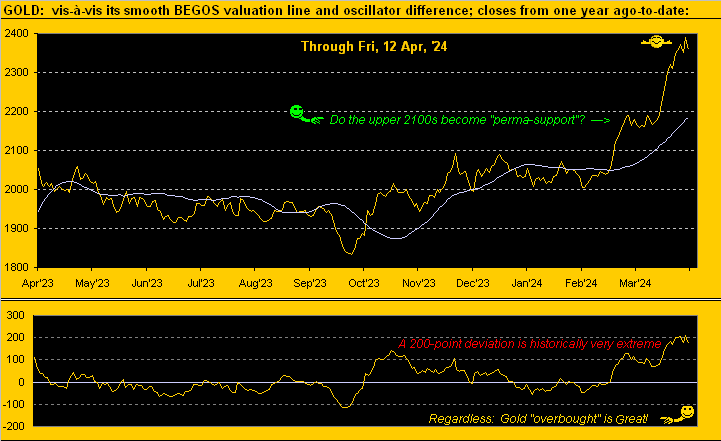
‘Course as last week wrote: “Gold ‘Overbought’ is Great!”. Below from a week ago is our now updated Market Values graphic for Gold vis-à-vis its smooth BEGOS valuation line. The lower panel oscillator (price less value) is still hovering ’round the extremely overbought +200 level. And yet by the opening Gold Scoreboard, price at 2360 is -1362 points below Dollar debasement valuation. Thus near-term Gold is very over-extended; but broad-term Gold remains very undervalued. So ’tis not too late to buy, Kate, even if near-term we see price deteriorate … for Friday’s -98 intraday points-drop is indicative of some fragility. Here’s the graphic:
But notably lost of late in the analytical mix — contra to the “convention wisdom” crowd — is Gold’s strength in tandem with Dollar strength. For it does on occasion occur: recall the first six months of 2010 when Gold and the Dollar Index (DXY) by mid-year were both up respectively by +13% and +10%. And although the percentage moves of the DXY can be diminutive compared to those for Gold, directional correlation is the key. So year-to-date, here are their respective tracks (independently scaled), with both dashed linear regression trendlines clearly in ascent:

Indeed yes, Virginia, even as the DXY (105.820) is now at its highest closing level since 02 November, Gold nonetheless did record that fresh All-Time High yesterday at 2449, price this past week on balance well-eclipsing our 2375 forecast. From a year ago-to-date by Gold’s weekly bars and parabolic trends, here’s how price has gone UP:
As to the Stateside economy, inflation and the Fed, the FinMedia still can’t seem to get the word “cut” out of their head. Steadfastly — despite much math to the contrary — ’tis expected that the Federal Reverse shall cut rates this year: except that there shan’t be three cuts, rather one, and not (so they now say) until after Summer. Or perhaps not at all based on what former TreasSec Larry “Oh Not That Guy” Summers just said this past Thursday, (hat-tip Bloomy): “You have to take seriously the possibility that the next rate move will be upwards rather than downwards…” (We assume he’s actually done the math and/or regularly reads The Gold Update).
And to be sure, at the level of retail inflation, the Consumer Price Index (CPI) for March printed increases of +0.4% for both the Headline and Core readings. Annualized, that pace is +4.8% and the 12-month summations are Headline +3.3% and Core +3.8%. The “good news” is: at the wholesale inflation level, growth in the Producer Price Index (PPI) slowed in March, which can in turn “lead” to lower CPI levels. On verra, but no matter how we slice it, inflation remains running above the Fed-desired +2% annualized pace — and should it not be trending down that way — they may just have to raise.
Either way, in an otherwise light week of incoming data for the Economic Barometer, sustained inflation at the retail level along with other metrics’ deterioration still keeps us in mind of stagflation. Notably (but not widely focused upon), February’s Wholesale Inventories tied for their worst backup since those of December 2022, indicative of product not moving so well. Too, the University of Michigan’s “Go Blue!” Sentiment Survey for April declined from that for March. Thus which way does the Baro itself march? Have a look (should you dare) from a year ago-to-date, the stock market poised for a downward skate:
And just in case you’re scoring at home (courtesy of the “How Can We Fool ‘Em Today Dept.”) as regards The President’s “inflation was skyrocketing” comment: when “they” took office on 20 January 2021, the 12-month summed data through December 2020 was as follows: CPI Headline +1.3%, its Core +1.5%, PPI Headline +1.4% and its Core +1.3%. (Oopsie Joey…)
Too, the “Casino 500” appears at long-last to be encountering an oopsie of its own, having recorded back-to-back down weeks for the first time since those ending last 20 and 27 October. Our honestly-calculated capitalization-weighted “live” price/earnings ratio of the S&P is now 45.3x and the yield but 1.384%, whilst risk-free U.S. three-month dough pays an annualized 5.230%. (A word to the wise is sufficient).
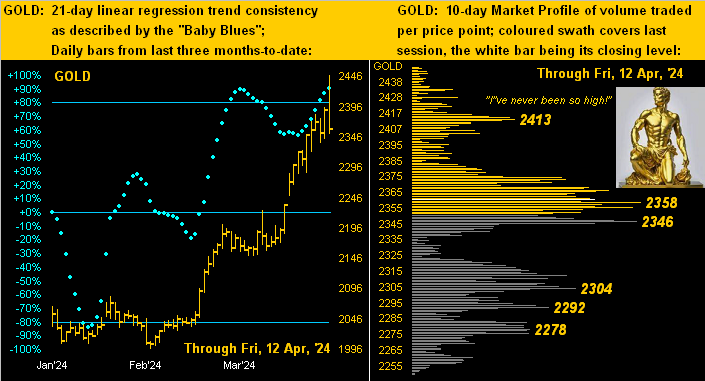
To our two-panel Gold graphic we go, featuring the Daily Bars from three months ago-to-date on the left, and 10-day Market Profile on the right. The baby blue dots of trend consistency clearly depict Gold’s strong uptrend, albeit the Profile shows us how far the yellow metal fell from grace just yesterday (the white bar being present price):
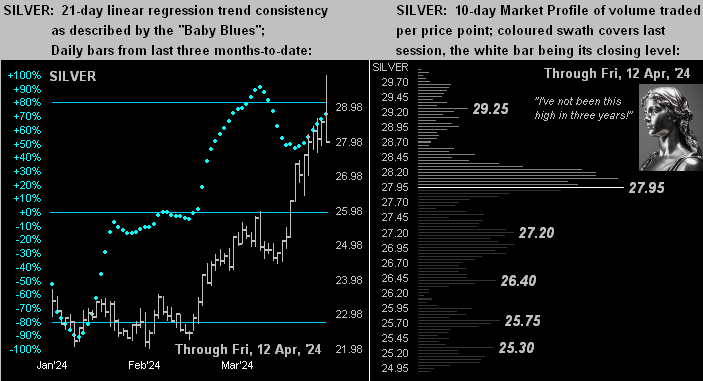
And with the same drill for Sister Silver, both her Baby Blues at left and Profile at right fairly mirror those of Gold. Silver’s high this past week of 29.905 hadn’t previously traded since 01 February 2021. Yet, the Gold/Silver ratio remains historically high at 84.4x versus the century-to-date average of 68.2x. By that average given Gold today at 2360, Silver “ought be” 34.67 (rather than the present 27.97). So obviously whilst Gold fundamentally remains cheap, Silver remains super cheap! Here she is:
To sum it all up with further Gold highs intact, let’s wrap with the stack:
The Gold Stack
Gold’s Value per Dollar Debasement, (from our opening “Scoreboard”): 3722
Gold’s All-Time Intra-Day High: 2449 (12 April 2024)
2024’s High: 2449 (12 April 2024)
10-Session directional range: up to 2449 (from 2249) = +200 points or +8.9%
Trading Resistance (Profile selection): 2413
Gold’s All-Time Closing High: 2391 (11 April 2024)
Gold Currently: 2360, (expected daily trading range [“EDTR”]: 44 points)
Trading Support (Profile selections): 2358 / 2346 / 2304 / 2292 / 2278
10-Session “volume-weighted” average price magnet: 2340
The 2000’s Triple-Top: 2089 (07 Aug ’20); 2079 (08 Mar’22); 2085 (04 May ’23)
The Weekly Parabolic Price to flip Short: 2023
The 300-Day Moving Average: 1996 and rising
2024’s Low: 1996 (14 February)
The Gateway to 2000: 1900+
The Final Frontier: 1800-1900
The Northern Front: 1800-1750
On Maneuvers: 1750-1579
The Floor: 1579-1466
Le Sous-sol: Sub-1466
The Support Shelf: 1454-1434
Base Camp: 1377
The 1360s Double-Top: 1369 in Apr ’18 preceded by 1362 in Sep ’17
Neverland: The Whiny 1290s
The Box: 1280-1240
Next week brings 13 metrics into the Econ Baro, plus Q1 Earnings Season ramps up, notably featuring financial institutions. We indeed sported a wry smile yesterday over the FinMedia’s concern of Wells Fargo (WFC) having beaten earnings “estimates”, but the stock then falling “on the news”. Perhaps ’twas because the company actually made less money than a year earlier, (but we’re not supposed to point that out). Best to point to that which broadly makes money and secures your world of wealth: Gold!
Cheers!
…m…
www.TheGoldUpdate.com
www.deMeadville.com
and now on “X”: @deMeadvillePro
********

Mark Mead Baillie has had an extensive business career beginning in banking and financial services for two years with Banque Nationale de Paris to corporate research for three years at Barclays Bank and then for six years as an analyst and corporate lender with Société Générale.
For the last 22 years he has expanded his financial expertise by creating his own financial services company, de Meadville International, which comprehensively follows his BEGOS complex of markets (Bond/Euro/Gold/Oil/S&P) and the trading of the futures therein. He is recognized within the financial community of demonstrating creative technical skills that surpass industry standards toward making highly informed market assessments and his work is featured in Merrill Lynch Wealth Management client presentations. He has adapted such skills into becoming the popular author each week of the prolific “The Gold Update” and is known in the financial website community as “mmb” and “deMeadville”.
Mr. Baillie holds a BS in Business from the University of Southern California and an MBA in Finance from Golden Gate University.


